Phosphorus Embodied in the Global Food Supply Chain: The Role of Food Loss and Waste
May 13, 2026
PAER-2026-21
Anabeth Jennings, MS Student; Maksym Chepeliev, Research Associate Professor
![]()
![]()
![]()
![]()
![]()
The Role of Phosphorus in Global Food Systems and Its Link to Food Loss and Waste
Agriculture has become reliant on phosphorus (P), a non-renewable resource essential for plant growth (Cordell et al., 2009; Scholz & Wellmer, 2015). Furthermore, there is no substitute for P for plants (van Vuuren et al., 2010), so maintaining its availability is crucial for food security. While nearly half of global croplands suffer from a soil-P deficit (Lun et al., 2021), inefficient and excessive use of P fertilizer can cause problems for the environment (Cordell et al., 2009; Nedelciu et al., 2020; Yang et al., 2019). Almost half of the cropland areas with low phosphorus use efficiency (PUE) correspond to high fertilizer use (MacDonald et al., 2011). High PUE areas either indicate more reliance on drawing P from the soil legacy (and less on P inputs) or more efficient use of applied P (MacDonald et al., 2011). When PUE is low, more P from fertilizers remains in the soil, leading to P accumulation that increases the risk of losses through runoff or erosion. As a result, some of the P applied to crops or embedded in agricultural commodities ends up dispersed in soils or water without being recycled, contributing to the wasteful use of P (Bai et al., 2023). This loss can exacerbate environmental problems. The main concern for P loss is excess P entering bodies of water, causing excessive plant and algae growth, called eutrophication. Eutrophication can lead to low oxygen levels in the water that cannot support most aquatic life, called hypoxia. Some aquatic ecosystems that have excess P are Lake Erie and the Gulf of Mexico (Haque, 2021). Beyond inefficient P fertilizer use at the production stage, food loss and waste (FLW) further reduce the efficiency of P use by representing the loss of agricultural commodities in which P fertilizer inputs are embodied.
To quantify FLW, previous studies applied a specific FLW share at the point of final food consumption using a global-average rate (e.g., Vaccari et al., 2019) or a country-specific study (e.g., Li et al., 2020), without accounting for the composition of FLW across stages and the geographical sourcing of food supply. Without such a decomposition of FLW-embedded P flows along the global supply chains, available estimates of the corresponding flows not only suffer from the potential misrepresentation but also substantially limit their policy applicability due to their aggregate nature. For example, consumer demand for meat products requires feed crops such as maize and soybeans, which are produced relying on P fertilizers. Without understanding how the P embedded in FLW is distributed along each stage of the supply chain, policies may be limited to targeting final consumption, despite losses occurring throughout the entire supply chain. Even when PUE at the farm level is relatively high, the P embodied in these upstream inputs can be effectively lost if the final food product is wasted. Moreover, FLW is projected to increase by 52% from current levels if historical trends continue (Gatto & Chepeliev, 2025). Continued growth in FLW could therefore offset improvements in farm-level efficiency by reducing the effective use of P inputs embodied the food production.
To better understand how P from fertilizers applied on farms moves through the global food system and contributes to P embodied in FLW, this study uses a multi-regional input-output (MRIO) model based on the Global Trade Analysis Project Circular Economy (GTAP-CE) v11 database (Chepeliev, 2026). Earlier studies tracing P flows typically aggregated total nutrient P without distinguishing its source (e.g., Nesme et al., 2018). Recent work (e.g., Yang et al., 2019) has begun to trace P fertilizers embodied in trade; however, it did not explicitly focus on the FLW-embedded P. Previous studies provided aggregate estimates of P lost through FLW attributed to the point of final consumption (e.g., Li et al., 2020; Vaccari et al., 2019). However, estimates remain missing on how P embodied in agricultural commodities moves through the global food supply chain and the fraction that is lost due to FLW across stages. The results presented in this study aim to identify P loss hotspots (across regions, commodities, and stages), informing future policies and investment decisions toward more sustainable P management practices.
Analytical Framework: Multi-Region Input-Output Model
In this study, an MRIO analysis is used to calculate the P embodied in agricultural commodities, which allows environmental impacts in one region to be traced to final consumption in another (Yang et al., 2019). The MRIO table used for the analysis is from the GTAP circular economy (GTAP-CE) v11 database, with a reference year of 2017, and has 99 sectors covering 160 countries/regions (Chepeliev, 2026). To trace material flows, the material footprint indicator was used, which is a consumption-based indicator that measures total raw materials needed to satisfy final demand, regardless of where the materials are from.
The MRIO framework was extended to compute the P embodied in commodities in each region. P fertilizer applied to crops is mapped to primary commodities and enters the economy where it is processed, traded, and consumed across a range of commodities. Therefore, the destination country captures the full downstream footprint of P fertilizer application to crops regardless of the final product type. Each flow can be attributed to its source country, so every country’s P embodied in consumption can be decomposed into domestically and foreign-sourced components.
The FLW estimates are based on the methodology developed by Gatto and Chepeliev (2024), who conducted an extensive literature review and constructed a detailed global FLW database. The database defines five stages of the food supply chain: agricultural production, post-harvest, manufacturing, distribution and retail, and final consumption. Each stage is mapped to a GTAP sector. Production and post-harvest are linked to primary production; manufacturing is linked to intermediate food production; distribution and retail represent food flows from manufacturing to final consumption; and the consumption stage is linked to final consumption in the GTAP-FBS database. Food loss refers to the food lost at the production, intermediate use, and processing stages, and food waste refers to the fraction of food that is not consumed at the final consumption stage.
Rather than using physical quantities, FLW is expressed as percentage shares of food lost and wasted at each stage to provide consistency across regions and years. The physical food supply, measured in tons, is quantified using the Global Trade Analysis Project Food Balance Sheets (GTAP-FBS) database (Chepeliev, 2022). The FLW share for each primary commodity is multiplied with its corresponding physical flow to estimate the quantity of FLW. There is an explicit distinction between food flows that go through manufacturing and those that are consumed fresh. These FLW shares are integrated with the GTAP-CE-based MRIO framework to trace food flows (tons) from production to final consumption and to quantify where and at which stage FLW occurs globally.
When production and consumption occur in the same country, all FLW is generated domestically. For traded products, upstream losses (production and post-harvest) are attributed to the exporting country, and downstream losses (distribution, retail and consumption) to the importing country. Manufacturing losses are assigned according to where the processing occurs. These assignments allow FLW shares to be attributed to specific countries/regions and stages of the supply chain.
Decomposing Phosphorus Embedded in Global Food Loss and Waste
As P moves through the food supply chain, it can be lost through FLW at multiple stages. In 2017, the total amount of P embodied in FLW across all regions and commodities is estimated at 11.8 mmt (28% of the total P embodied in consumption). Losses of embodied P vary across supply chain stages, with the consumption stage accounting for the largest share (3.2 mmt), followed by agricultural production (2.8 mmt), post-harvest and storage (2.7 mmt), retail and distribution (1.6 mmt), and manufacturing (1.5 mmt).
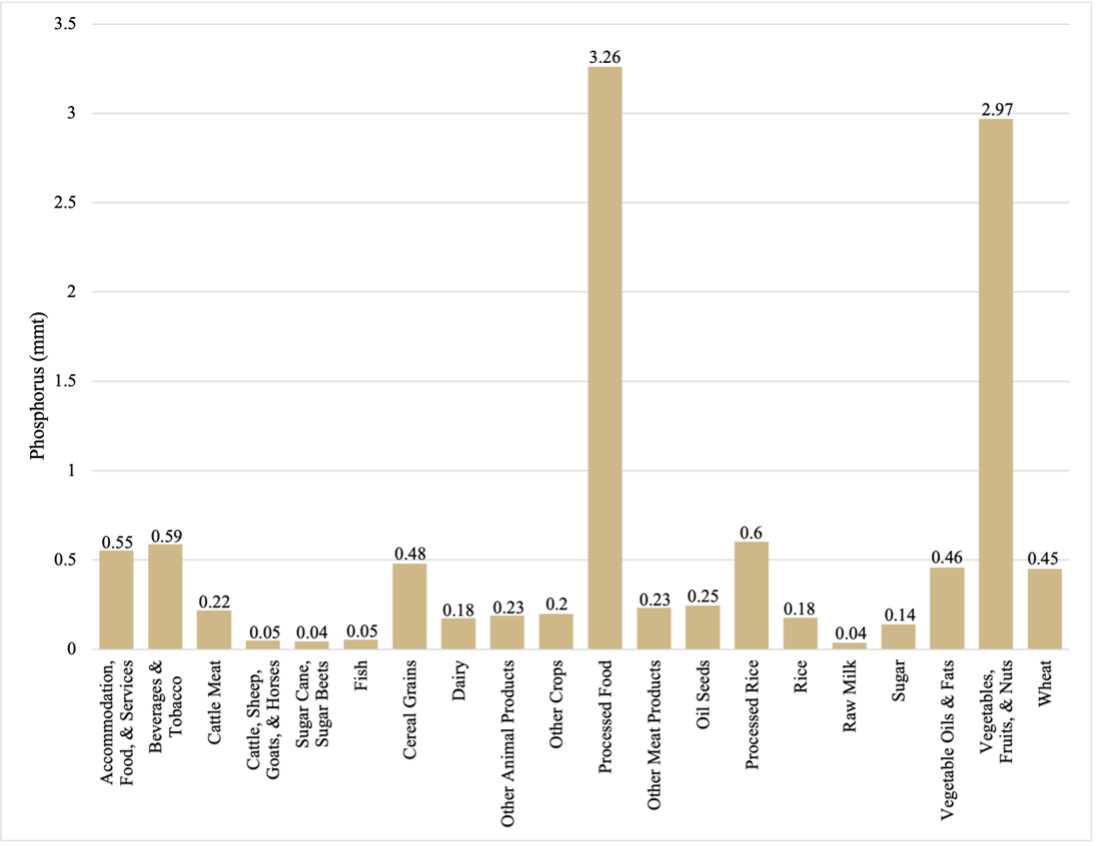
Commodities contribute to a varying level of embodied P lost through FLW (Figure 1). The commodities with high levels of embodied P tend to exhibit high amounts of P embodied in FLW. Processed food accounts for the largest amount of P embodied in FLW once it reaches the final consumption stage, totaling 3.3 mmt. Vegetables, fruits, and nuts follow closely, with 3 mmt of P embodied in FLW. Beverages and tobacco, as well as vegetable oils, contribute to smaller losses, with 0.6 of embodied P lost through FLW in each commodity.
Figure 1
The amount of phosphorus embodied (mmt) in global FLW by commodity, 2017
In absolute terms, China (3.3 mmt), the U.S. (1.4 mmt), and India (0.6 mmt) are the largest hotspots for P embodied in FLW. Many of the countries with the smallest amount of P embodied in FLW are in Africa, including the Central African Republic, Chad, and Comoros.
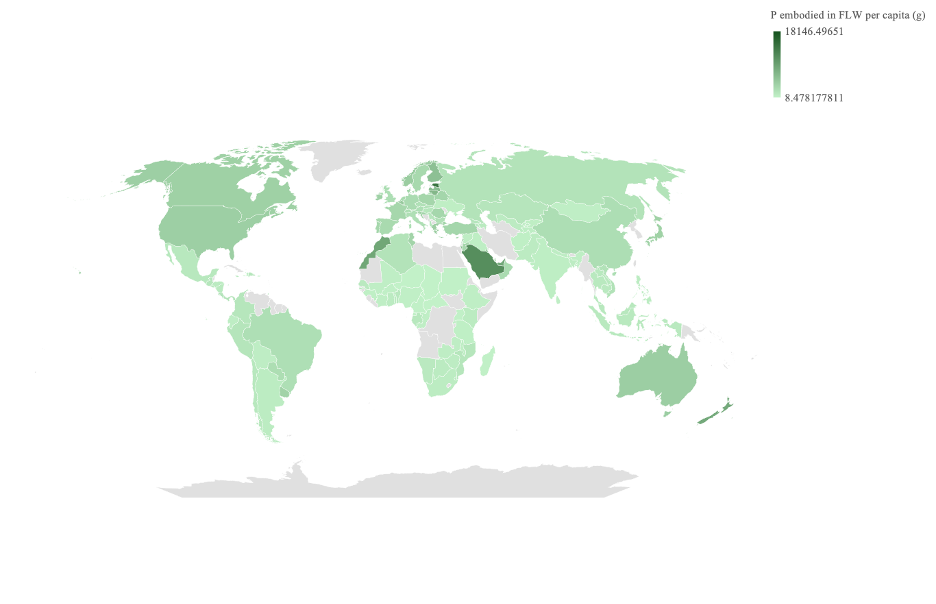
The global average amount of P embodied in FLW is 1,613 g per capita. Palestine loses the most embodied P to FLW at 18,435 g per person per year (Figure 2), with 98% of the embodied P consumed in Palestine coming from domestic sources. In contrast, countries across the African continent generally exhibit some of the lowest per-capita rates of P embodied in FLW. While some countries primarily lose P through FLW from domestic sources, others import most of the embodied P that is lost to FLW. Germany lost 2526 g of P per person per year to FLW, with 77% of its embodied P imported. In the US, 71% of its P embodied in consumption is from domestic sources and loses 4272 g per person per year to FLW. Differences in per capita P embodied in consumption are driven by multiple factors, including PUE, composition of food demand, degree of reliance on organic fertilizers, composition of fertilizer mixes (i.e., N, P, K), among others.
Figure 2
Phosphorus embodied in FLW per capita (g) by country in 2017
While absolute losses highlight the countries and commodities contributing most to P embodied in FLW, considering the intensity of losses relative to total consumption provides additional insights. FLW intensity measures the share of P associated with FLW for each commodity and country relative to total P embodied in consumption for that country. Around 28% (11.8 mmt) of the applied P were embodied in FLW. Of the total embodied P consumed in a country, some lose nearly half to FLW. For example, New Zealand and Palestine each lose around 42% of embodied P to FLW, equivalent to 0.04 and 0.08 mmt. In contrast, although the U.S. and China lose a smaller share of embodied P to FLW (33% and 30%, respectively), each has a much higher consumption of total embodied P, which results in substantially larger absolute losses of 1.4 and 3.2 mmt, respectively. India consumes a total of 5.3 mmt of embodied and 10% is lost through FLW, that is an absolute loss of 0.6 mmt.
Identifying Key Hotspots and Potential Policy Solutions
P inefficiencies are not just an issue at the farm level; they occur at each stage of the supply chain. Our results suggest that the majority of P embodied in FLW is at the consumption stage, often driven by substantial food waste occurring in many high-income countries. For instance, in the EU-27 and North America, food supply at the household level is around 3,600-3,800 kcal per capita per day (Gatto & Chepeliev, 2025), which exceeds the average adult energy requirements, recommended by the National Health Service, by more than 1,100 kcal. A substantial portion of this supply ends up as food waste.
Almost two-thirds of the P lost through FLW are from vegetables, fruits, and nuts, processed foods, and accommodation, food, and services (out-of-home food consumption). When focusing on decreases in P demand, the reduction of food waste is 80 times more effective than recycling (Vaccari et al., 2019). Reducing food waste could alleviate demand for P fertilizer use at the production stage. Several existing policies focus on reducing food waste. For example, the UN Sustainable Development Goals (SDG 12.3) aims to halve global food waste by 2030. A current policy in France called the Garot Law, enacted in 2017, requires large supermarkets to partner with a food bank to freely give unsold food products, rather than destroying them (Ministry of Agriculture and Food, 2019).
While consuming large amounts of embodied P is not inherently problematic, environmental concerns arise when the P is lost and not reused or recycled. The total level of P embodied in consumption is not correlated with the intensity of FLW. For example, China, India, and the U.S. are major hotspots for P embodied in consumption. In terms of FLW, China and the U.S. both lose around 30% of their embodied P to FLW. In comparison, India, while consuming a large amount of embodied P, has a lower FLW intensity of around 10%. However, the remaining P embodied in consumed commodities may still be lost through wastewater or recovered through reuse and recycling within the food system. For instance, food waste can be reused for animal feed, and animal manure can be recycled for land application as an organic P input. The MRIO framework applied in this study does not account for P recycling or recovery processes, which could be incorporated in future research to better capture the full P cycle associated with food consumption. The intensity of FLW is associated with multiple factors. Gatto and Chepeliev (2025) project that FLW will rise by half of the current levels by 2050, driven largely by demographic growth, rising incomes, and trade-related spillovers. These spillover effects occur when changes in consumption, production, or trade in one region indirectly affect FLW in other regions. Dietary shifts alone were found to be insufficient to curb these trends. But dietary shifts paired with targeted FLW reduction policies could mitigate spill-over effects (Gatto & Chepeliev, 2025).
Increasing Phosphorus Efficiency Requires Solutions Along the Entire Supply Chain
P will remain a critical nutrient in agriculture because it is essential for plant growth and has no substitute. But concerns regarding the long-term availability of P and increasing environmental impacts of its use continue to grow. This study traced P through the global agri-food supply chains with a particular focus on P embodied in FLW. Overall, 11.8 million metric tons (mmt) of P was embodied in FLW in the global food supply chain in 2017. P losses occur at each stage of the supply chain, including production (24%), post-harvest (23%), retail and distribution (13%), manufacturing (12%), and the consumption stage (27%). On average, 1,613 g of P per capita was lost globally through FLW. These findings demonstrate that improving P efficiency requires looking beyond farm-level processes and considering inefficiencies occurring at each stage of the supply chain. Policies aimed at reducing food waste could play an important role in improving P sustainability and mitigating environmental impacts such as eutrophication.
References
Bai, Z., Liu, L., Obersteiner, M., Mosnier, A., Chen, X., Yuan, Z., & Ma, L. (2023). Agricultural trade impacts global phosphorus use and partial productivity. Nature Food, 4, 762–773. https://doi.org/10.1038/s43016-023-00822-w
Chepeliev, M. (2022). Incorporating nutritional accounts to the GTAP data base. Journal of Global Economic Analysis, 7(1). https://doi.org/10.21642/JGEA.070101AF
Chepeliev, M. (2026). Global Trade Analysis Project circular economy (GTAP-CE) data base version 11 (GTAP Research Memorandum No. 40). Center for Global Trade Analysis.
Cordell, D., Drangert, J.-O., & White, S. (2009). The story of phosphorus: Global food security and food for thought. Global Environmental Change, 19(2), 292–305. https://doi.org/10.1016/j.gloenvcha.2008.10.009
Haque, E.S. (2021). How Effective Are Existing Phosphorus Management Strategies in Mitigating Surface Water Quality Problems in the U.S.? Sustainability 13(21), 6565. https://doi.org/10.3390/su13126565
Gatto, A., & Chepeliev, M. (2024). Global food loss and waste estimates show increasing nutritional and environmental pressures. Nature Food, 5, 136–147. https://doi.org/10.1038/s43016-023-00915-6
Gatto, A., & Chepeliev, M. (2025). Integrating food loss and waste reduction policies with global dietary shifts: an economic modelling study. The Lancet Planetary Health, 9(10). https://doi.org/10.1016/j.lanplh.2025.101285
Li, B., Yin, T., Udugama, I. A., Dong, S. L., Yu, W., Huang, Y. F., & Young, B. (2020). Food waste and the embedded phosphorus footprint in China. Journal of Cleaner Production, 252, 119909. https://doi.org/10.1016/j.jclepro.2019.119909
Lun, F., Sardans, J., Sun, D., Xiao, X., Liu, M., Li, Z., Wang, C., Hu, Q., Tang, J., Ciais, P., Janssens, I. A., Obersteiner, M., & Peñuelas, J. (2021). Influences of international agricultural trade on the global phosphorus cycle and its associated issues. Global Environmental Change, 69, 102282. https://doi.org/10.1016/j.gloenvcha.2021.102282
MacDonald, G. K., Bennett, E. M., Potter, P. A., & Ramankutty, N. (2011). Agronomic phosphorus imbalances across the world’s croplands. Proceedings of the National Academy of Sciences, 108(7), 3086–3091.
Ministry of Agriculture and Food. (2019). Evaluation of the application of the provisions of the law of 11 February 2016 on the fight against food waste, and the implementing decree of 28 December 2016. https://agriculture.gouv.fr/telecharger/116052
Nedelciu, C.E., Ragnarsdottir, K.V., Schlyter, P., Stjernquist, I. (2020). Global phosphorus supply chain dynamics: Assessing regional impact to 2050. Global Food Security, 26, 100426. https://doi.org/10.1016/j.gfs.2020.100426
Scholz, R. W., & Wellmer, F.-W. (2015). Losses and use efficiencies along the phosphorus cycle. Part 1: Dilemmata and losses in the mines and other nodes of the supply chain. Resources, Conservation and Recycling, 105(Part B), 216–234. https://doi.org/10.1016/j.resconrec.2015.09.020
Vaccari, D. A., Powers, S. M., & Liu, X. (2019). Demand-driven model for global phosphate rock suggests paths for phosphorus sustainability. Environmental Science & Technology, 53(17), 10406–10414. 10.1021/acs.est.9b02464
Van Vuuren, D.P., Bouwman, A.F., Beusen, A.H.W. (2010). Phosphorus demand for the 1970–2100 period: A scenario analysis of resource depletion. Global Environmental Change, 20(3), 428–439. https://doi.org/10.1016/j.gloenvcha.2010.04.004
Yang, H., Liu, Y., Liu, J., Meng, J., Hu, X., & Tao, S. (2019). Improving the imbalanced global supply chain of phosphorus fertilizers. Earth’s Future, 7(6), 638–651. https://doi.org/10.1029/2018EF001005
![]()
![]()
![]()
![]()
![]()
