U.S. Climate Policy Revisited: Macroeconomic and Distributional Impacts of the Paris Agreement
March 4, 2021
PAER-2021-1
Authors: Maksym Chepeliev, Research Economist; and Dominique van der Mensbrugghe, Director and Research Professor
![]()
![]()
![]()
![]()
![]()
Virtually all of the countries in the world signed the 2015 Paris Agreement whose objective is to “hold the increase in the global average temperature to well below 2°C above pre-industrial levels and pursue efforts to limit the temperature increase to 1.5°C above pre-industrial levels…” (UNFCCC, 2020).[1] As such, 195 parties, including the European Union (EU), have submitted their individual commitment, also called the Nationally Determined Contribution (NDC), and action plans to achieve their commitments through 2030. While it is widely recognized that current NDC commitments are not ambitious enough to limit global warming below 2°C (Rogelj et al., 2016), the Paris Agreement represents a crucial step towards global cooperation to take actions to limit climate changing emissions.
Since the signing of the Paris Agreement, climate policies have been diverging among top global emitters. While the EU has proceeded with developing ambitious mitigation plans under the EU Green Deal proposal (e.g. Chen et al., 2020), U.S. climate policy has been in a phase of considerable flux. The Trump administration withdrew from the Paris Agreement and relaxed environmental regulations, providing more support to fossil fuels.
Even under the Paris Agreement, the U.S. climate mitigation commitment was not considered stringent enough to be consistent with the 2°C goal (Figure 1). The COVID-19 pandemic has somewhat shifted down the ‘current policy’ emission trajectory, but emissions are expected to partially rebound in 2021 and the pandemic is unlikely to have a major impact on the long-term emission trend (Figure 1).
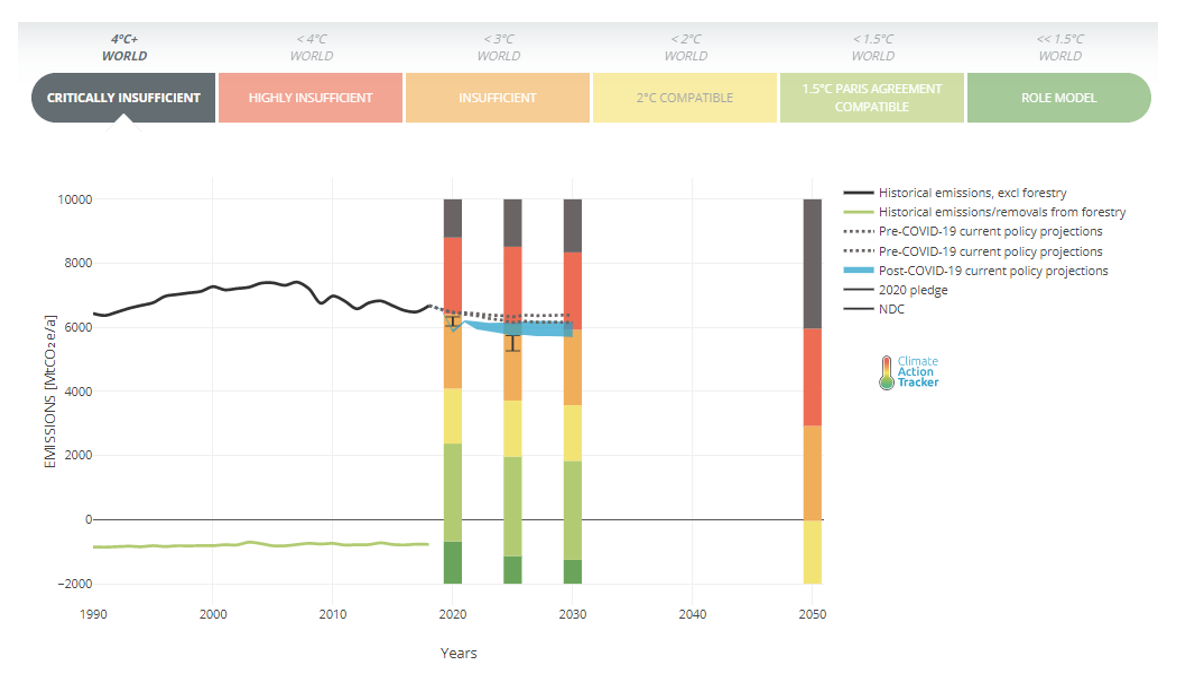
Figure 1. U.S. climate mitigation pledges and emission targets
Source: Climate Action Tracker (https://climateactiontracker.org/countries/usa/).
The new Biden administration has stated ambitious climate plans. These include carbon free electricity by 2035 and reaching net zero emissions by 2050, which would be just in a range to be compatible with the 2oC mitigation effort. One of the first moves of President Biden was to have the U.S. rejoin the Paris climate accord. Although bringing multiple benefits to the environment and public health, implementation of the NDC and more stringent climate mitigation targets would result in additional costs to the U.S. economy, impacting the energy sector, agricultural producers, households and other agents. But what are these costs and how are they distributed between different groups of producers and consumers?
Analytical framework and emission reduction scenarios
In a recent study (Chepeliev et al., 2021), we examine the distribution of these costs using two state of the art mathematical models known as ENVISAGE[2] (van der Mensbrugghe, 2019) and GIDD (Bussolo et al., 2010)[3].
Our analysis relies on a baseline scenario of macroeconomic, energy and emission profiles that are based on the 2018 World Energy Outlook projections. For comparison with the baseline of economic outcomes, we consider three policy scenarios imposed on top of the baseline pathway—NDC (consistent with unconditional NDC targets), NDC+ (consistent with conditional NDC targets[4]) and NDC-2C (a more ambitious scenario consistent with a 2oC pathway).[5] To achieve the carbon emissions reduction target, we consider different carbon pricing options, including a no trade scenario, where each country/region reaches identified climate mitigation goal using domestic policies only; global trade in CO2, where trading in CO2 between all countries/regions of the world is assumed resulting in a globally uniform carbon price;[6] and several options of partial sectoral and/or regional trade coalitions. Carbon revenues are directly related to the ENVISAGE model’s representative household. The value of carbon revenue recycling is captured in the GIDD microsimulation model via a uniform shift in the average household income to match the aggregate changes seen in the ENVISAGE model.
We first estimate the impacts of the NDC pathways under different carbon pricing mechanisms using the ENVISAGE CGE model and then link these outcomes to the GIDD modelling framework to estimate the distributional consequences of the climate policies. In the assessment we consider CO2 emissions from fossil fuel combustion only.
Impacts on the U.S. macroeconomy
Carbon pricing policies result in a moderate reduction in real income, as under the NDC target and no climate cooperation scenario, household income in the U.S. falls by around 0.17% in 2030 (relative to the no climate policy baseline) (Figure 2). Under a more ambitious target, consistent with keeping global warming below 2°C above pre-industrial levels and which is more in line with the current administration’s plans, welfare falls by around 0.55% in 2030.[7] If the U.S. is part of a globally cooperative effort, estimated welfare losses are mitigated significantly—a reduction of only 0.06% under the NDC target and 0.27% under the more stringent NDC-2C scenario (Figure 2). It should be noted that compared to other developed countries and regions considered in our assessment (e.g. EU, Canada, Australia and New Zealand), the U.S. is among the least impacted countries under both NDC and NDC-2C scenarios.
The price of carbon with the NDC target and no climate cooperation is around $38/tCO2, while pursuing the more ambitious mitigation goal (NDC-2C) would result in a carbon price of around $125/tCO2. If implemented, global climate cooperation can significantly reduce these costs (Figure 2).
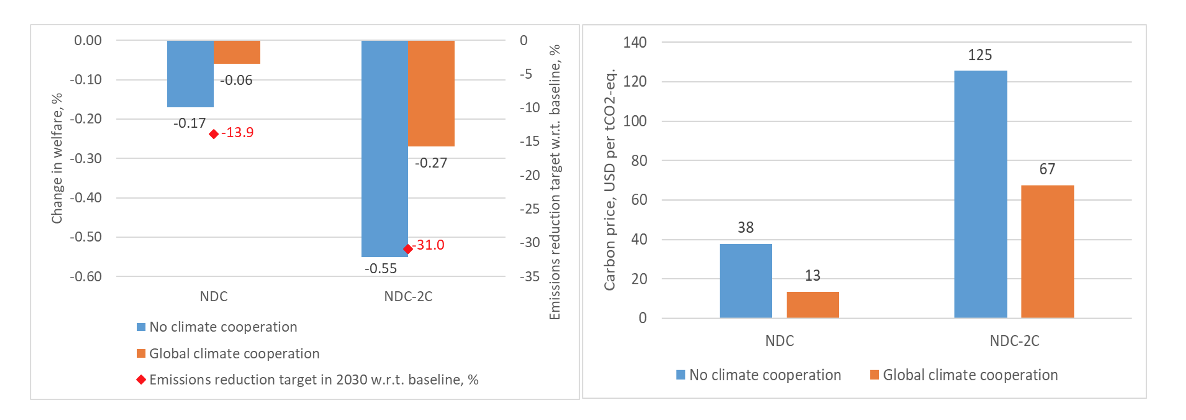
Figure 2. Macroeconomic impacts (left chart) and carbon prices (right chart) required to reach the NDC and NDC-2C emissions reduction target in US, change in 2030 relative to baseline case
Source: Authors’ estimates.
Notes: Changes in welfare are measured using Hicks equivalent variation.
Impacts for sectors of the U.S. economy
Not all sectors would be equally impacted by the climate mitigation policies. Production of fossil fuels and fossil-fuel-based electricity generation are among sectors with the largest reduction in output (Figure 3). Under the NDC scenario (and no climate cooperation), output of coal would decrease by 23.7% in 2030 (relative to baseline), followed by fossil-fuel power generation (-21.0%), natural gas (-19.1%), crude oil (-5.0%) and petroleum products (-3.3%). Non-fossil-fuel power generation is the prime beneficiary of the climate mitigation policy implementation with output increasing 6% under the NDC scenario. No significant changes are observed for other sectors, as both primary agriculture and processed food experience a minor loss of 0.2%, while service sectors grow by around 0.1%. Qualitatively similar impacts, though with a much higher deviations from the baseline are observed under the NDC-2C scenario, where coal production and fossil-fuel power generation would suffer a loss of almost half of their output, while non-fossil-fuel electricity generation grows by around 15% (Figure 3). Under the NDC case aggregate economy-wide output falls by around 1.2%, while in the NDC-2C scenario by 2.8%.
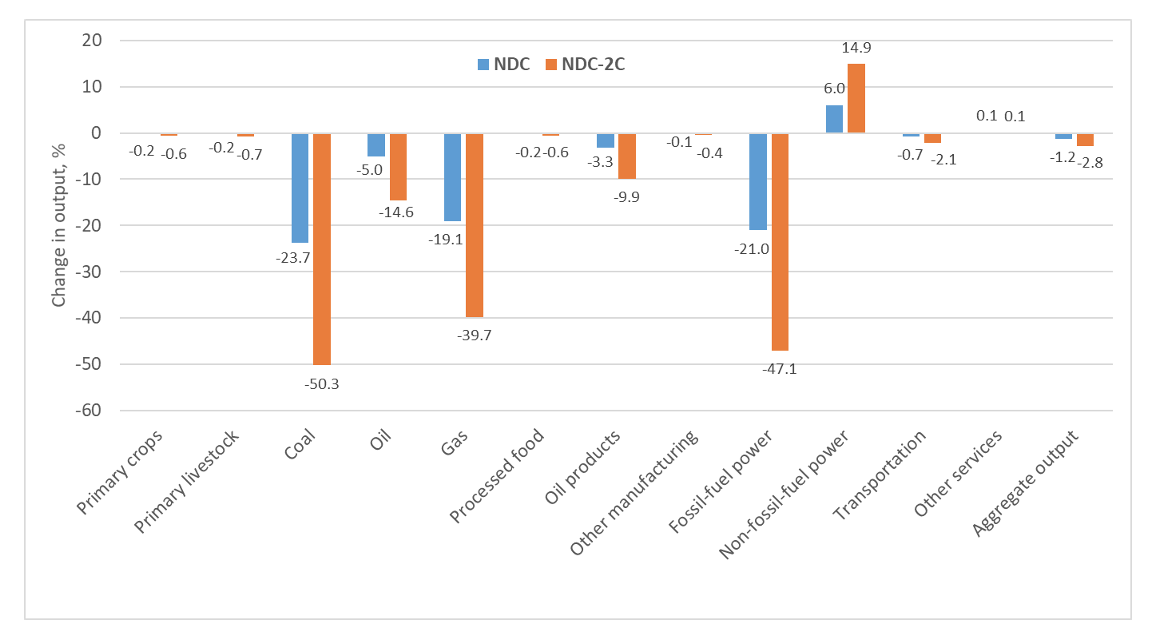
Figure 3. Change in output by sectors in 2030 for the case of no climate cooperation, % relative to baseline case
Source: Authors’ estimates.
Notes: Results for the 28 sectors represented in the model are aggregated to 12 more broad categories for reporting purposes.
Impacts on U.S. households
An increase in carbon prices puts pressure on energy prices, which in turn increases the cost of food commodities, as fuel and transportation services become more expensive. On average, non-food commodity prices increase more than food commodities because “non-food” includes energy and energy intensive goods. Under the NDC scenario (and no climate cooperation), food prices in the U.S. increase by 0.4%, while non-food prices grow by around 0.7% (these increase to 1.1% and 1.8% respectively under the NDC-2C scenario).[8] As the share of households’ income spent on food and beverages decreases with income,[9] relative reduction in food prices benefits lower income groups and results in progressive outcomes (Figure 4). Pursuing a more stringent climate mitigation effort (NDC-2C) results in a more progressive distributional consequence (compared to the NDC scenario), due to the higher relative reduction in food prices.
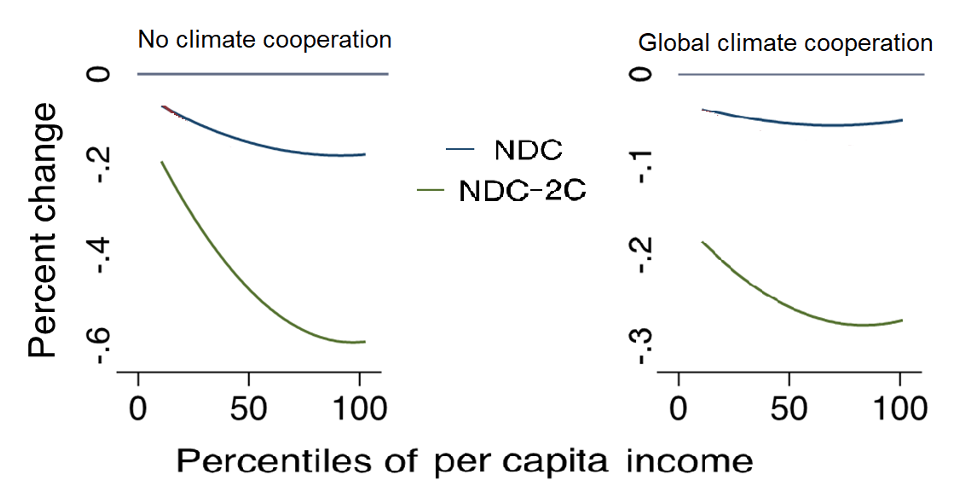
Figure 4. Growth Incidence Curves under different modes of climate cooperation and emission reduction targets
Source: Authors’ estimates.
Closing comments
The new Biden administration has targeted climate policy as one of the areas where they will pursue ambitious efforts. Within days of taking office, the U.S. rejoined the Paris Agreement and announced their commitment to go beyond Paris commitments to set a path that results in net zero emissions by 2050. Our estimates suggest that if implemented, such policies would result in limited negative economic impacts through 2030. NDC implementation would lead to a real income reduction of only 0.17% in 2030 (relative to the no climate policy baseline), while a more ambitious policy consistent with limiting global warming below 2oC would reduce real income by 0.55%. If the U.S. and other countries engage in cooperative climate actions that incorporate trade, the corresponding real income losses are reduced substantially (losses are estimated to be 0.06% and 0.27% respectively).
Negative sectoral impacts are mostly limited to the production of fossil fuels and fossil-fuel-based electricity generation, while renewable electricity is estimated to receive the largest benefit of climate mitigation. A key finding of the study is the effect of climate action on the U.S. income distribution. Climate mitigation policies deliver progressive changes to the income distribution with gains accruing disproportionately to poorer households. Moreover, moving to more ambitious climate targets expands the inequality reducing effects – increasing the relative benefit to poorer households. When coupled with the significant environmental and health co-benefits that follow from climate mitigation efforts (e.g. Saari et al., 2015), the analysis here offers significant potential benefits that follow from pursuit of ambitious climate action.
For more information
Chepeliev, M., Osorio-Rodarte, I., and van der Mensbrugghe, D. 2021. Distributional Impacts of Carbon Pricing Policies under Paris Agreement: Inter and Intra-Regional Perspectives. GTAP Working Paper No. 88. https://www.gtap.agecon.purdue.edu/resources/res_display.asp?RecordID=6194
References
Böhringer, C., Peterson, S., Schneider, J., Winkler, M. 2020. Carbon Pricing after Paris: Overview of Results from EMF 36. Paper presented during the 23rd Annual Conference on Global Economic Analysis (Virtual Conference). https://www.gtap.agecon.purdue.edu/resources/res_display.asp?RecordID=6067
Bussolo, M., De Hoyos R. and Medvedev D. 2010. Economic growth and income distribution: linking macroeconomic models with household survey data at the global level. International Journal of Microsimulation, pages 92-103, 2010.
Chen, J., Chepeliev, M., Garcia-Macia, D., Iakova, D., Roaf, J., Shabunina, A., van der Mensbrugghe, D., and Wingender, P. 2020. EU Climate Mitigation Policy. International Monetary Fund. Departmental paper series No. 20/13. https://www.imf.org/~/media/Files/Publications/DP/2020/English/EUCMPEA.ashx
Peters, J. 2016. The GTAP-Power Data Base: Disaggregating the Electricity Sector in the GTAP Data Base. Vol. 1, No. 1, pp. 209–250. DOI: http://dx.doi.org/10.21642/JGEA.010104AF.
Rogelj et al. 2016. Paris Agreement climate proposals need a boost to keep warming well below 2°C. Nature 534: 631-639.
Saari, R.K., Selin,N.E., Rausch, S., and Tompson, T.M. 2015. A self-consistent method to assess air quality co-benefits from U.S. climate policies, Journal of the Air & Waste Management Association, 65:1, 74-89, DOI: 10.1080/10962247.2014.959139
United Nations Framework Convention on Climate Change (UNFCCC), 2020. Paris Agreement – Status of Ratification. http://unfccc.int/paris_agreement/items/9444.php
van der Mensbrugghe, D., 2019. The Environmental Impact and Sustainability Applied General Equilibrium (ENVISAGE) Model. Version 10.01. Center for Global Trade Analysis, Purdue University. https://mygeohub.org/groups/gtap/envisage-docs
Notes
[1] Changes of 1.5°C and 2.0°C are respectively 2.7°F and 3.6°F.
[2] ENVISAGE stands for “Environmental Impact and Sustainability Applied General Equilibrium” and is a computer model for dynamic analysis of multiple regional economies. The ENVISAGE model used here is calibrated to the GTAP (Global Trade Analysis Project) Power 9.2 Database with base year of 2011 (Peters, 2016). Our aggregation for GTAP Power 9.2 features 28 regions and 29 sectors.
[3] GIDD stands for “Global Income Distribution Dynamics” and is a mathematical model for analysis of earnings and expenditures impacts for different types of households that can be linked directly to a global model like ENVISAGE
[4] The GIDD model makes use of 130 national household surveys compiled and harmonized by the World Bank to provide consistent representation of demographics, education, labor, welfare, and consumption. Many developing countries have proposed more stringent commitments, conditional on additional international commitments, such as financial aid.
[5] It should be noted that countries have submitted their NDC emission reduction targets in different forms—changes in the carbon intensity of GDP, reduction in emissions relative to baseline, reduction in emissions relative to a selected historical year, etc. Some countries have provided a range of emission reduction targets rather than a single number. Though most countries have stated their NDC target for 2030, in some cases other years are reported, e.g. 2025 or 2035. These differences contribute to the uncertainty in the interpretation of the NDC commitments and specific choices have to be made for the harmonization of the Paris Agreement climate targets. For our modelling assessment, all NDC commitments are converted to a reduction in emissions relative to the baseline level in 2030 based on interpretations provided in Böhringer et al. (2020).
[6] In other words, the first scenario has a cap and trade policy where trading is only done within each country/region, the second scenario assumes a cap and trade that applies globally. The first scenario will lead to (perhaps large) differences in the price of carbon across countries, resulting in economic losses as market arbitrage across countries would allow for lowering the global cost. Not all countries would necessarily benefit from global cooperation as the resulting global price of carbon could be higher than the go-it-alone price. That is however not the case for most industrialized countries where the go-it-alone carbon price tends to be high.
[7] The U.S. NDC submission stated its emissions reduction target for 2025 (relative to the 2005 level). We extend this emission reduction target to 2030 following Böhringer et al. (2020).
[8] A $50/tCO2 price of carbon translates roughly into 50 cents per gallon of fuel.
[9] According to the 2019 Consumer Expenditure survey, the lowest decile spends 9.7% of income on food at home (15.2% on all food), while for the highest decile the corresponding share is 5.2% (10.9% on all food).
![]()
![]()
![]()
![]()
![]()
