October 13, 2020
U.S. Farm Sector Financial Performance
by Michael Langemeier
![]()
![]()
![]()
![]()
![]()
Metrics that can be used to measure farm profitability include earnings before interest, taxes, and amortization (EBITA), net farm income, the operating profit margin ratio, return on assets, and return on equity (here). Each of these measures has its advantages and disadvantages. When focusing on operating profit, and not capital gains on assets, the operating profit margin serves as a useful measure for both internal and external benchmarking. However, if we want to include capital gains on assets in our financial performance metrics, return on assets and return on equity are preferable. This article examines trends in return on assets and its components for the U.S. farm sector.
A recent article indicates that real estate comprises 83 percent of total assets on the U.S. farm sector balance sheet (here). There are two sources of income emanating from land ownership: current income and capital gains. Current income is represented by rental payments (e.g., share rent, cash rent) for non-operator landlords and by the net return to land for farm operators. Capital gains (losses) represent annual increases (decreases) in land values.
Data in this article was obtained from information reported by USDA-ERS (here). Return on assets (referred to as total rate of return on farm assets by USDA-ERS) is equal to current income (referred to as the rate of return on farm assets from current income by USDA-ERS) plus capital gains (referred to as the rate of return on farm assets from real capital gains by USDA-ERS). Current income represents the annual returns to farm sector assets from farm operations. Specifically, what we are referring to as current income in this article is computed by adding interest expense and subtracting unpaid labor and management from net farm income and dividing the result by average total assets. Capital gains (losses) measure the returns the assets from an increase (decrease) in the assets’ value, apart from their income generating potential, and is computed on an annual basis.
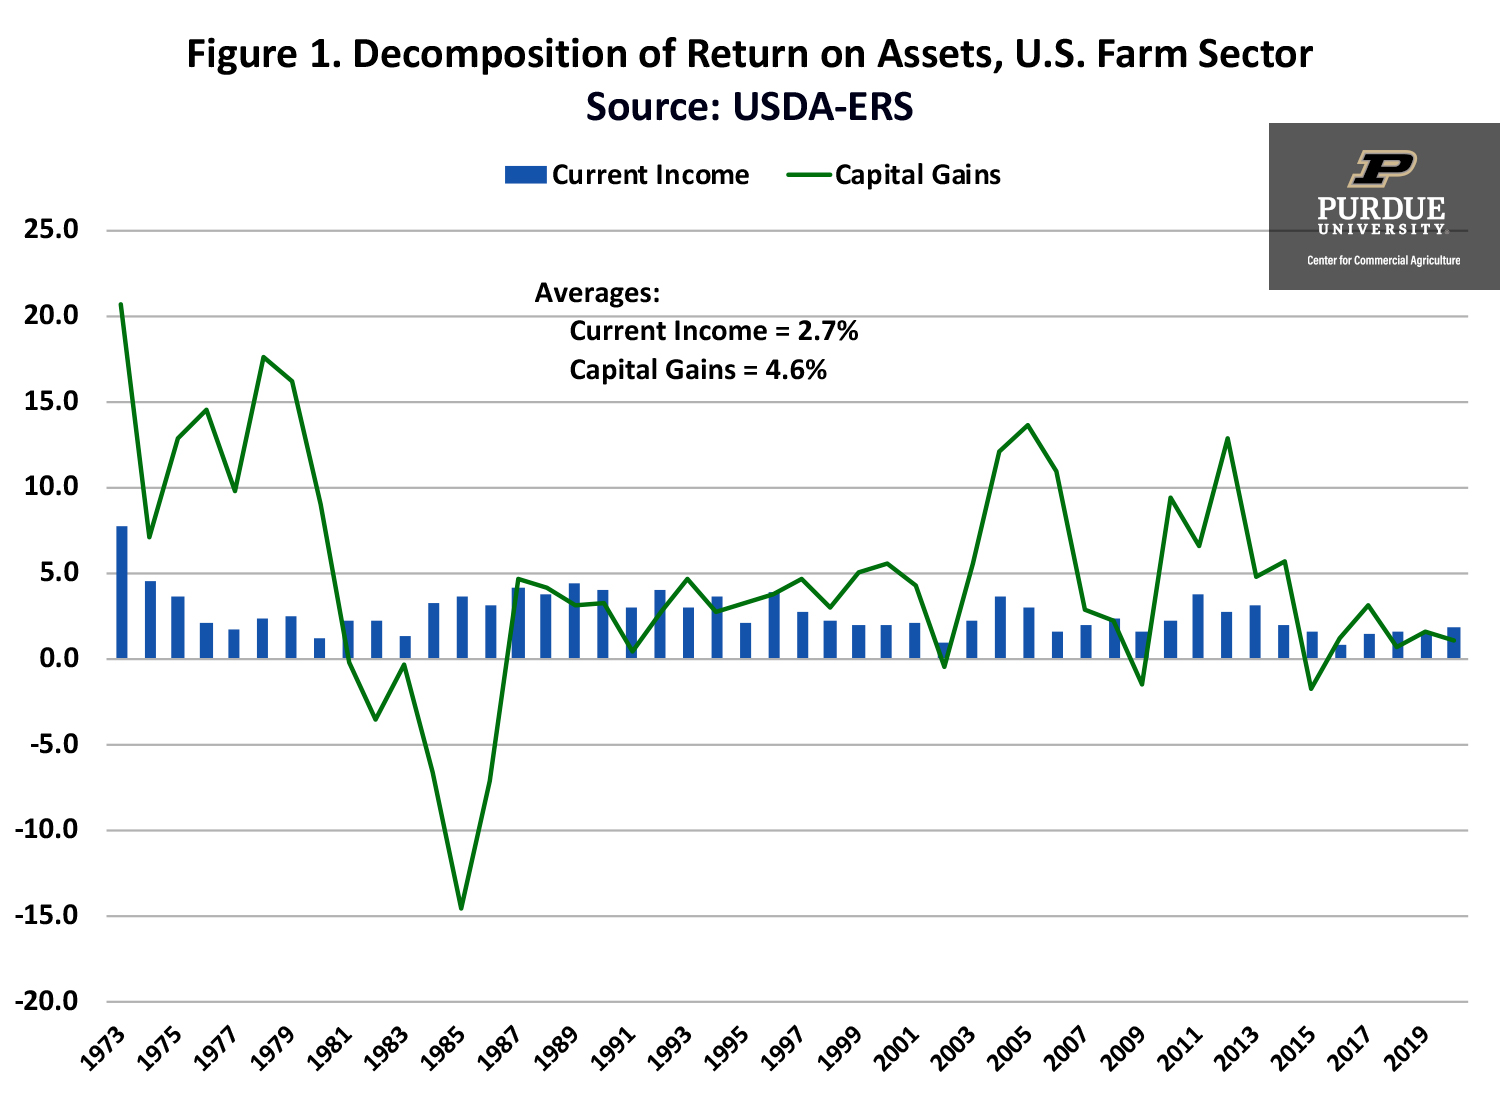
Figure 1. Decomposition of Return on Assets, U.S. Farm Sector
Source: USDA-ERS
Figure 1 illustrates the components of return on assets for the U.S. farm sector from 1973 to 2020. The data for 2020 represents a forecast. The average return on assets during this time period was 7.3 percent. This rate of return can be disaggregated into current income and capital gains. Current income and capital gains averaged 2.7 and 4.6 percent, respectively, over the 1973 to 2019 period, which indicates that approximately 64 percent of the return on assets for the U.S. farm sector was derived from capital gains.
From figure 1, it is evident the annual capital gain was considerably more variable than current income. The standard deviation of current income and capital gains was 1.2 and 6.5 percent, respectively. Relative variability can be computed by dividing the standard deviation by the average for each measure. This computation is referred to as the coefficient of variation. The coefficient of variation for return on assets was 0.95. For current income and capital gains, the coefficient of variation was 0.46 and 1.42. These results suggest that a large proportion of the variability of return on assets is due to capital gains and losses. We can also gauge the relative variability by examining downside risk. Only 5 of 47 years exhibited a negative return on assets during the 1973 to 2019 period. Capital gains were negative for 9 of the 47 years or 19 percent of the years. In contrast, annual current income was positive for each year. Of course, for individual farms, current income would not be positive every year.
In summary, the return on assets for the U.S. farm sector since 1973 has averaged 7.3 percent. Approximately two-thirds of this return is due to capital gains and losses on assets. The other one-third is derived from current income. Though it represents a larger contributor to return on assets than current income, capital gains on assets are considerably more variable than current income. Moreover, capital gains are not readily available to meet financial obligations, purchase assets, or remunerate operators. Thus, the old adage, farms are cash poor and asset rich. A future article will contrast the national financial performance with results for a specific region of the country as well as decompose current income into the operating profit margin ratio and asset turnover ratio.
References
Langemeier, M. “U.S. Farm Sector Balance Sheet.” Center for Commercial Agriculture, Department of Agricultural Economics, Purdue University, September 9, 2020.
Langemeier, M. “Measuring Farm Profitability.” Center for Commercial Agriculture, Department of Agricultural Economics, Purdue University, September 16, 2020.
USDA-ERS. “Farm Income and Wealth Statistics.” www.ers.usda.gov/data-products/farm-income-and-wealth-statistics/, accessed October 8, 2020.
![]()
![]()
![]()
![]()
![]()
TEAM LINKS:

PART OF A SERIES:

RELATED RESOURCES
UPCOMING EVENTS
We are taking a short break, but please plan to join us at one of our future programs that is a little farther in the future.