

New year brought increased consumer interest in food and nutrition resolutions
Food or nutrition-related New Year’s resolutions were more popular among consumers going into 2024 compared to last year, according to the January Consumer Food Insights Report. This year, 25% of consumers responded “yes” when asked if they had any food or nutrition-related New Year’s resolutions, up 6 percentage points from the response to the same question last year.
The survey-based report out of Purdue University’s Center for Food Demand Analysis and Sustainability assesses food spending, consumer satisfaction and values, support of agricultural and food policies and trust in information sources. Purdue experts conducted and evaluated the survey, which included 1,200 consumers across the U.S.
“The top words that popped up in peoples’ resolutions showed most consumers were focused on eating healthier by either limiting the intake of foods like sugar or increasing the intake of foods like fruits and vegetables,” said the report’s lead author, Joseph Balagtas, professor of agricultural economics at Purdue and director of CFDAS.
Some of the January survey results were categorized by body mass index (BMI), using the Centers for Disease Control and Prevention’s adult BMI calculator.
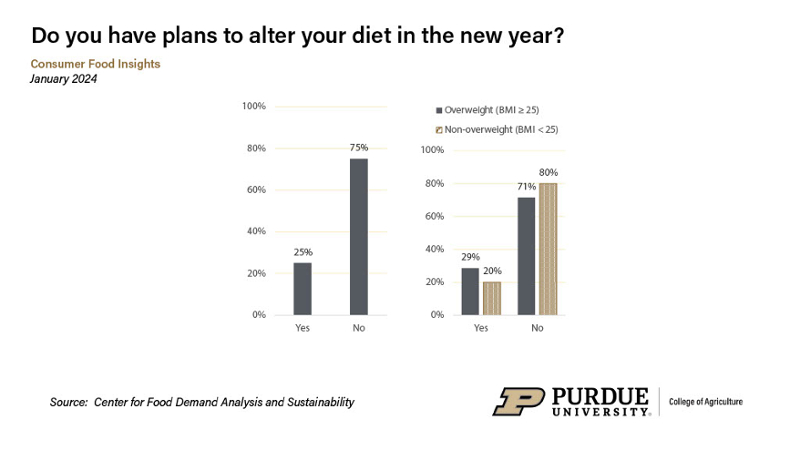 Share of Consumers Who Have Food or Nutrition-related New Year's Resolutions: Aggregated and by BMI Group, Jan. 2024
 “We see a slightly larger proportion of overweight consumers with resolutions, 29%, compared to non-overweight consumers with resolutions, 20%,” Balagtas said. Consumers cited improving health and weight loss as the top motivations behind their resolutions. Weight loss, however, was a primary motivator for 60% of consumers classified as overweight compared to 26% of non-overweight consumers.
To create this month’s diet and nutrition survey questions, the research team consulted Purdue’s Heather Eicher-Miller, professor of nutrition science in the College of Health and Human Sciences.
“As one might expect, the majority of consumers plan to increase their consumption of fruits, vegetables and water while limiting the intake of salty snacks, sugary foods, regular soft drinks and alcohol,” Balagtas said.
Among consumers who planned to decrease their consumption of a certain food, 46% anticipated cravings as an obstacle. For those trying to eat more of a certain food, a majority anticipated cost as a barrier.
“We pick up in the survey a strong perception that healthy diets are more expensive than less healthy diets,” Balagtas noted. “And while this perception is true for many of the poorest people around the world, it’s not necessarily the case here in the U.S. Measuring the cost of a diet actually turns out to be a little complex, and it’s something we’re working on at the center. But I think it is possible for most of us in the U.S. to improve our diets in a cost-effective way.”
Using the U.S. Department of Agriculture’s five-point scale from “poor” to “excellent,” the Purdue researchers found that 84% of consumers rate their diet as “good,” “very good,” or “excellent.”
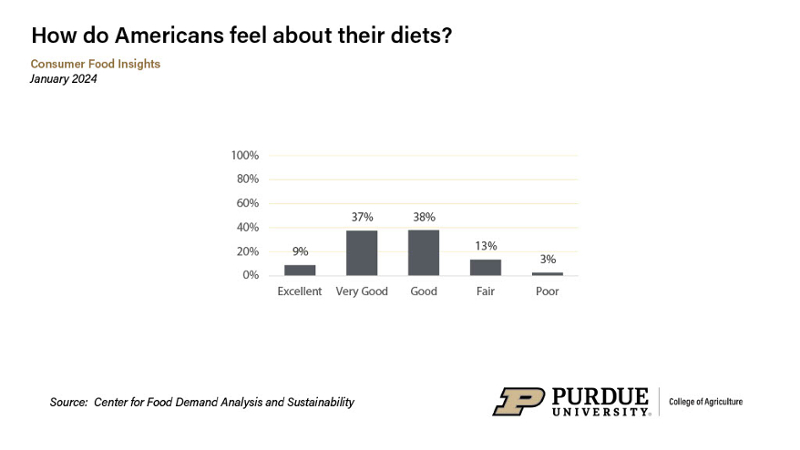 'In general, how healthy is your overall diet? Would you say it is...' , Jan. 2024
 Consumers who knew of USDA’s and U.S. Department of Health and Human Services’ Guidelines for Americans were more likely to report that their diet is healthy. The guidelines provide advice on what to drink and eat to ensure that nutrient needs are met.
“Awareness of the guidelines is a good sign but when we look at what Americans actually eat compared to the recommendations in the guidelines, the grade on a scale to 100 would be a 58, or F+,” Eicher-Miller said. “So, it looks like people might have an optimistic view of their diets.”
In the “Food Expenditures” category, average weekly food spending was $124 in January, up 20% from January 2022. “It is no surprise to see food spending increase given the high food inflation we experienced during the same period,” noted Elijah Bryant, a survey research analyst at CFDAS and co-author of the report.
Consumer inflation expectations and estimates remained unchanged from last month, and down slightly from last summer. However, the Consumer Price Index measure of food inflation in January was 2.7%, down significantly from last year.
And while the food insecurity rate has hovered around 13% since September 2023, the rate of households receiving free food declined to 12% in January from 15% in December.
“With food inflation on the decline, consumers may be seeing some relief on their wallets, reducing the reliance on free food to supplement their food purchases,” Bryant observed.
The incidence of overweight is higher among consumers who are food insecure or participate in SNAP. “The income effect may explain this pattern as the incidence of overweight is higher and diet quality lower among low-income consumers,” Bryant said. “Our survey highlights the intertwined problems of food insecurity and nutrition, and the importance of research for identifying solutions to both.”
Most Americans continue to be considered “thriving” on the diet well-being index (63%). However, this is lower than the 2022 (70%) and 2023 (69%) averages.
Overweight consumers report a slightly lower score on the diet well-being index compared to non-overweight consumers over the last 25 months, with 66% versus 73% considered “thriving,” respectively. “However, it should be noted that the majority of all consumers remain happy with their diets and lives,” Bryant said.
The January survey also asked consumers about their trust in food and nutrition-related information from organizations and professionals tasked with protecting public health and the U.S. food system. These include primary care professionals, the Food and Drug Administration, the USDA and the Dietary Guidelines for Americans. Consumers rated their trust higher in January compared to the 2022 and 2023 averages on the CFDAS trust index.
The Center for Food Demand Analysis and Sustainability is part of Purdue’s Next Moves in agriculture and food systems and uses innovative data analysis shared through user-friendly platforms to improve the food system. In addition to the Consumer Food Insights Report, the center offers a portfolio of online dashboards.Featured Stories

Channing Arndt, research professor in agricultural economics and director of the Global Trade...

Daniel Szymanski and his former postdoctoral scholar Youngwoo Lee, lead author on their paper...

The Costa Rica Rainforest Experience study abroad trip allowed students to experience the wonders...

Trask is writing a new narrative about rats, birds and people as he pursues his doctorate in...

Several Forestry and Natural Resources students, staff and recent alumni have been recognized for...

A plume of contamination spreads underground. A building's foundation weakens. A wetland...