

Consumers report significant rise in diet satisfaction since January
The share of consumers who indicated they are either “rather happy” or “very happy” with their diets rose from 81% in January 2024 to 87% last month, according to the April 2024 Consumer Food Insights Report. This surprising finding follows extensive media attention devoted to issues like food inflation in recent months, the report’s authors noted.
However, the CFI Report also found that urban consumers are more likely than rural consumers to be happy with their diets, which is supported by the authors’ findings on diverging food insecurity rates. The survey-based report out of Purdue University’s Center for Food Demand Analysis and Sustainability assesses food spending, consumer satisfaction and values, support of agricultural and food policies, and trust in information sources. Purdue experts conducted and evaluated the survey, which included 1,200 consumers across the U.S.
“Over the past 28 months, we’ve measured food insecurity among rural households that is nearly twice the rate of urban households, 22% vs. 14%, respectively,” said the report’s lead author, Joseph Balagtas, professor of agricultural economics at Purdue and CFDAS director. “Poverty rates are higher in rural areas, and one consequence of poverty is that it is harder to afford to put food on the table.”
The April survey included questions related to consumers’ store choices. Specifically, it gauged what types of food stores consumers have available to them and which of these available stores they shopped at in the last month.
The survey covered what a typical shopping trip is like for consumers and which store attributes are important to them when deciding where to shop. Also included was how responses differ between rural and urban consumers. The report classified households as rural or urban using the USDA Economic Research Service’s rural-urban commuting area codes. All 28 months of CFI data are summarized in the new report.
The most commonly accessible store formats are traditional grocery stores (accessible to 82% of the sample) and superstores (82%), followed by dollar stores (66%), club stores (57%) and convenience stores (51%). Accessibility differs along the rural-urban divide. Grocery stores are slightly less accessible for the rural population than the urban population (76% vs. 83%), while superstores (89% vs. 82%) and dollar stores (78% vs. 64%) are more accessible for the rural population. The store format with the biggest difference in accessibility is club stores. “Only 30% of the rural population compared to 60% of the urban population tell us they have access to club stores,” Balagtas said.
The researchers also find some rural-urban differences in store choice. “Among people with access to grocery stores, rural people are slightly less likely to shop at grocery stores and slightly more likely to shop at superstores,” Balagtas said.
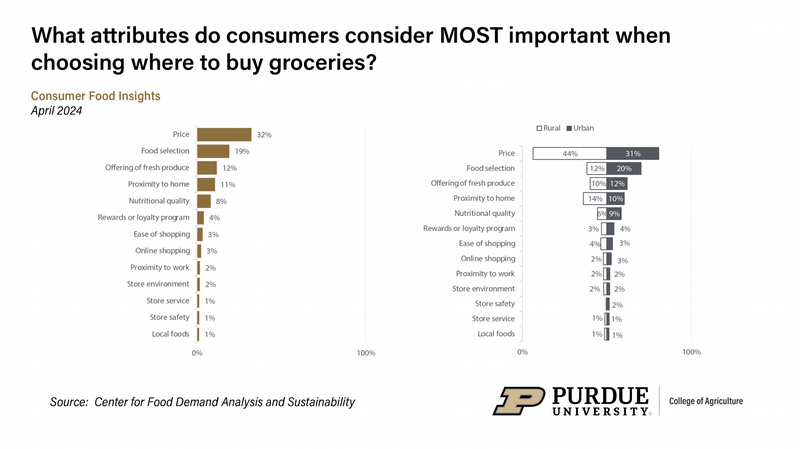 Share of Consumers: Most Important Store Attribute Selection, Apr. 2024/Share of Consumers: Most Important Store Attribute Selection by Rural-Urban, Apr. 2024
 Further, about 60% of rural households with access to a dollar or discount store shopped at one in the last 30 days. This finding aligns with 2021 market research of the USDA Economic Research Service that highlights dollar-store market growth in rural U.S. nonmetro areas.
The CFDAS researchers also attempted to gauge the importance of different store attributes in respondents’ decision-making process. Following previous literature regarding store choice, they asked consumers to rate the importance of key items on a scale from 1, or not at all important, to 5, or very important.
“The top-rated attributes were ‘food selection,’ ‘offering of fresh produce’ and ‘price,’ which received average ratings of 4.6, 4.6 and 4.5 out of 5, respectively,” said Elijah Bryant, a survey research analyst at CFDAS and co-author of the report.
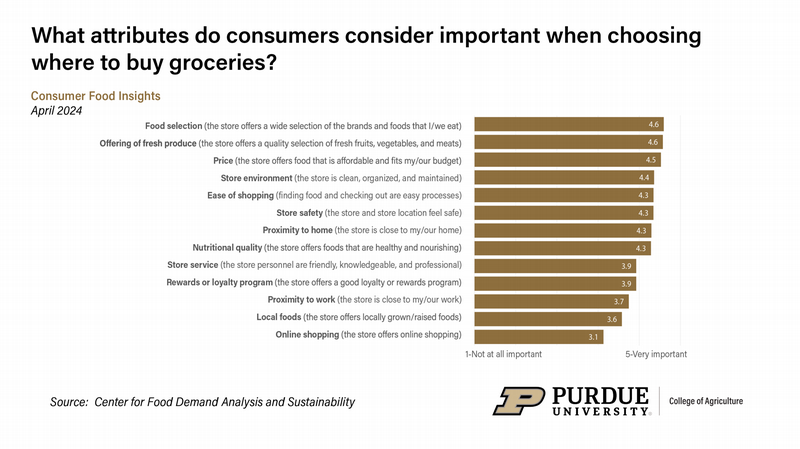 Weighted Average Rating: Store Attribute Importance, Apr. 2024
 “Out of the listed attributes, ‘online shopping’ received the lowest average rating at 3.1. However, it should be noted that this does not imply that online shipping is not important to consumers. It just did not score as high on the scale,” Bryant said.
The CFDAS researchers further asked consumers to pick the attribute they consider most important when choosing where to buy groceries. One-third of consumers selected “price” as the most important attribute, followed by “food selection” (19%) and “offering of fresh produce” (12%).
“Many consumers appear to be cost-focused when choosing where to shop, especially rural consumers, about half of whom picked ‘price’ as the most important attribute when picking where to shop,” Bryant said. “Inflation over the past few years may have more consumers conscious of the cost of their groceries.”
Average weekly food spending rose to $202 last month, up 10% from April 2023 and 17% from April 2022. Rural households spend less each week on food away from home than urban households. This likely resulted from rural residents eating fewer meals at restaurants, Bryant noted.
The consumer price index measure of food inflation remained unchanged from last month at 2.2%. This is the first time the index has not decreased since it peaked at 11.3% in August 2022.
As for consumer beliefs and trust, the survey showed that urban consumers are more likely to view agriculture as a significant contributor to climate change than are rural Americans. Many of the latter rely on agriculture as an economic driver.
“Similarly, more urban consumers, 50%, believe that eating less meat is better for the environment than rural consumers, 38%,” Bryant said. Even so, the researchers see few differences in the level of trust in different sources of food-related information.
“However, the USDA, which works closely with the agriculture industry and rural economies, scores higher on the trust index among rural consumers compared to urban consumers,” Bryant added.
The Center for Food Demand Analysis and Sustainability is part of Purdue’s Next Moves in agriculture and food systems and uses innovative data analysis shared through user-friendly platforms to improve the food system. In addition to the Consumer Food Insights Report, the center offers a portfolio of online dashboards.
Featured Stories

Channing Arndt, research professor in agricultural economics and director of the Global Trade...

Daniel Szymanski and his former postdoctoral scholar Youngwoo Lee, lead author on their paper...

The Costa Rica Rainforest Experience study abroad trip allowed students to experience the wonders...

Trask is writing a new narrative about rats, birds and people as he pursues his doctorate in...

Several Forestry and Natural Resources students, staff and recent alumni have been recognized for...

A plume of contamination spreads underground. A building's foundation weakens. A wetland...