Agricultural Economics
Consumers continue to lower food inflation expectations and estimates
Food inflation rate remains steady at 2.2%
Food inflation expectations and estimates both dropped last month to their lowest levels since January 2022, according to the July 2024 issue of the Consumer Food Insights Report (CFI).
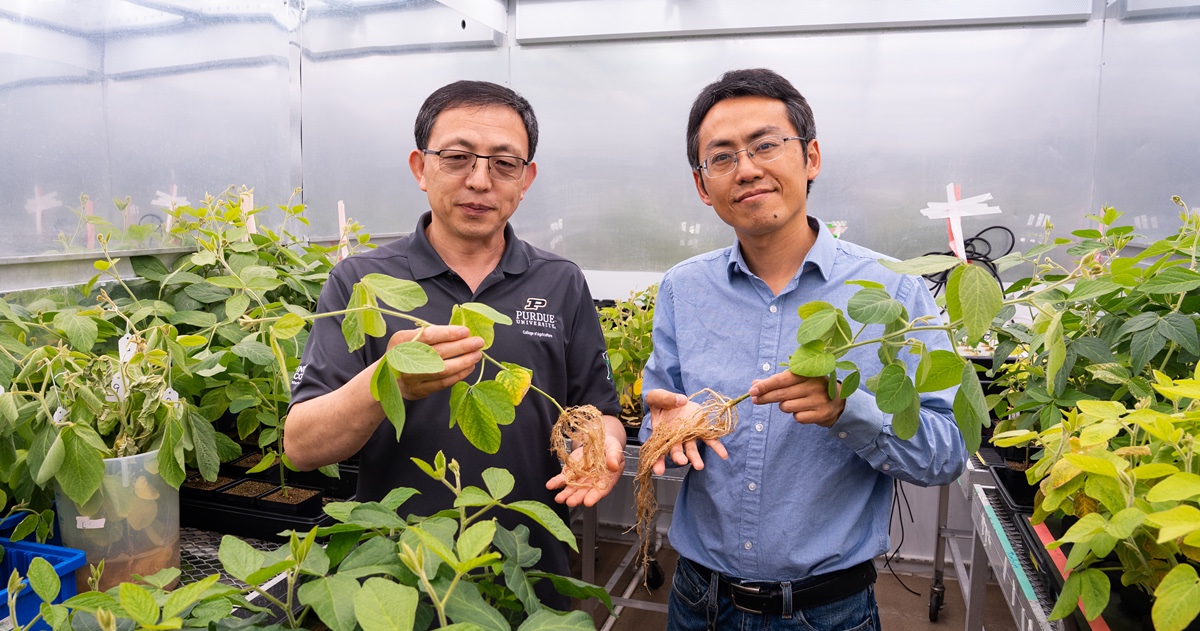
The survey-based report out of Purdue University’s Center for Food Demand Analysis and Sustainability (CFDAS) assesses food spending, consumer satisfaction and values, support of agricultural and food policies, and trust in information sources. Purdue experts conducted and evaluated the survey, which included 1,200 consumers across the U.S.
The consumer price index (CPI) measure of annual food inflation remained unchanged at 2.2% for the fifth month in a row. The CFDAS survey asked consumers to estimate how much food prices have increased over the last year and their expectations for the coming year.
“Consumers estimate food inflation at 5.4%, higher than the CPI estimate but a decrease from last month,” said the report’s lead author, Joseph Balagtas, professor of agricultural economics at Purdue and CFDAS director. “Consumers also expect food prices to be 3.2% higher 12 months from now. This also decreased from last month. Both the inflation estimate and expectation are the lowest they have been since the inception of the CFI survey in January 2022.”
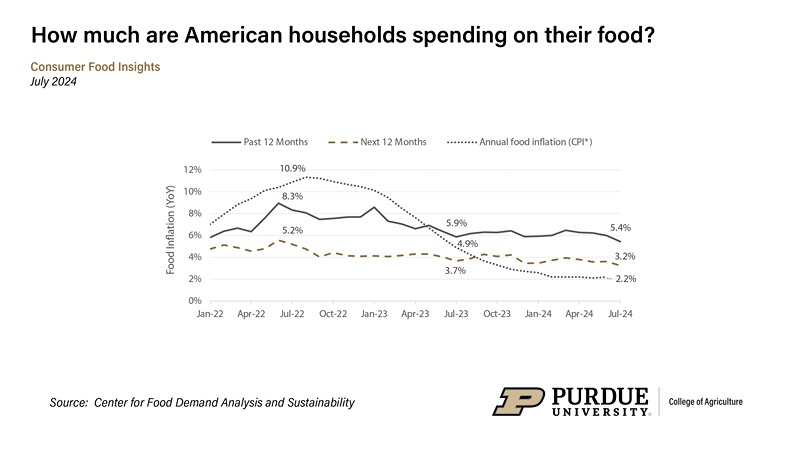 Consumer estimates of food inflation compared to gov. estimate, Jan. 2022 - Jul. 2024
 “There are a couple of perspectives to consider when looking at the evolution of food inflation and inflation perceptions,” Balagtas said. “On the one hand, cumulative inflation over the past several years has left prices much higher than they were.
However, inflation has cooled substantially from its peak at 11.3% two years ago, which, together with wage growth, will increase consumer purchasing power.
Additional key results include:
- The food insecurity rate dropped slightly to 11%; around one-third of low-income households (those earning less than $50,000) are food-insecure.
- Food gardening correlates with household income, with more high-income households growing their own food.
- Both consumer food inflation estimates and expectations dropped from last month by 0.6 and 0.4 percentage points, respectively.
The new report revisits income differences by splitting respondents into three annual household income groups: less than $50,000, $50,000 to $100,000, and more than $100,000.
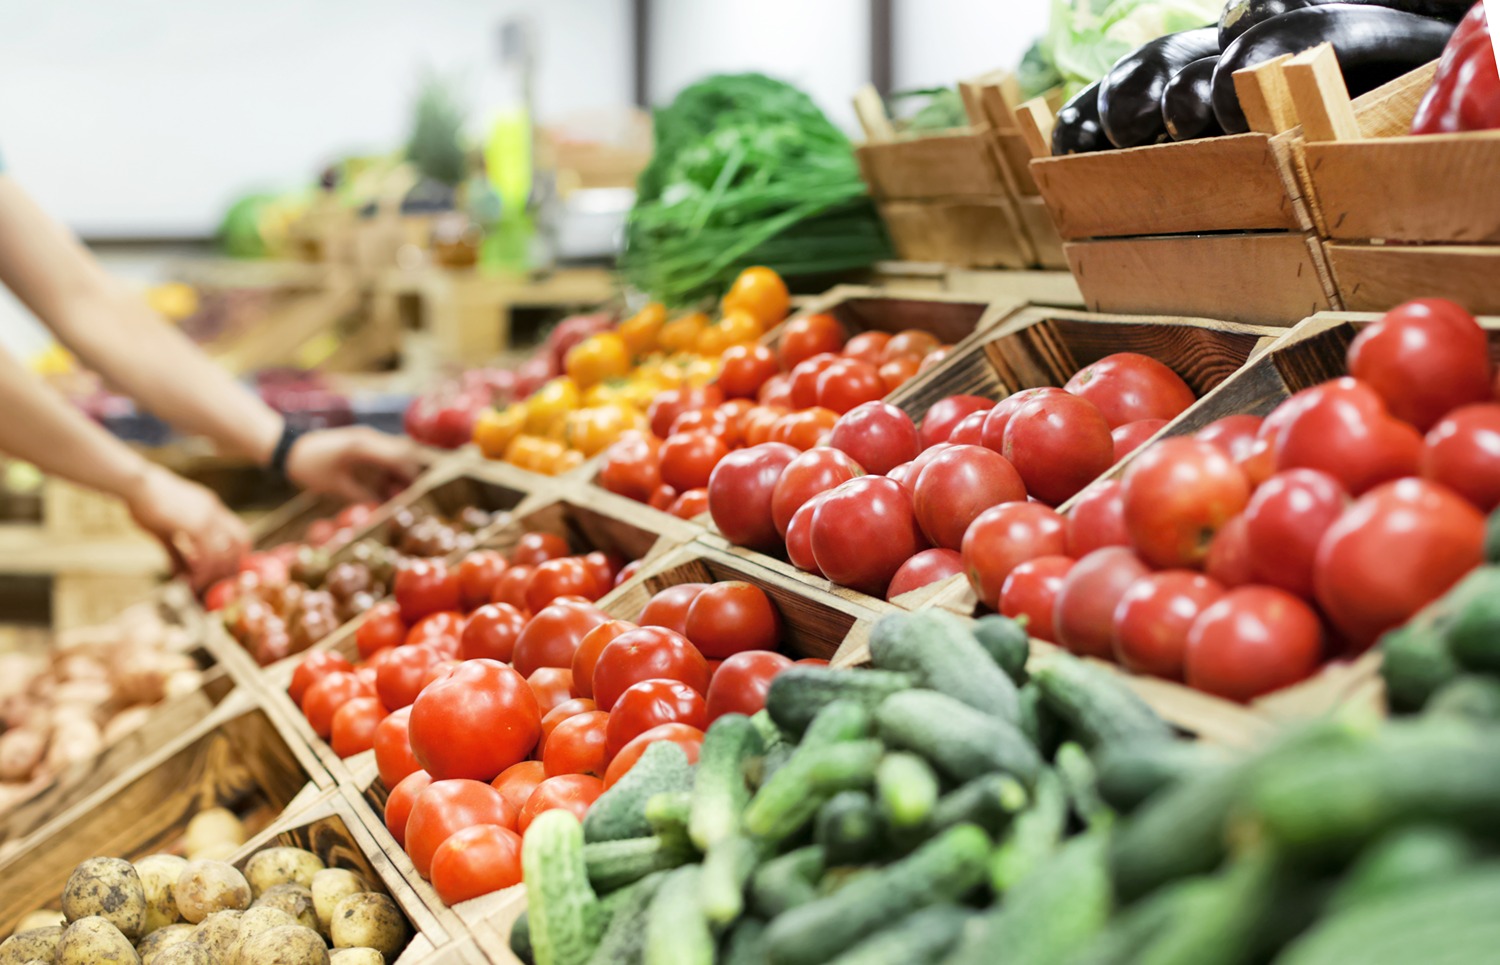
Respondents were also asked about their farmers market plans for this summer. Around 82% of consumers reported having access to a farmers market, while access among households making less than $50,000 a year is slightly lower (74%). Of consumers who do have access, 81% say they plan on shopping at a farmers market this summer.
“While we don’t see substantial differences in how frequently consumers plan to purchase food at farmers markets, a larger share of those making over $100,000 a year, around 15%, plan on frequenting a farmers market more than once a week,” Bryant said. By comparison, 6% of those making $50,000 to $100,000 and 2% of those making less than $50,000 plan to do so.
The July survey also measured food satisfaction. Consumers scored their own diets on a scale from 0 to 10, with 10, the top of the scale, representing their ideal diet. Most Americans (67%) gave themselves a score of 7 to 10, which corresponds to the conceptual label of “thriving” on the diet well-being index. This scale employs the same methodology of the Cantril Scale to assess well-being.
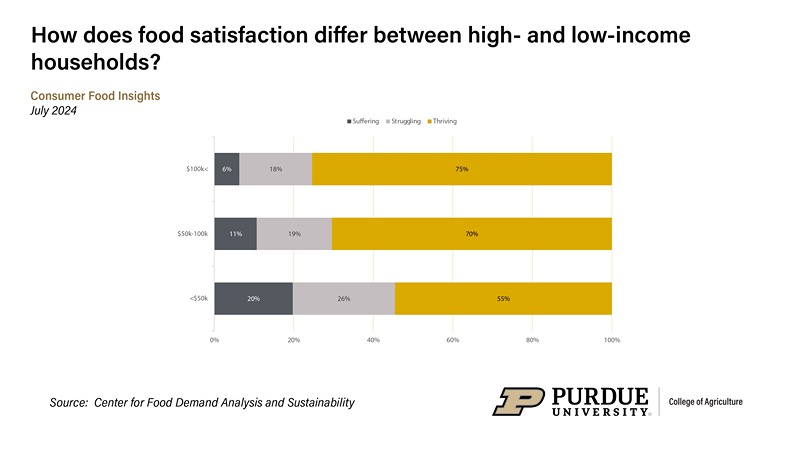 Diet well-being index (0-10 Scale) by annual household income, Jul. 2024
 “However, we see that proportion change when disaggregating by income,” said Elijah Bryant, a survey research analyst at CFDAS and a co-author of the report. Low-income consumers are more likely to be considered “suffering” (20%) or “struggling” (26%) on this diet well-being index relative to high-income consumers (6% and 18%, respectively).
The survey’s measure of food insecurity decreased to 11%, which marks the seventh straight month it has remained below the 2023 average of 14%. Food insecurity is substantially higher among those who earn less than $50,000 a year, with around one-third of low-income households struggling to get enough quality food.
“This is not entirely surprising since affordability plays a key role in households’ ability to access adequate amounts of nutritionally sufficient foods,” Bryant said.
The Center for Food Demand Analysis and Sustainability is part of Purdue’s Next Moves in agriculture and food systems and uses innovative data analysis shared through user-friendly platforms to improve the food system. In addition to the Consumer Food Insights Report, the center offers a portfolio of online dashboards.
About Purdue Agriculture
Purdue University’s College of Agriculture is one of the world’s leading colleges of agricultural, food, life and natural resource sciences. The college is committed to preparing students to make a difference in whatever careers they pursue; stretching the frontiers of science to discover solutions to some of our most pressing global, regional and local challenges; and, through Purdue Extension and other engagement programs, educating the people of Indiana, the nation and the world to improve their lives and livelihoods. To learn more about Purdue Agriculture, visit this site.
About Purdue University
Purdue University is a research institution ranked among the top 10 public universities in the United States. More than 106,000 students study at Purdue across multiple campuses, including more than 57,000 at our main campus locations in West Lafayette and Indianapolis. As a land-grant university committed to affordability and accessibility, Purdue’s main campus has frozen tuition 14 years in a row, enabling more students than ever to graduate debt-free.
Writer: Steve Koppes
Media contact: Devyn Ashlea Raver, draver@purdue.edu
Sources: Joseph Balagtas, balagtas@purdue.edu; Elijah Bryant, ehbryant@purdue.edu
Agricultural Communications: Maureen Manier, mmanier@purdue.edu, 765-494-8415
Journalist Assets: A video link is available to media who have an Associated Press subscription.