April 28, 2022
Impact of Higher Corn Prices on Feeding Cost of Gain and Net Returns for Cattle Finishing
by Michael Langemeier


Corn price futures for the July 2022 contract (December 2022 contract) increased from $6.00 per bushel ($5.55 per bushel) in early January to $7.75 ($7.30) in mid-April. Moreover, using the iFarm price distribution tool there was a 25 percent chance on April 26 that the expiration price for the December corn futures contract will be below $6.05 per bushel and a 25 percent chance that price will be above $8.55. Given that the U.S. stocks to use ratio is currently only 9.6 percent and continued questions related to U.S. corn acreage in 2022, there is tremendous uncertainty regarding corn prices for the rest of this year. To address this uncertainty, this article examines the impact of relatively high corn prices on feeding cost of gain and net returns for cattle finishing.
Feeding Cost of Gain
Feeding cost of gain is sensitive to changes in feed conversions, corn prices, and alfalfa prices. Information on these items are available from monthly issues of the Focus on Feedlots newsletter. Figure 1 illustrates feeding cost of gain from January 2012 to February 2022. In February 2022, corn and alfalfa inventory prices were $6.58 per bushel and $207 per ton, respectively. After averaging $80.50 per cwt. in 2020 and $100.40 in 2021, feeding cost of gain for January and February was $113.10 and $113.75, respectively. The estimated feeding cost of gain in the February issue of Focus on Feedlots for placements in February was $125 per cwt. It is important to note that since this estimate was made corn prices have continued to increase.
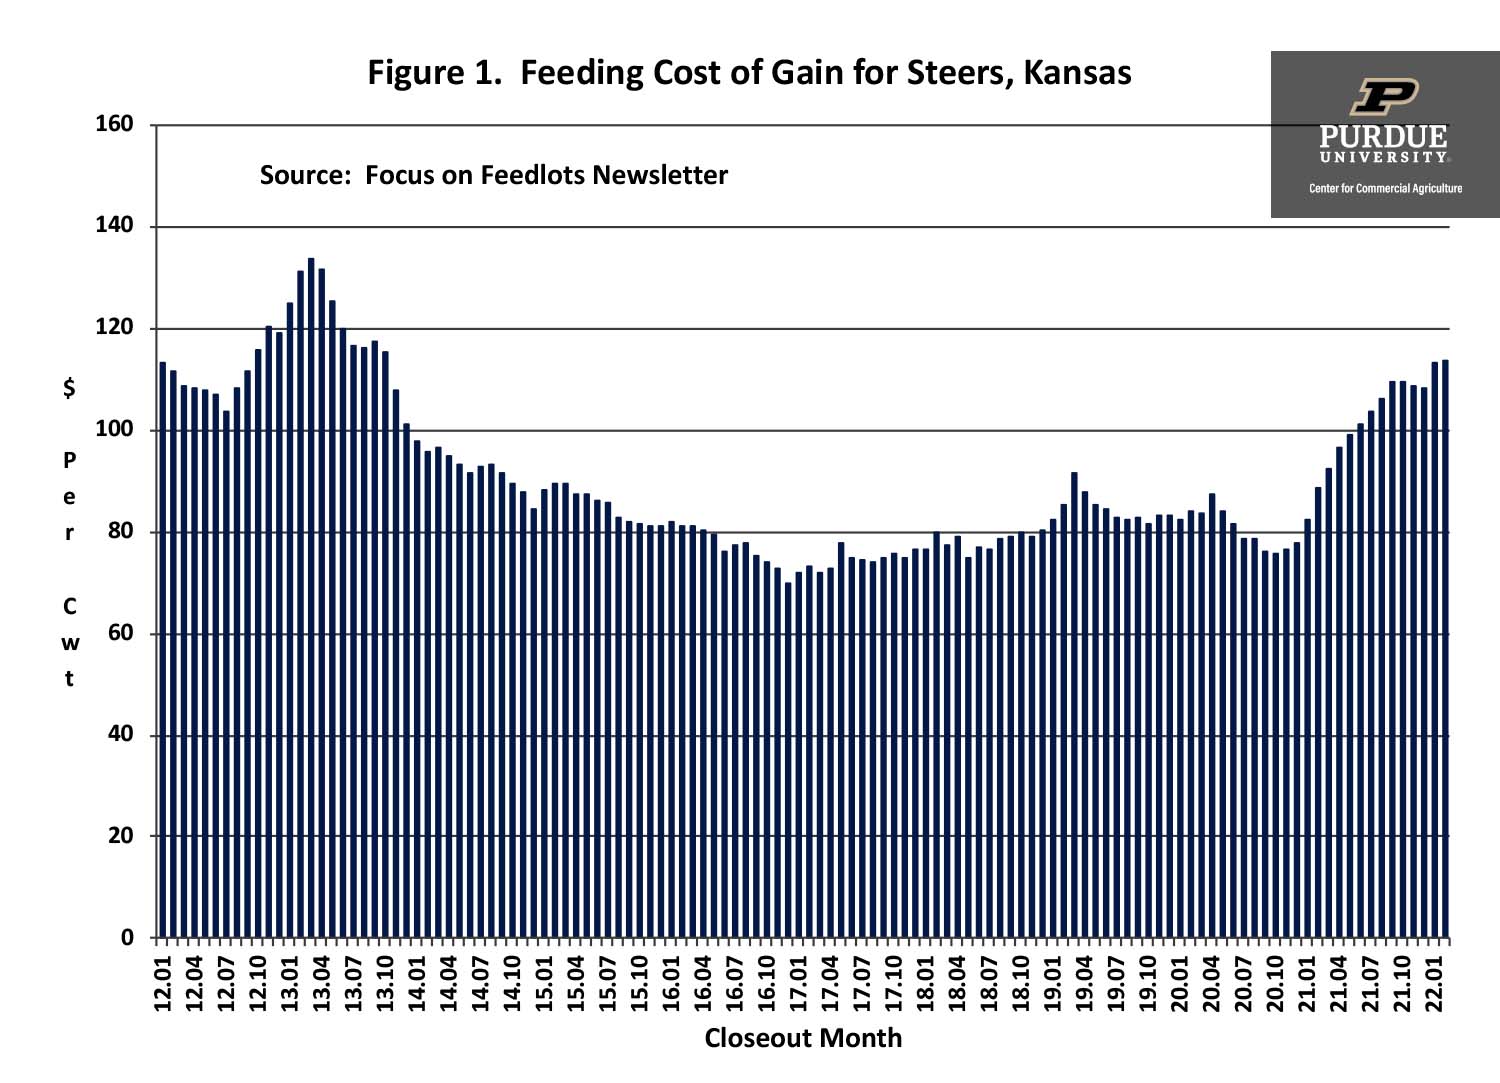
Figure 1. Feeding Cost of Gain for Steers, Kansas
Feeding of gain for the rest of 2022 was estimated using mid-April projections of corn and alfalfa prices, and seasonal average feed conversions. Because feeding cost of gain is computed using corn prices from the time cattle are placed to the time they are sold, the relatively high corn prices we are currently experiencing will impact feeding cost of gain for the rest of 2022. With this in mind, feeding cost of gain for the second quarter of 2021 is expected to range from $112 to $115 per cwt., with the higher cost occurring in June. For the third quarter, feeding cost of gain is expected to range from $118 to $121 per cwt. Feeding cost of gain for the fourth quarter is expected to range from $120 to $123 per cwt., with the highest cost occurring in October. If these feeding costs are realized, they will represent the highest feeding cost of gain since the first quarter of 2013.
Cattle Finishing Net Returns
Monthly cattle finishing net returns from January 2012 to February 2022 are illustrated in figure 2. It is important to note that net returns were computed using closeout months rather than placement months. Several data sources were used to compute net returns. Average daily gain, feed conversion, days on feed, in weight, out weight, and feeding cost of gain were obtained from the Focus on Feedlots newsletter, feeder cattle and fed cattle prices from the Livestock Marketing Information Center, and interest rates from the Federal Reserve Bank of Kansas City.
After a profitable run in the fourth quarter of 2021 and the first quarter of 2022, net returns have headed southward. Average losses for the second quarter of 2022 are expected to range from $10 to $50. If feeding cost of gain remains at levels noted above, losses are expected to continue for the rest of 2022.

Figure 2. Historical Net Returns for Finishing Steers, Kansas
Sensitivity of Feeding Cost of Gain and Net Returns to Changes in Corn Prices
To determine the sensitivity of feeding cost of gain to changes in corn prices, alfalfa prices, and feed conversion, a regression using data for the last ten years was estimated. Results are as follows: each 0.10 increase in feed conversion increases feeding cost of gain by $1.10 per cwt., each $0.10 per bushel increase in corn prices increases feeding cost of gain by $0.86 per cwt., and each $5 per ton increase in alfalfa prices increases feeding cost of gain by $0.59 per cwt. To more fully understand the impact of feed conversion, corn price, and alfalfa price on feeding cost of gain, we computed coefficients of separate determination (Langemeier et al., 1992). These coefficients can be used to measure the influence of each independent variable upon the dependent variable. The sum of the coefficients of separate determination for each variable equals the R-square goodness of fit measure, which was 0.956 for the feeding cost of gain regression. This goodness of fit statistic indicates that 95.6 percent of the variation in feeding cost of gain was explained by fluctuations in feed conversions, corn prices, and alfalfa prices. Computed coefficients of separate determination indicated that corn price explained approximately 71 percent of the variation in feeding cost of gain.
As noted above, there is currently more than a $2 per bushel difference between the December corn futures price at expiration at the lower and upper 25 percentiles. The projections above used the middle range of corn prices. For example, the average corn price for July closeouts was projected to be $7.25. If corn price was $1 lower ($1 higher), feeding cost of gain would be $109.55 ($126.75) rather than $118.15.
In addition to feeding cost of gain, net returns are sensitive to changes in the feeder to fed price ratio. Regression analysis was used to examine the relationship between these variables. Results are as follows: each $1 increase in feeding cost of gain results in a decrease in cattle finishing net returns of $3.12 per head, and each 1 percent increase in the feeder to fed cattle price ratio results in a decrease of $8.24 per head in cattle finishing net returns. Using the sensitivity results above, a $1 movement in corn prices, results in an $8.60 movement in feeding cost of gain. This translates into a $27 per head change in cattle finishing net returns.
Summary and Conclusions
Corn prices have increased steadily so far this year and are expected to be quite volatile for the rest of the year. This article examined the impact of higher corn prices on feeding cost of gain and net returns for cattle finishing. Each $0.10 increase in corn prices results in an increase in feeding cost of gain of $0.86 per cwt. and a reduction in cattle finishing net returns of $2.70 per head.
References
Focus on Feedlots, Animal Sciences and Industry, Kansas State University, www.asi.k-state.edu/about/newsletters/focus-on-feedlots , accessed April 19, 2022.
Langemeier, M. “Cattle Finishing Net Return Prospects for 2022.” Center for Commercial Agriculture, Purdue University, January 7, 2022.
Langemeier, M., T. Schroeder, and J. Mintert. “Determinants of Cattle Finishing Profitability.” Southern Journal of Agricultural Economics. 24(December 1993):41-47.
TAGS:
TEAM LINKS:

RELATED RESOURCES
Fed cattle prices are near record highs, but cattle finishing margins could remain under pressure through the rest of 2026 and into 2027. Michael Langemeier explains what’s driving the squeeze, from feeder cattle prices and feeding costs to historically high breakeven prices.
UPCOMING EVENTS
Join educators from across the Midwest to build skills for communicating soil health concepts on Nov. 4-5, 2026. In the field, we’ll evaluate the relationship between soil health and water management focusing on irrigation and edge of field practices. The in-service will have both classroom and on farm demonstrations.
The Land of Opportunity: A Conference for Farmland Owners will be held at two locations on October 5 and October 6, providing farmland owners with valuable information and resources to help them make informed decisions about their land. The conference will feature keynote presentations, educational breakout sessions, and networking opportunities designed specifically for those who own, manage, or have an interest in farmland.