September 8, 2023
Déjà vu: Low Mississippi River Levels and Rising Barge Rates May Affect Grain Markets Again this Fall
by Nathan Thompson
![]()
![]()
![]()
![]()
![]()
Historically low Mississippi River levels last fall impacted the ability of barges to navigate the river resulting in an estimated $20 billion economic impact. I wrote about the impact of river levels on corn and soybean basis last fall here. Dry and hot conditions this year are again contributing to lower than normal river levels and, as a result, increasing barge rates. This is certainly something producers will want to pay attention to this fall. Below I give a quick update on where river levels, barge rates, and corn and soybean basis are currently.
Mississippi River Level at St. Louis, MO
Figure 1 shows the current gage height of the Mississippi River at St. Louis, MO. As you can see, current river levels are well below the 5-year average from 2017-2021 and below river levels from this time last year. Given the continued hot and dry forecast, the National Weather Service is not predicting for river levels to improve through the end of the month (see Figure 2).
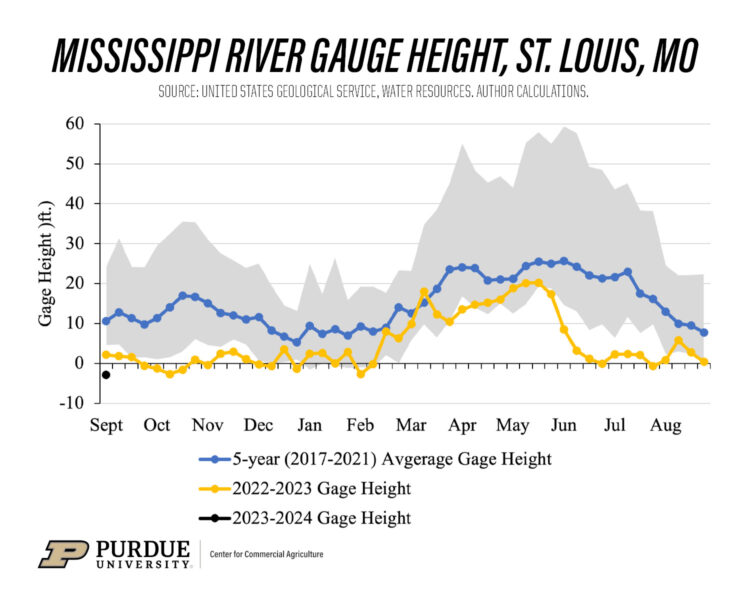
Figure 1. Mississippi River Gauge Height, St. Louis, MO
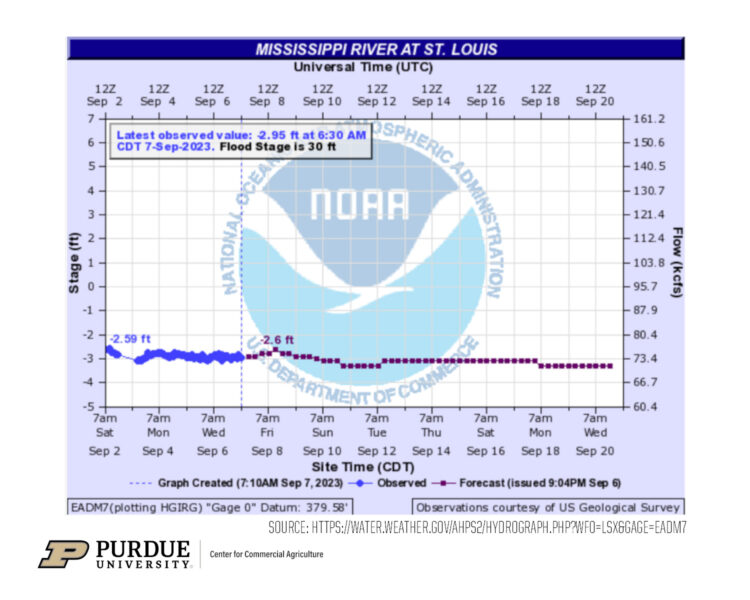
Figure 2. National Weather Service Forecast of Mississippi River Gage Height at St. Louis, MO Through September 20, 2023; Source: https://water.weather.gov/ahps2/hydrograph.php?wfo=lsx&gage=eadm7
Barge Rates
When river levels drop, barge navigation is impacted. As a result, barges are loaded at below normal levels to improve draft and navigability. In turn, this means that the cost of transporting grain increases because it takes more barges to transport the same amount of grain. According to the UDSA AMS Grain Transportation Report, barge freight rates on the Illinois River have increased 62% in just the last two weeks (Figure 3). While these are still just a fraction of barge rates last fall, they are the highest levels since January 2023 and will likely continue to increase if river levels remain low.
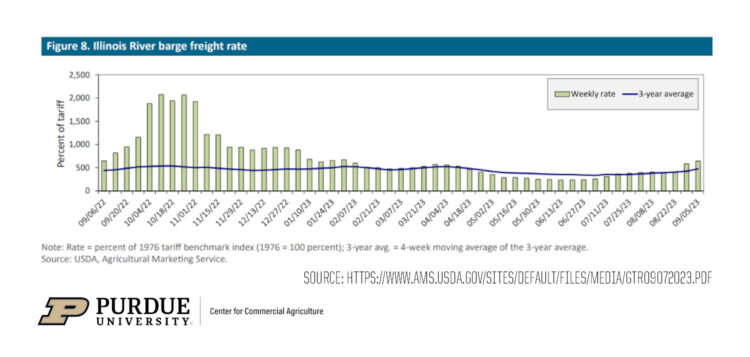
Figure 3. Illinois River Barge Freight Rates; Source: https://www.ams.usda.gov/sites/default/files/media/GTR09072023.pdf
Corn and Soybean Basis
So, what are the implications of this for crop basis levels? Basis illustrates local supply and demand. Therefore, if river terminals cannot move grain, or can only move grain at substantially higher transportation costs, it will impact demand for corn and soybeans at these locations which will be reflected in weaker basis bids.
Figure 4 shows current corn basis at terminals along the Ohio River relative to basis levels last year (2022-2023) and the historical three-year (2019-2020, 2020-2021, 2021-2022) average. As you can see, current corn basis levels at these locations are pretty much in line with historical levels for the first week of September. However, you can see the downside risk associated with continued restricted river navigation reflected in what happened to corn basis last year—corn basis dropped by more than $1/bu. in September 2022.
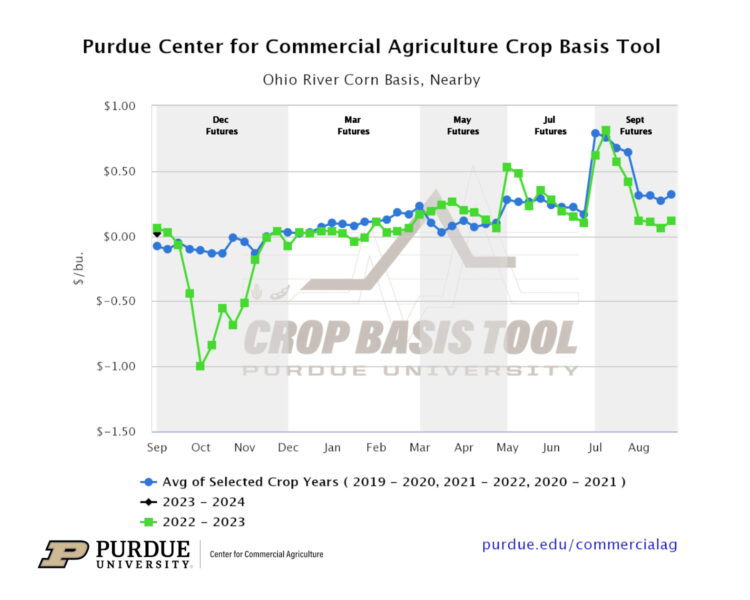
Figure 4. Ohio River Nearby Corn Basis; Source: Purdue Purdue Center for Commercial Agriculture Crop Basis Tool
Figure 5 shows the same information for soybeans. Current soybean basis levels at terminals along the Ohio River are similar to the two-year (2020-2021, 2021-2022) average basis levels, although weaker than soybean basis levels at the beginning of September last year. However, again you can see downside risk associated with continued restricted river navigation—soybean basis dropped by nearly $2/bu. last September.
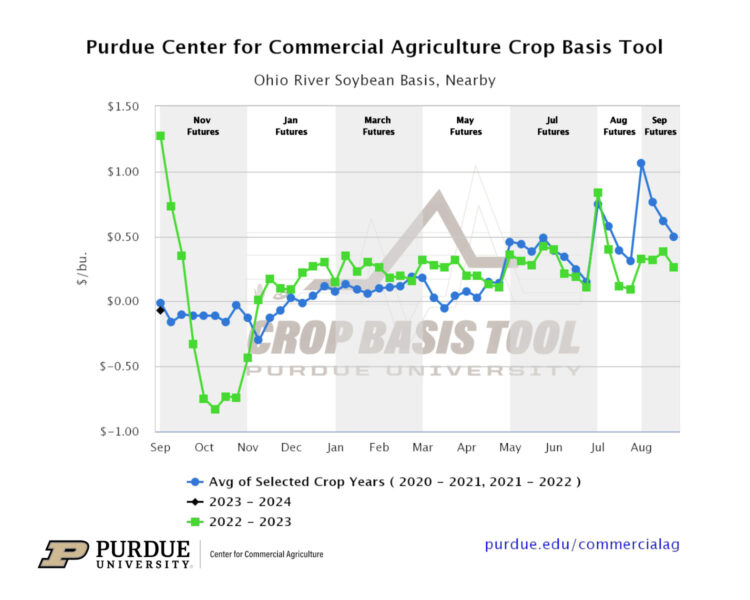
Figure 5. Ohio River Nearby Soybean Basis; Source: Purdue Center for Commercial Agriculture Crop Basis Tool
![]()
![]()
![]()
![]()
![]()
TAGS:
TEAM LINKS:

RELATED RESOURCES
UPCOMING EVENTS
We are taking a short break, but please plan to join us at one of our future programs that is a little farther in the future.