October 6, 2025
Crop vs. Livestock Sentiment: Perspectives from the Ag Economy Barometer
by Michael Langemeier, James Mintert, and Joana Colussi
![]()
![]()
![]()
![]()
![]()
The Purdue University-CME Group Ag Economy Barometer index is computed each month to gauge producer sentiment among a group of U.S. agricultural producers (Langemeier and Mintert, 2025). The barometer’s index for August 2025 was 125, indicating that average sentiment was more positive than during the index’s base period (i.e., the fourth quarter of 2015 and the first quarter of 2016). The Ag Economy Barometer index is subdivided into two sub-indices: the Index of Current Conditions and the Index of Future Expectations. Index values for August 2025 were 129 for the Index of Current Conditions and 123 for the Index of Future Expectations. The monthly report illustrates producer sentiment indices for both crop and livestock producers. This article explores producer sentiment by farm type, offering insights into the economic outlook of each sector.
Producer Sentiment by Farm Type
Every month, respondents of the Ag Economy Barometer (AEB) survey are asked whether crop or livestock producers will have widespread good times or widespread bad times over the next five years. A separate question is used for crops and livestock. These two questions are addressed to all respondents. In the August 2025 survey, 24% of respondents indicated that crop producers will have widespread good times, and 67% of respondents indicated that livestock producers will have widespread good times.
The monthly survey also includes two questions related to livestock production. The first question asks producers whether their farm has a beef, hog, or dairy operation. The second question is addressed to those who answer the first question affirmatively and asks survey respondents whether their livestock operation accounts for less than 25%, 25 to 50%, 50 to 75%, or more than 75% of their farm’s revenue.
We used the two livestock questions from the August 2025 survey to divide the monthly survey respondents into two groups. The first group (260 farms) derived less than 50% of their revenue from livestock production, and the second group (141 farms) derived more than 50% of their revenue from livestock production. Given the current relative financial strength of the livestock sector, we expect livestock farms to be more optimistic.
Producer sentiment in the August 2025 survey for all the respondents and for crop and livestock farms is presented in Table 1. As noted above, the average Ag Economy Barometer (AEB) index was 125. The index for the livestock farms was 153, which was 43 points higher than the index for crop farms. The difference in the Index of Current Conditions (ICC) for the two groups was much wider than the difference in the Index of Future Expectations (IFE). Producer sentiment for livestock farms can be used to help explain why the ICC index was higher than the IFE index for all the respondents.
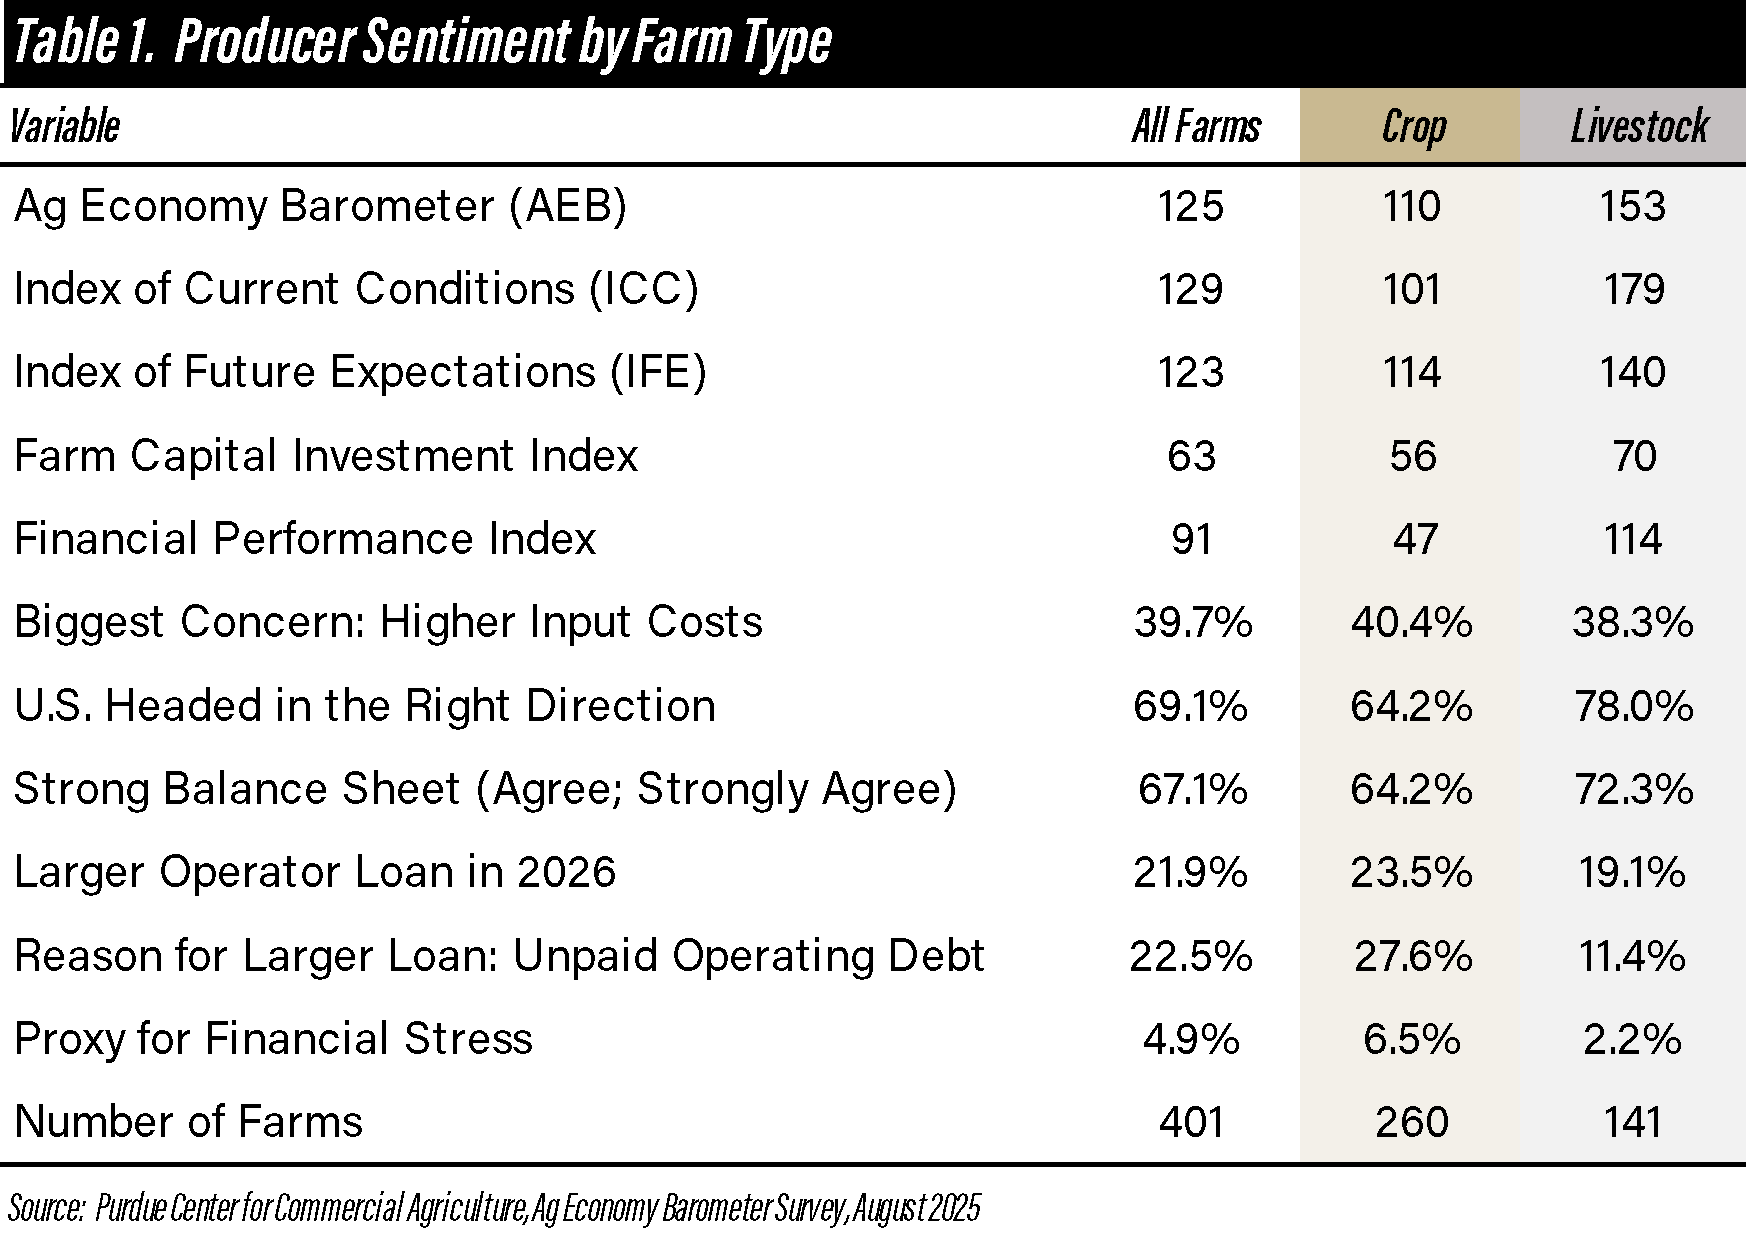
Table 1. Producer Sentiment by Farm Type
The Farm Capital Investment index measures whether respondents think now it is a good time or a bad time to make farm investments, including items like machinery and buildings. An index below 100 indicates that more respondents think it is a bad time rather than a good time to make such investments. The Farm Capital Investment index was 56 for crop farms and a slightly more optimistic 70 for livestock farms in the August AEB survey.
The Financial Performance index measures whether a farm expects its financial performance to be better than, worse than, or about the same in the next 12 months. An index below 100 indicates that more farms expect their performance to be worse rather than better in the next 12 months. The average index for August was 91. The average indices for crop farms was just 47 while livestock farms with a reading of 114 were more optimistic.
Another monthly AEB question asks respondents to identify their biggest concerns for their farm using the following response choices: lower crop and/or livestock prices, high input costs, environmental policy, farm policy, interest rates, and availability of inputs. High input costs were the biggest concern for both crop and livestock farms.
In August, survey respondents were also asked the following question: Would you say that things in the U.S. today are generally headed in the right direction or on the wrong track? In aggregate, 69% of the respondents indicated that policy is on the right track. Though relatively high for both crop and livestock farms, a higher percentage of livestock farms indicated that policy is on the right track.
Financial Stress by Farm Type
In two previous surveys – a strategic risk survey (Lippsmeyer et al., 2023) and a farm goals survey (Langemeier, 2025) – we posed the following question: How strongly do you agree with the following statement: we have a strong balance sheet. These two surveys used a similar methodology but were conducted separately from the monthly AEB survey. The balance sheet question was also included in the August AEB survey (Table 1). The results from the three surveys are illustrated in Figure 1.
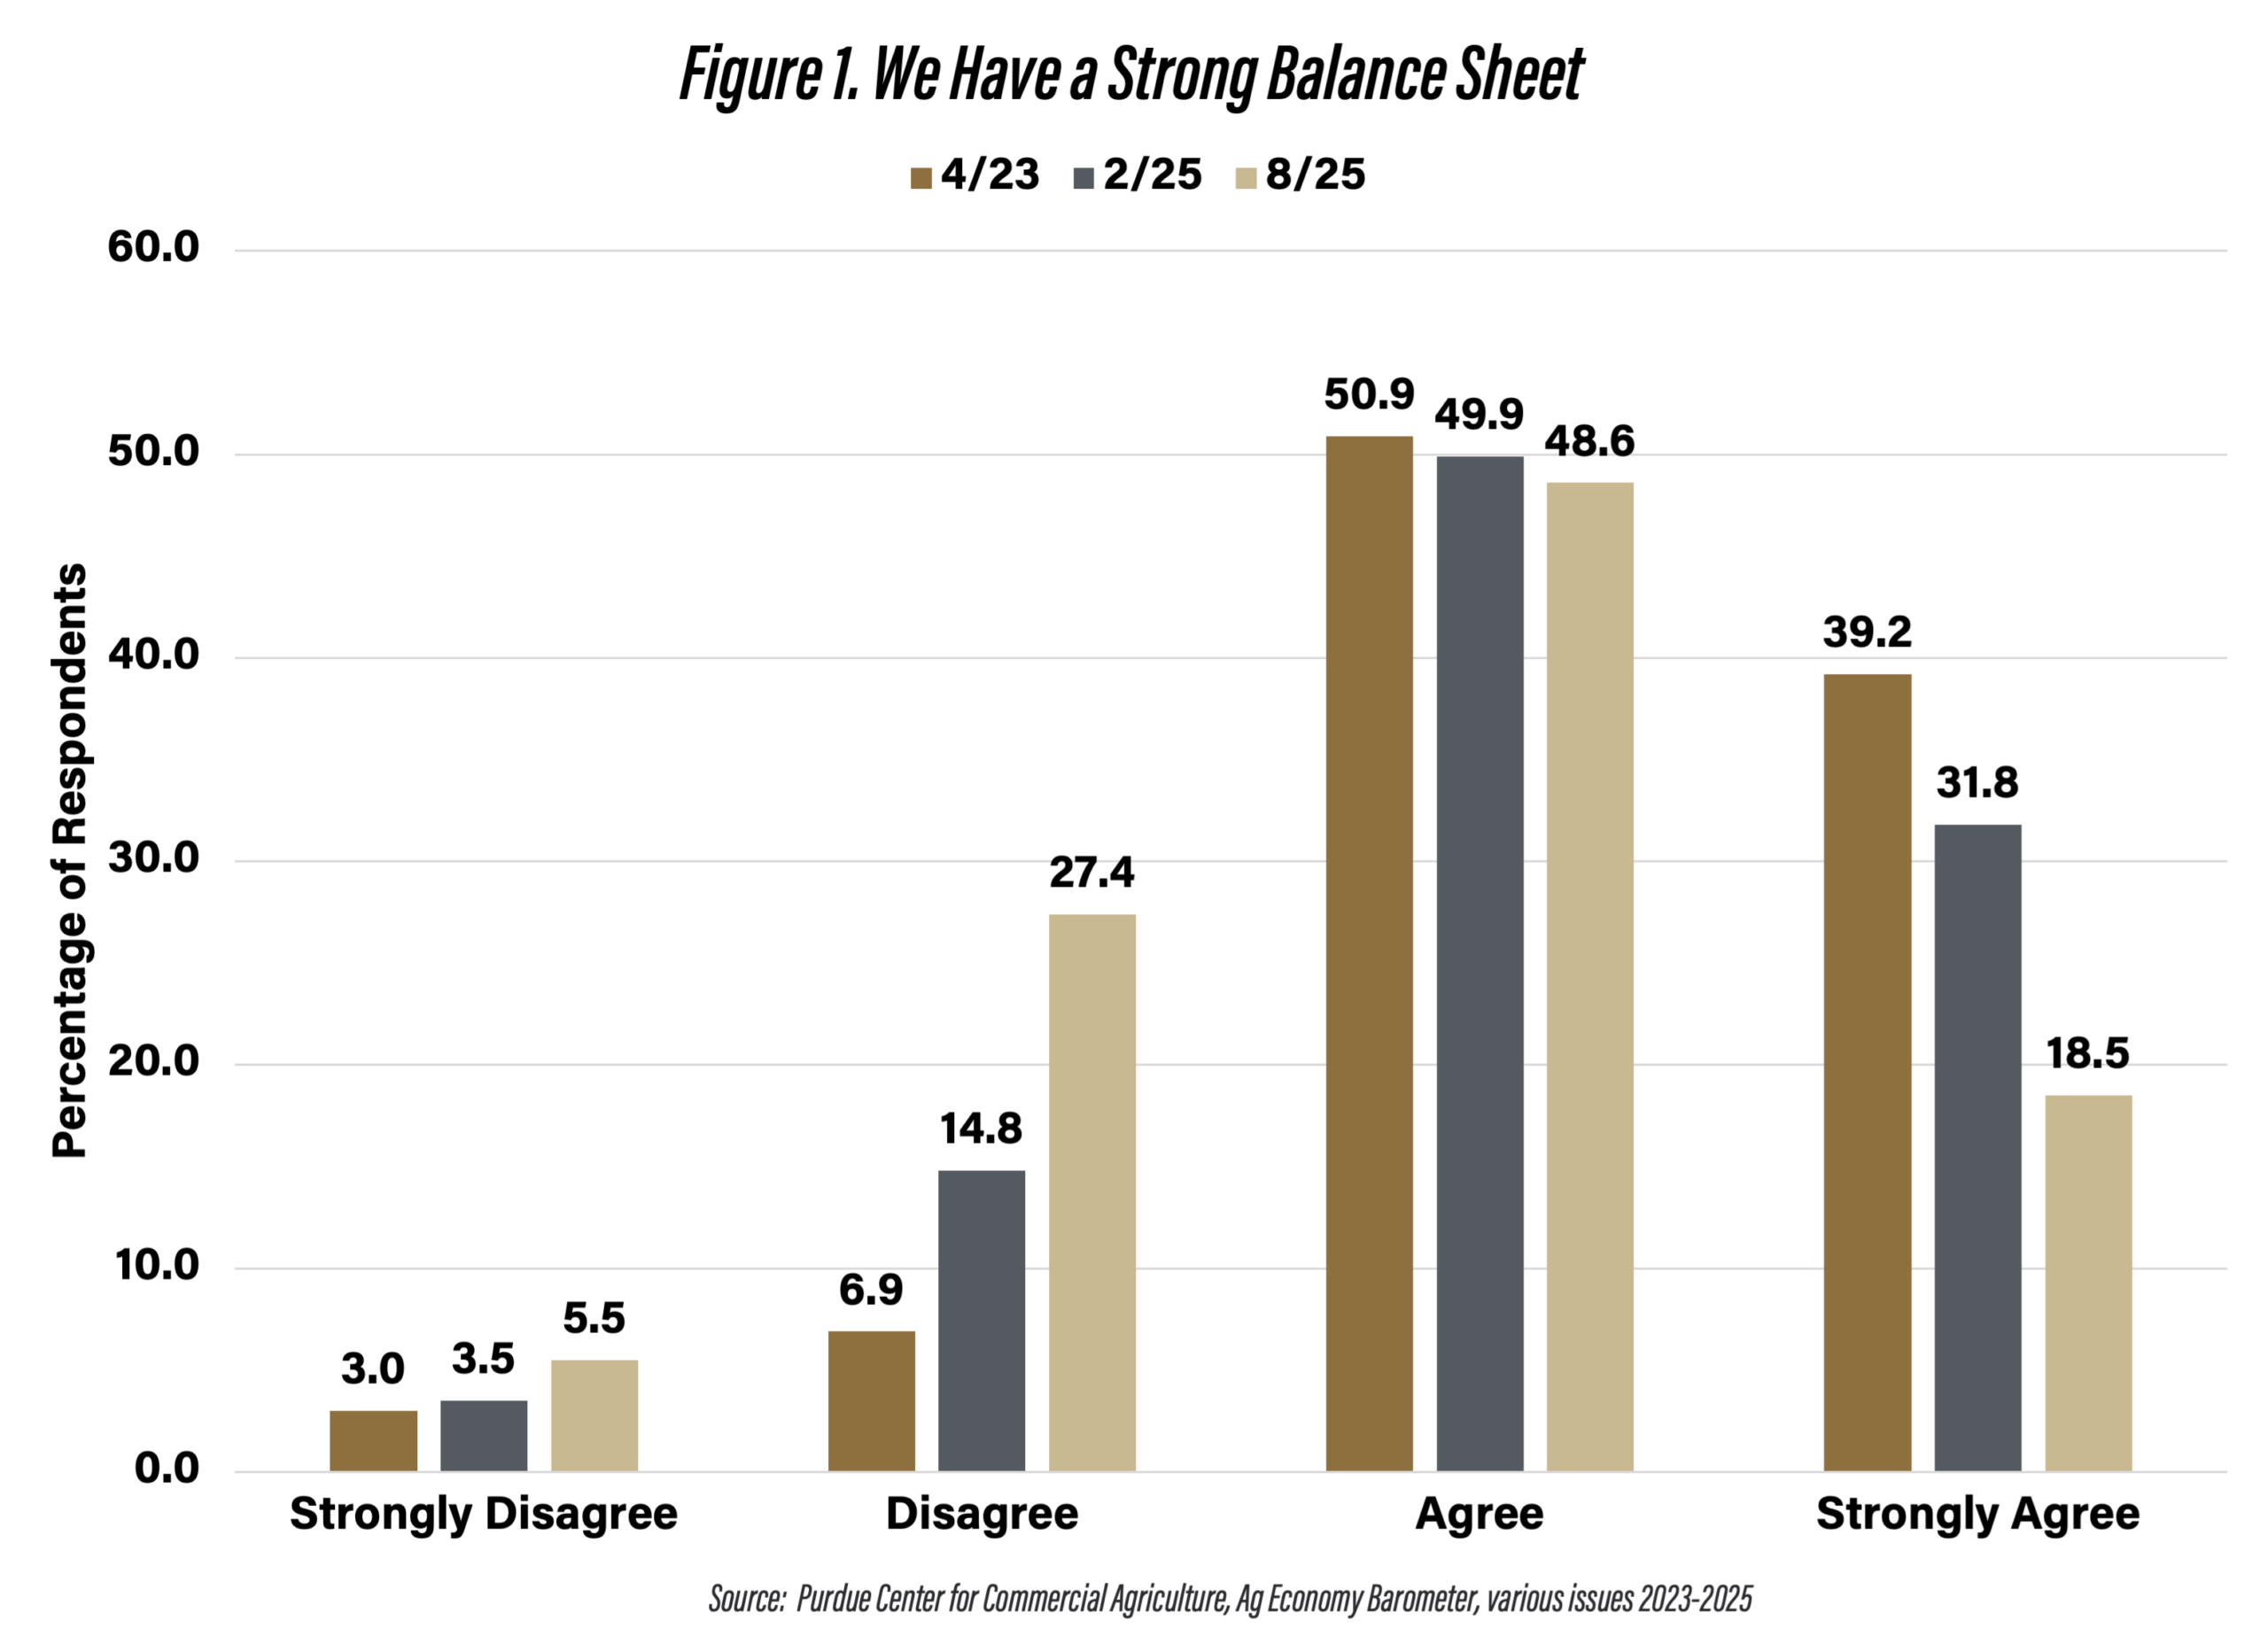
Figure 1. We Have a Strong Balance Sheet
The percentage of respondents who agreed or strongly agreed that their farm had a strong balance sheet was 90% in April 2023, 82% in February 2025, and 67% in August 2025. From Figure 1, it is clear that the percentage of respondents who strongly agree fell sharply, and the percentage of respondents who disagreed increased sharply from February to August of this year.
Periodically, the monthly AEB survey includes questions about operating loans. The first question asks respondents whether they expect the size of their operating loans to increase in the upcoming year. The second question, addressed to those who expect to increase the size of their operating loans, asks whether the increase is due to increases in input costs, increases in operation size, or unpaid operating debt from the previous year. The combination that includes a larger operating loan due to unpaid operating debt from the prior year serves as a proxy for financial stress.
The percentage of crop farms and livestock farms that expect to have a larger operating loan in the upcoming year was 24% and 19%, respectively (Table 1). The difference in the responses for the second question varied substantially among crop and livestock farms, with more crop farms expecting difficulty in paying operating debt this year. The proxy for financial stress for all of the respondents was 4.9% in August which was more than four times the value recorded in January 2023 and nearly double January 2024’s value (Figure 2). The percentage of crop farms that were financially stressed, at 6.5%, was almost triple the percentage of livestock farms that were financially stressed. Though a different methodology was used, the 6.5% figure is consistent with the range (4% to 6% financially stressed) reported in Langemeier et al. (2025).
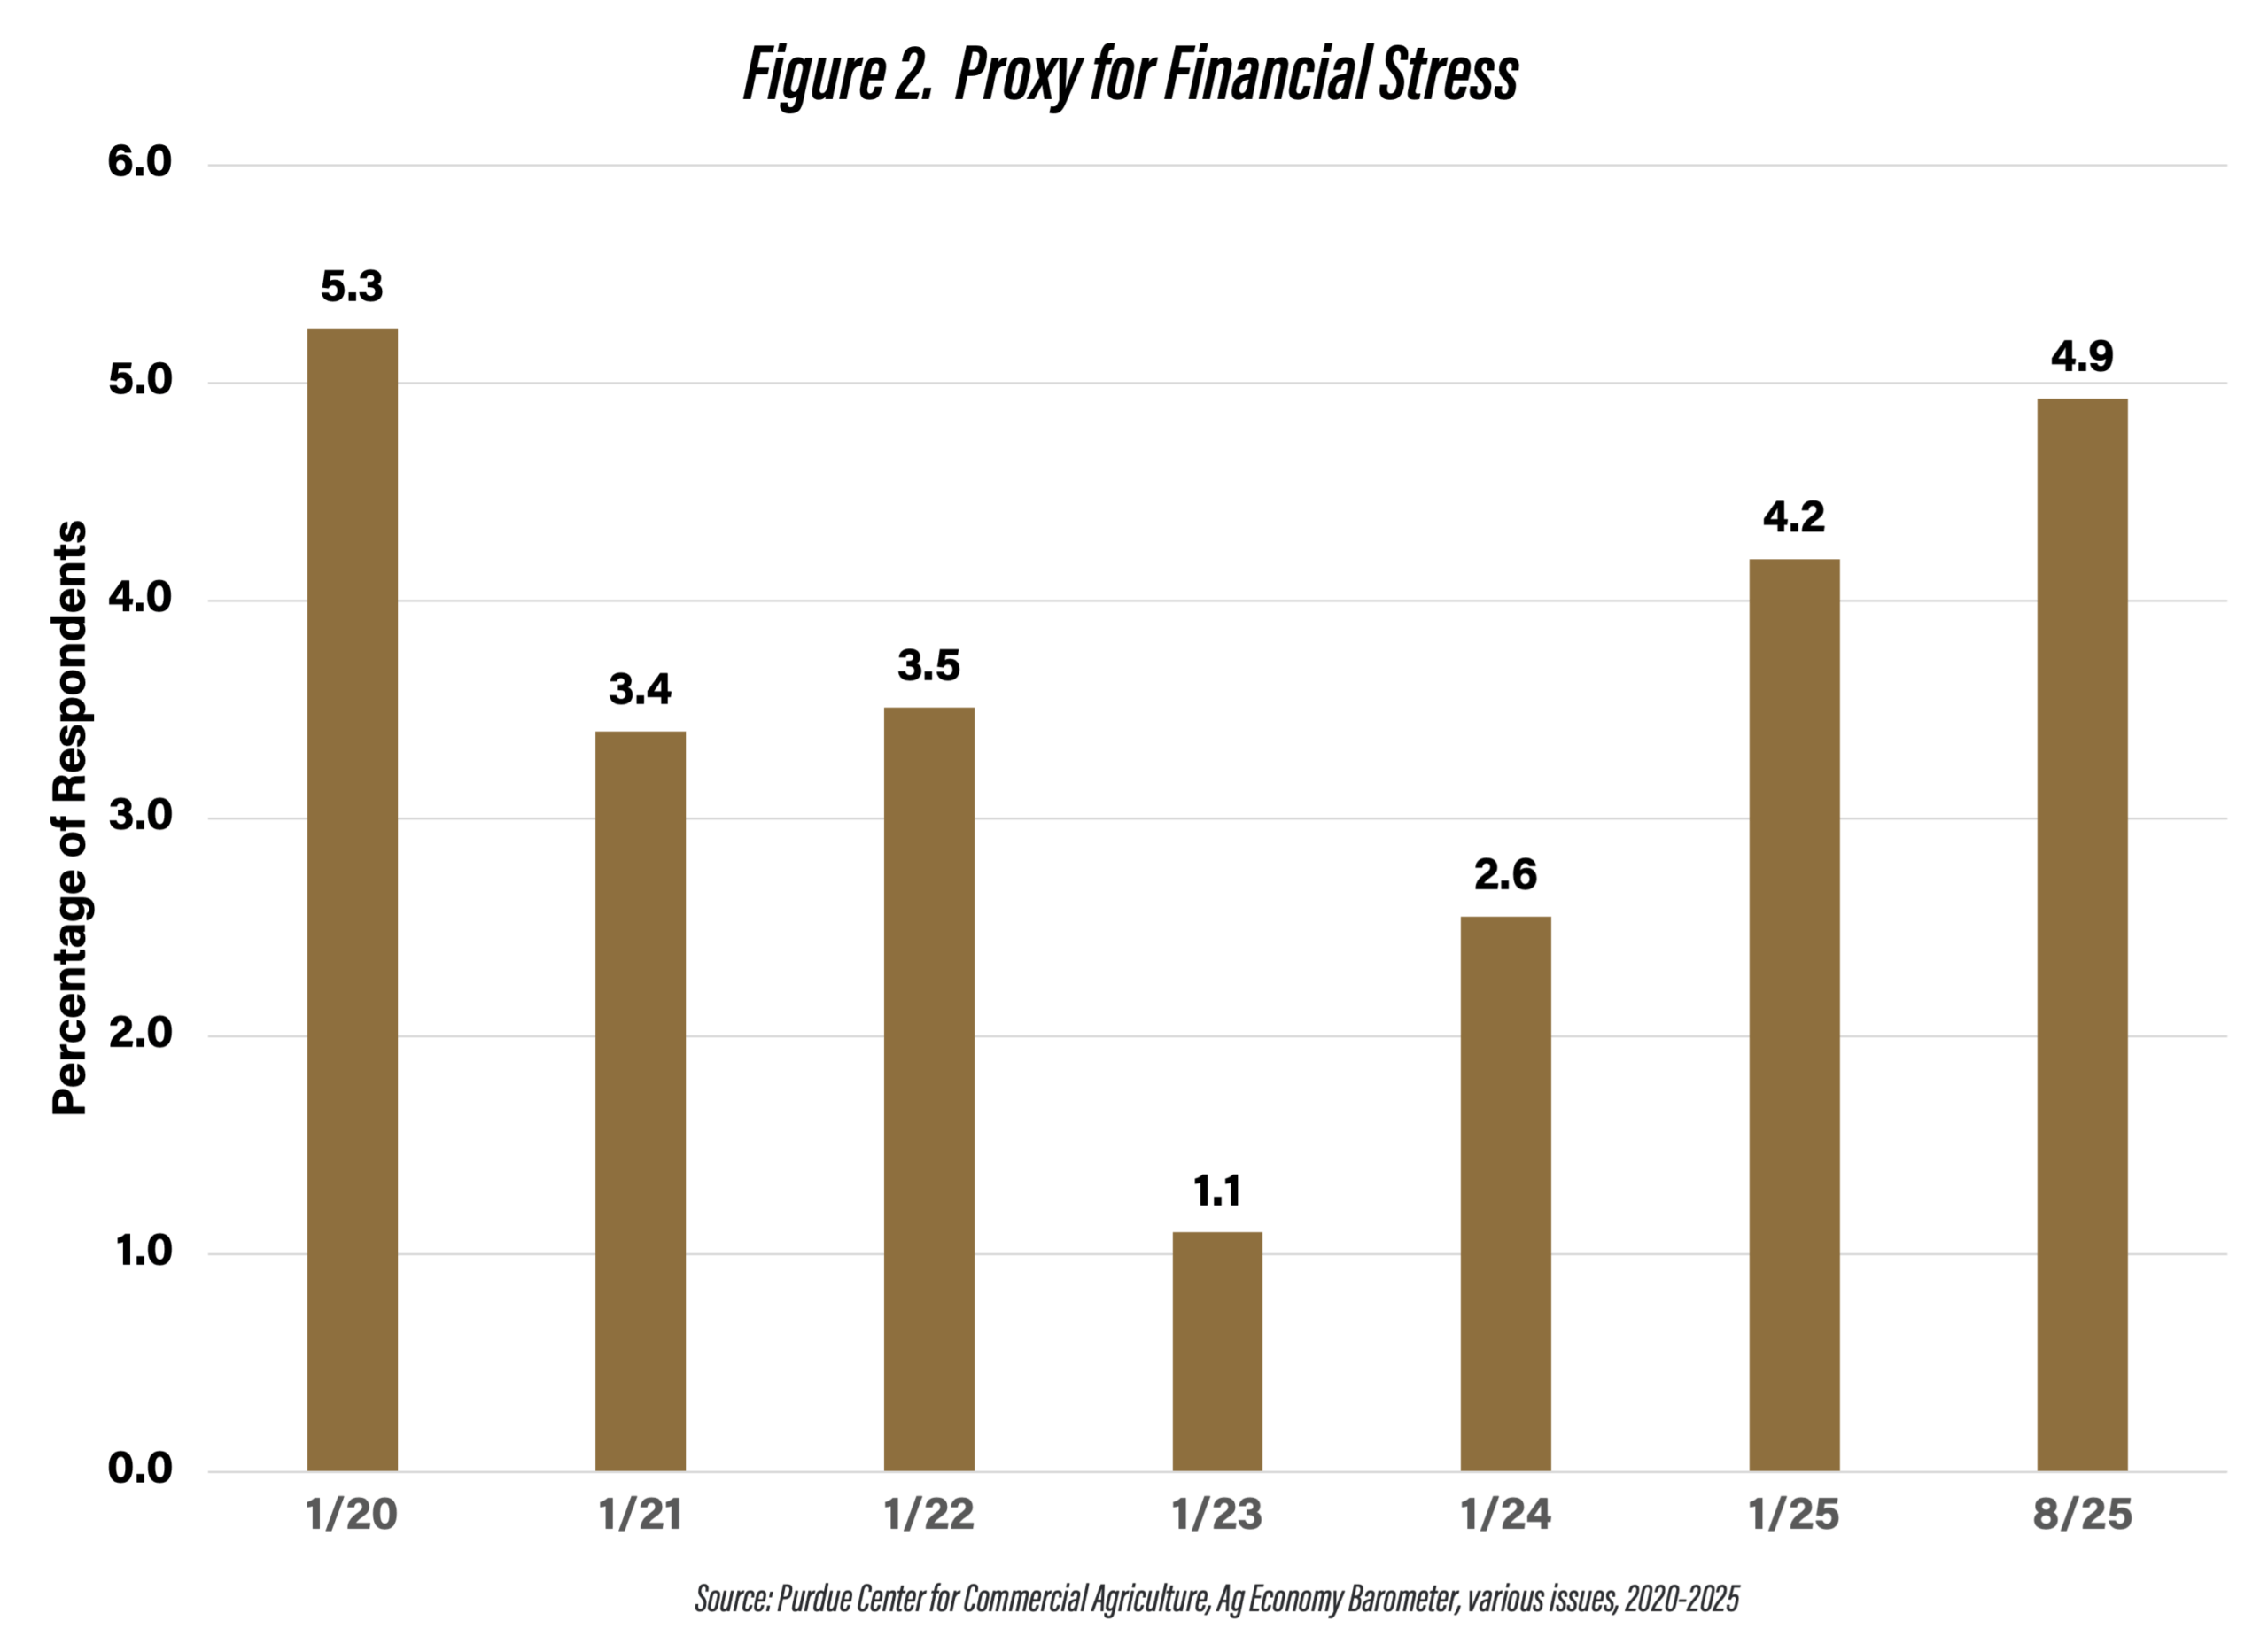
Figure 2. Proxy for Financial Stress
Conclusions
Given the large difference in prices received and projected net return prospects, it is not surprising to find a large difference in producer sentiment between crop and livestock producers in the August 2025 Ag Economy Barometer survey. In addition to differences in producer sentiment, larger percentages of crop producers expected to have larger operating loans in 2026, listed unpaid operator debt from the prior year as a reason for those larger loans, and were financially stressed.
The contrast in sentiment between crop and livestock producers reflects the broader realities playing out in the U.S. agricultural markets. Livestock producers, especially in the beef sector, are riding a wave of historically high prices and profitability – fueled by tight domestic supplies, a disease related prohibition on imports from Mexico, and import tariffs that have created favorable conditions for domestic producers. Meanwhile, the grain sector is under pressure from a combination of inflated because production costs and crop price weakness.
References
Langemeier, M. “Farm Goals.” Center for Commercial Agriculture, Purdue University, July 23, 2025.
Langemeier, M., M. Boehlje, and J. Colussi. “Financial Stress on Crop Farms: Who Is Most at Risk in the 2024–26 Downturn?.” Center for Commercial Agriculture, Purdue University, September 3, 2025.
Langemeier, M. and J. Mintert. “Farmer Sentiment Weakens as Producer Confidence in the Future Wanes.” Ag Economy Barometer, September 2, 2025.
Lippsmeyer, M., M. Langemeier, J. Mintert, and N. Thompson. “Resilience to Strategic Risk.” Center for Commercial Agriculture, Purdue University, June 20, 2023.
![]()
![]()
![]()
![]()
![]()
TAGS:
TEAM LINKS:


RELATED RESOURCES
UPCOMING EVENTS
We are taking a short break, but please plan to join us at one of our future programs that is a little farther in the future.