October 31, 2025
Using the Long-Run Cash Rent Spreadsheet: When to Hold Them or Fold Them?
by Michael Langemeier, Mike Boehlje, and Joana Colussi
![]()
![]()
![]()
![]()
![]()
The Purdue Center for Commercial Agriculture (CCA) developed a long-run cash rent spreadsheet to assist operators and tenants with their cash rent renewal decisions. This spreadsheet was specifically designed several years ago to help determine whether it would be feasible to continue to rent a particular parcel of land in a low-price environment. Farmers typically find that rental rates don’t adjust rapidly during a downturn and consequently they lose money on rented land. But most farmers don’t want to give up rented land even if it is not profitable because it is difficult to find another parcel to replace it. They continue to hold on to rented land waiting for better prices, lower costs, and/or higher yields.
The fundamental question is how long can they delay the decision. In other words, when should they hold them and when should they fold them? This question has become even more relevant today, given the financial pressure currently faced by crop producers across the Corn Belt, including lower commodity prices, tighter margins, and higher interest rates. This article describes the key features of the tool and provides an example of how the spreadsheet can be used.
Key Features and How to Use
The spreadsheet uses two sheets for projections. The first sheet contains current crop budget information. Users can input information for up to three full season crops and one double crop. The budget layout closely follows the Purdue Crop Cost and Return Guide (https://purdue.ag/cropbudget). Input cells have a yellow background. In addition to earnings per acre, breakeven prices for each crop are computed. These budgets establish the current cost structure and the revenue projections for the first year.
The second sheet of the spreadsheet has the following sub-sections: acres operated; yields for the next five years (e.g., 2026 to 2030); cash price scenarios; non-land cost changes; projected earnings; break-even rents; and working capital analysis. Input cells have a yellow background. All information should be reported in nominal rather than inflation-adjusted dollars.
In the first sub-section of the second sheet, Acres Operated, the user indicates how many crop acres are operated and the percentage of acres included in the analysis (i.e., how large the tract is compared to a farm’s total crop acres). If the tract being examined is relatively small compared to total crop acreage, it is more feasible to hold on to a tract for which cash rent is well above break-even rent.
In the second sub-section of the second sheet, Yields for the Next Five Years, the user estimates trend yields by indicating the annual expected increase in bushels per acre for each crop. The default information represents long-run increases in crop yields for Indiana. This sub-section assumes that a trend yield was reported in the crop budgets developed in the first sheet.
In the third sub-section of the second sheet, Cash Price Scenarios, the user projects prices for the next five years. The first year was estimated through the crop budget that was filled out in the first sheet. Although projecting crop prices two to five years out seems like a daunting task, there are several sources that can be used to project long-run prices including, but not limited to, futures prices, and projected prices reported by the Food and Agricultural Policy Research Institute (FAPRI) or USDA-ERS.
In the fourth subsection of the second sheet, Non-Land Cost Changes, the user projects the changes in non-land costs for the next five years. In the last 10 years, the average increase in input prices for production agriculture has been approximately 2% per year. In 2021 and 2022, input prices increased more than 10% per year. We usually start with a relatively low percentage increase (e.g., 0%) and then see how sensitive earnings and trends in working capital are to increases in input prices.
In the fifth sub-section of the second sheet, Projected Earnings, the user projects government payments, crop insurance indemnity payments, other revenue, and land cost (i.e., cash rent) for the next five years. As a starting point, we usually project zero government payments, crop insurance indemnity payments, and other revenue; unless we are relatively confident that these items will be non-zero. This sub-section reports earnings per acre, which are computed by subtracting cash and opportunity costs from total revenue.
The sixth sub-section of the second sheet, Break-Even Rents, reports the breakeven cash rent with all non-land costs (cash and opportunity costs) included and the cash rent premium for each year. The cash rent premium represents the difference between cash rent and the break-even rent given total revenue and non-land cost projections. When break-even rent is below cash rent, the cash rent premium will be positive. In the long run, the cash rent premium will be approximately zero. In low-price years (e.g., 2014-2019; 2024-2025), the cash rent premium is expected to be positive. The magnitude of the cash rent premiums is incorporated into the working capital analysis, described below.
In the last sub-section of the second sheet, Working Capital Analysis, is where the rubber hits the road. The user first enters the beginning working capital per acre. This number is computed using a two-step process. First, if a farm has both crop and livestock enterprises, the user needs to estimate how much working capital (current assets minus current liabilities) is associated with the crop enterprises. Second, divide crop working capital by the number of crop acres. Working capital per acre for each year is then computed using beginning working capital per acre, earnings per acre, and the percentage of acres included in the analysis. If earnings are very negative and/or the percentage of acres represented by the tract being analyzed is relatively high, working capital per acre will drop dramatically over time. At what point does this drop in working capital become a crisis? The answer to this question is farm-dependent, but a couple of gauges are helpful in this determination. As a rule of thumb, when working capital per acre is below $350, liquidity becomes tight. Also, when the working capital to gross revenue ratio falls below 35%, liquidity becomes tight. In general, a farm would not want the working capital to gross revenue ratio to fall below 20% for an extended period of time.
Vignette
Updated default data can be found in the version of the long-run cash rent spreadsheet labeled as an example (here). This data can be used to discuss an example of how the tool can be utilized. The crop budget in the first sheet assumes that 70% of the acreage is devoted to a corn/soybean rotation, and 30% is devoted to a wheat/double crop soybean system. Crop budget information was taken from the 2026 Purdue Crop Cost and Return Guide.
The farm has 1500 crop acres. The tract of interest is comprised of 150 acres and thus represents 10% of the total crop acreage. Crop yields in 2026 assume trend yields for Indiana. Trend corn and soybean yields are expected to increase by 2.0 and 0.5 bushels per acre per year, respectively, while trend wheat yields are expected to increase by 1.0 bushel per acre per year. The first part of Table 1 displays the annual yield per acre for each crop.
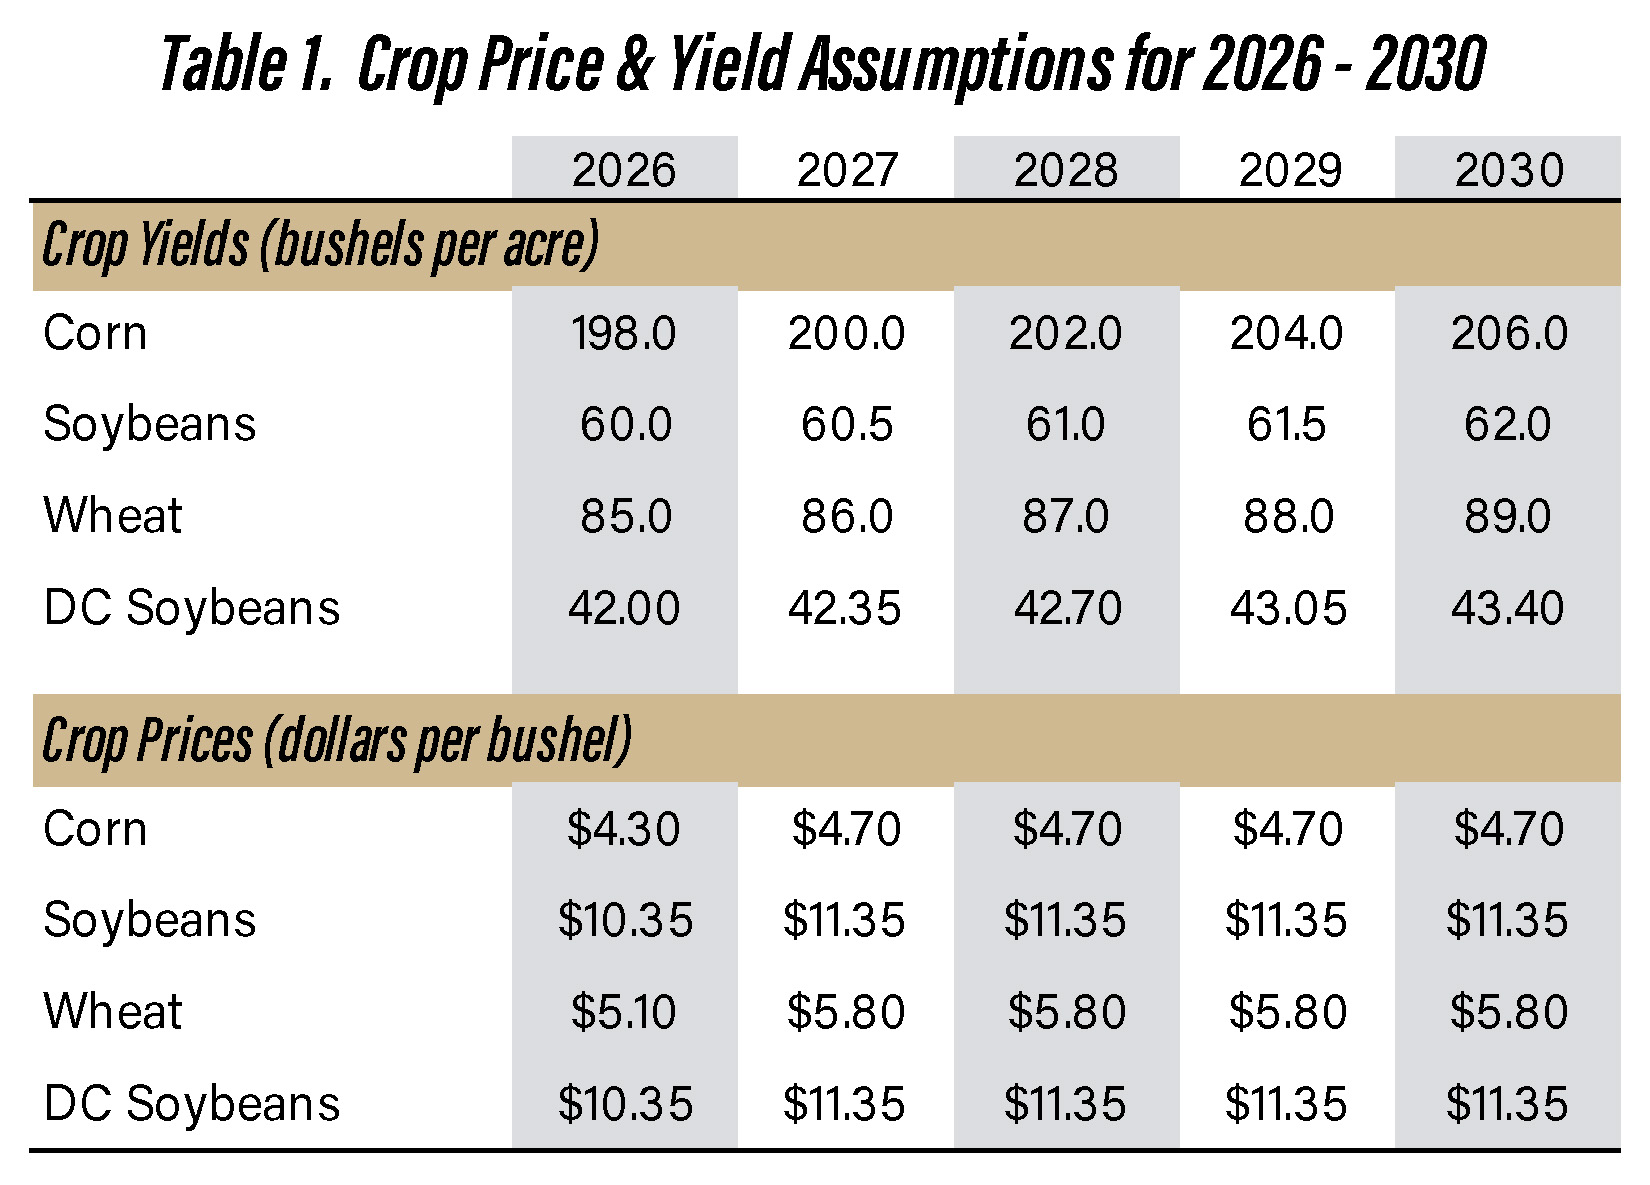
Cash price projections for 2026 were obtained from the 2026 crop budget. Prices were assumed to revert back to their long-run averages since 2007 for the 2027 through 2030 period (see Table 1). A user will want to determine how sensitive cash rent premiums and changes in working capital are to alternative crop price assumptions.
Non-land cost changes are assumed to remain flat from 2027 through 2030, and government payments, crop insurance indemnity payments, and other revenue are assumed to be zero in these years. Moreover, cash rent is assumed to remain at 2026 levels (i.e., $261 per acre). Again, a user may want to check how sensitive the results are to changes in assumptions pertaining to non-land costs, revenue sources, and annual cash rent. Historically, the average increase in cash rent for Indiana since 1973 is 3.7% per year.
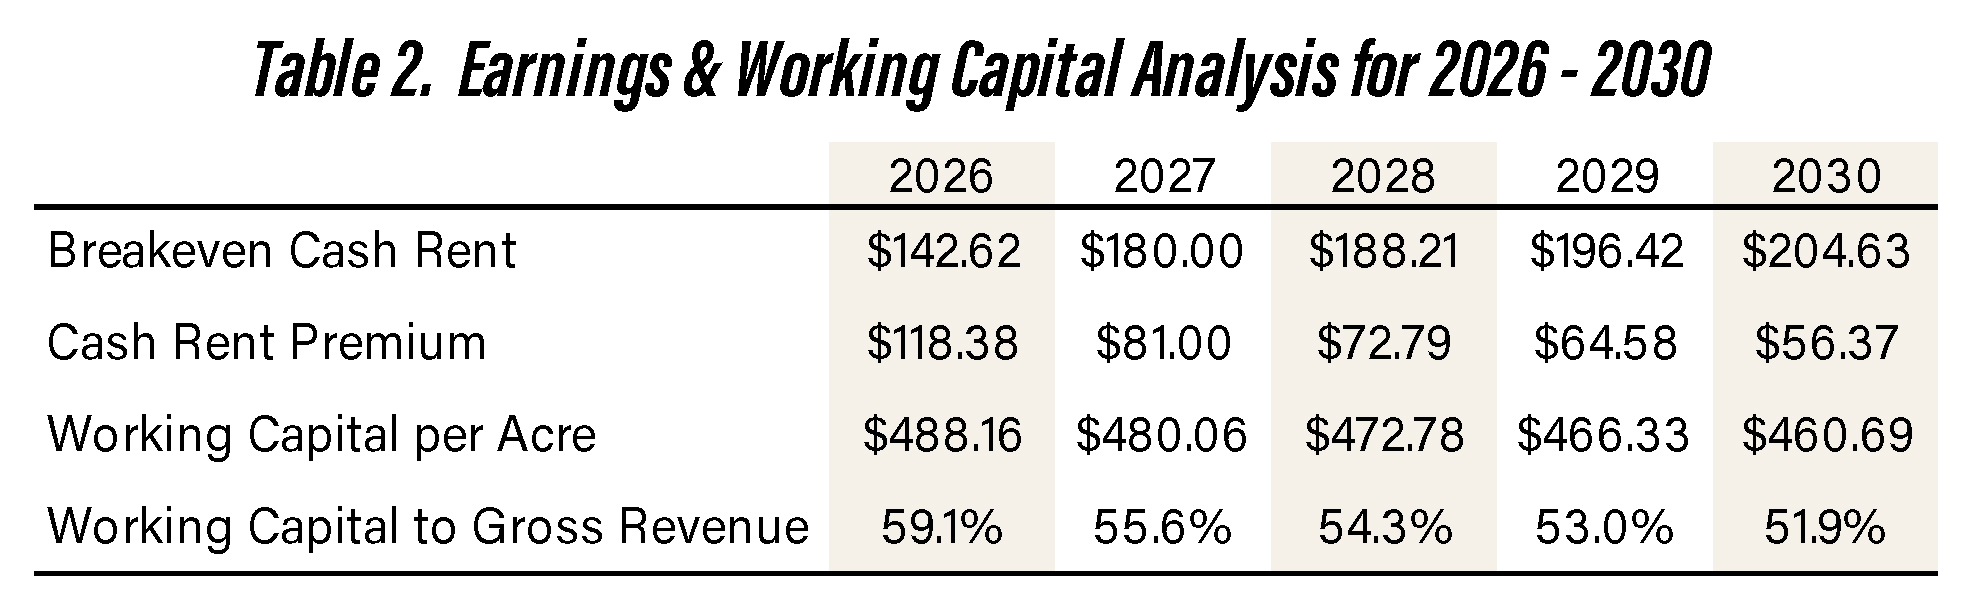
Given the assumptions noted above, earnings are expected to range from a negative $118 in 2026 to a negative $56 in 2030. Improvements in earnings are primarily the result of the trend yield assumptions. The breakeven cash rent increases from $143 in 2026 to $205 in 2030, remaining well below the annual cash rent of $261 per acre.
The working capital results are presented in Table 2. Beginning working capital was assumed to be $500 per acre. Working capital in 2026 was $488. Working capital slowly eroded during the five-year period reaching $460 per acre in 2030. The working capital to gross revenue ratio remained above 35% during the entire five-year period. Finally, if the farm decided to give up this tract of land; machinery, building, and labor cost would increase $15.33 per acre.
Given the results in Table 2, what should the farm give up this tract of land. Most farms would not be concerned about the relatively small drop in working capital per acre and the working capital to gross revenue ratio. However, this story is sensitive to our crop price, non-land cost, and cash rent assumptions. Lower crop prices, and/or higher non-land costs and cash rents could create a situation where working capital per acre drops below $350 per acre. In this situation the decision on whether to give up the tract would become much more difficult.
Sensitivity Analysis
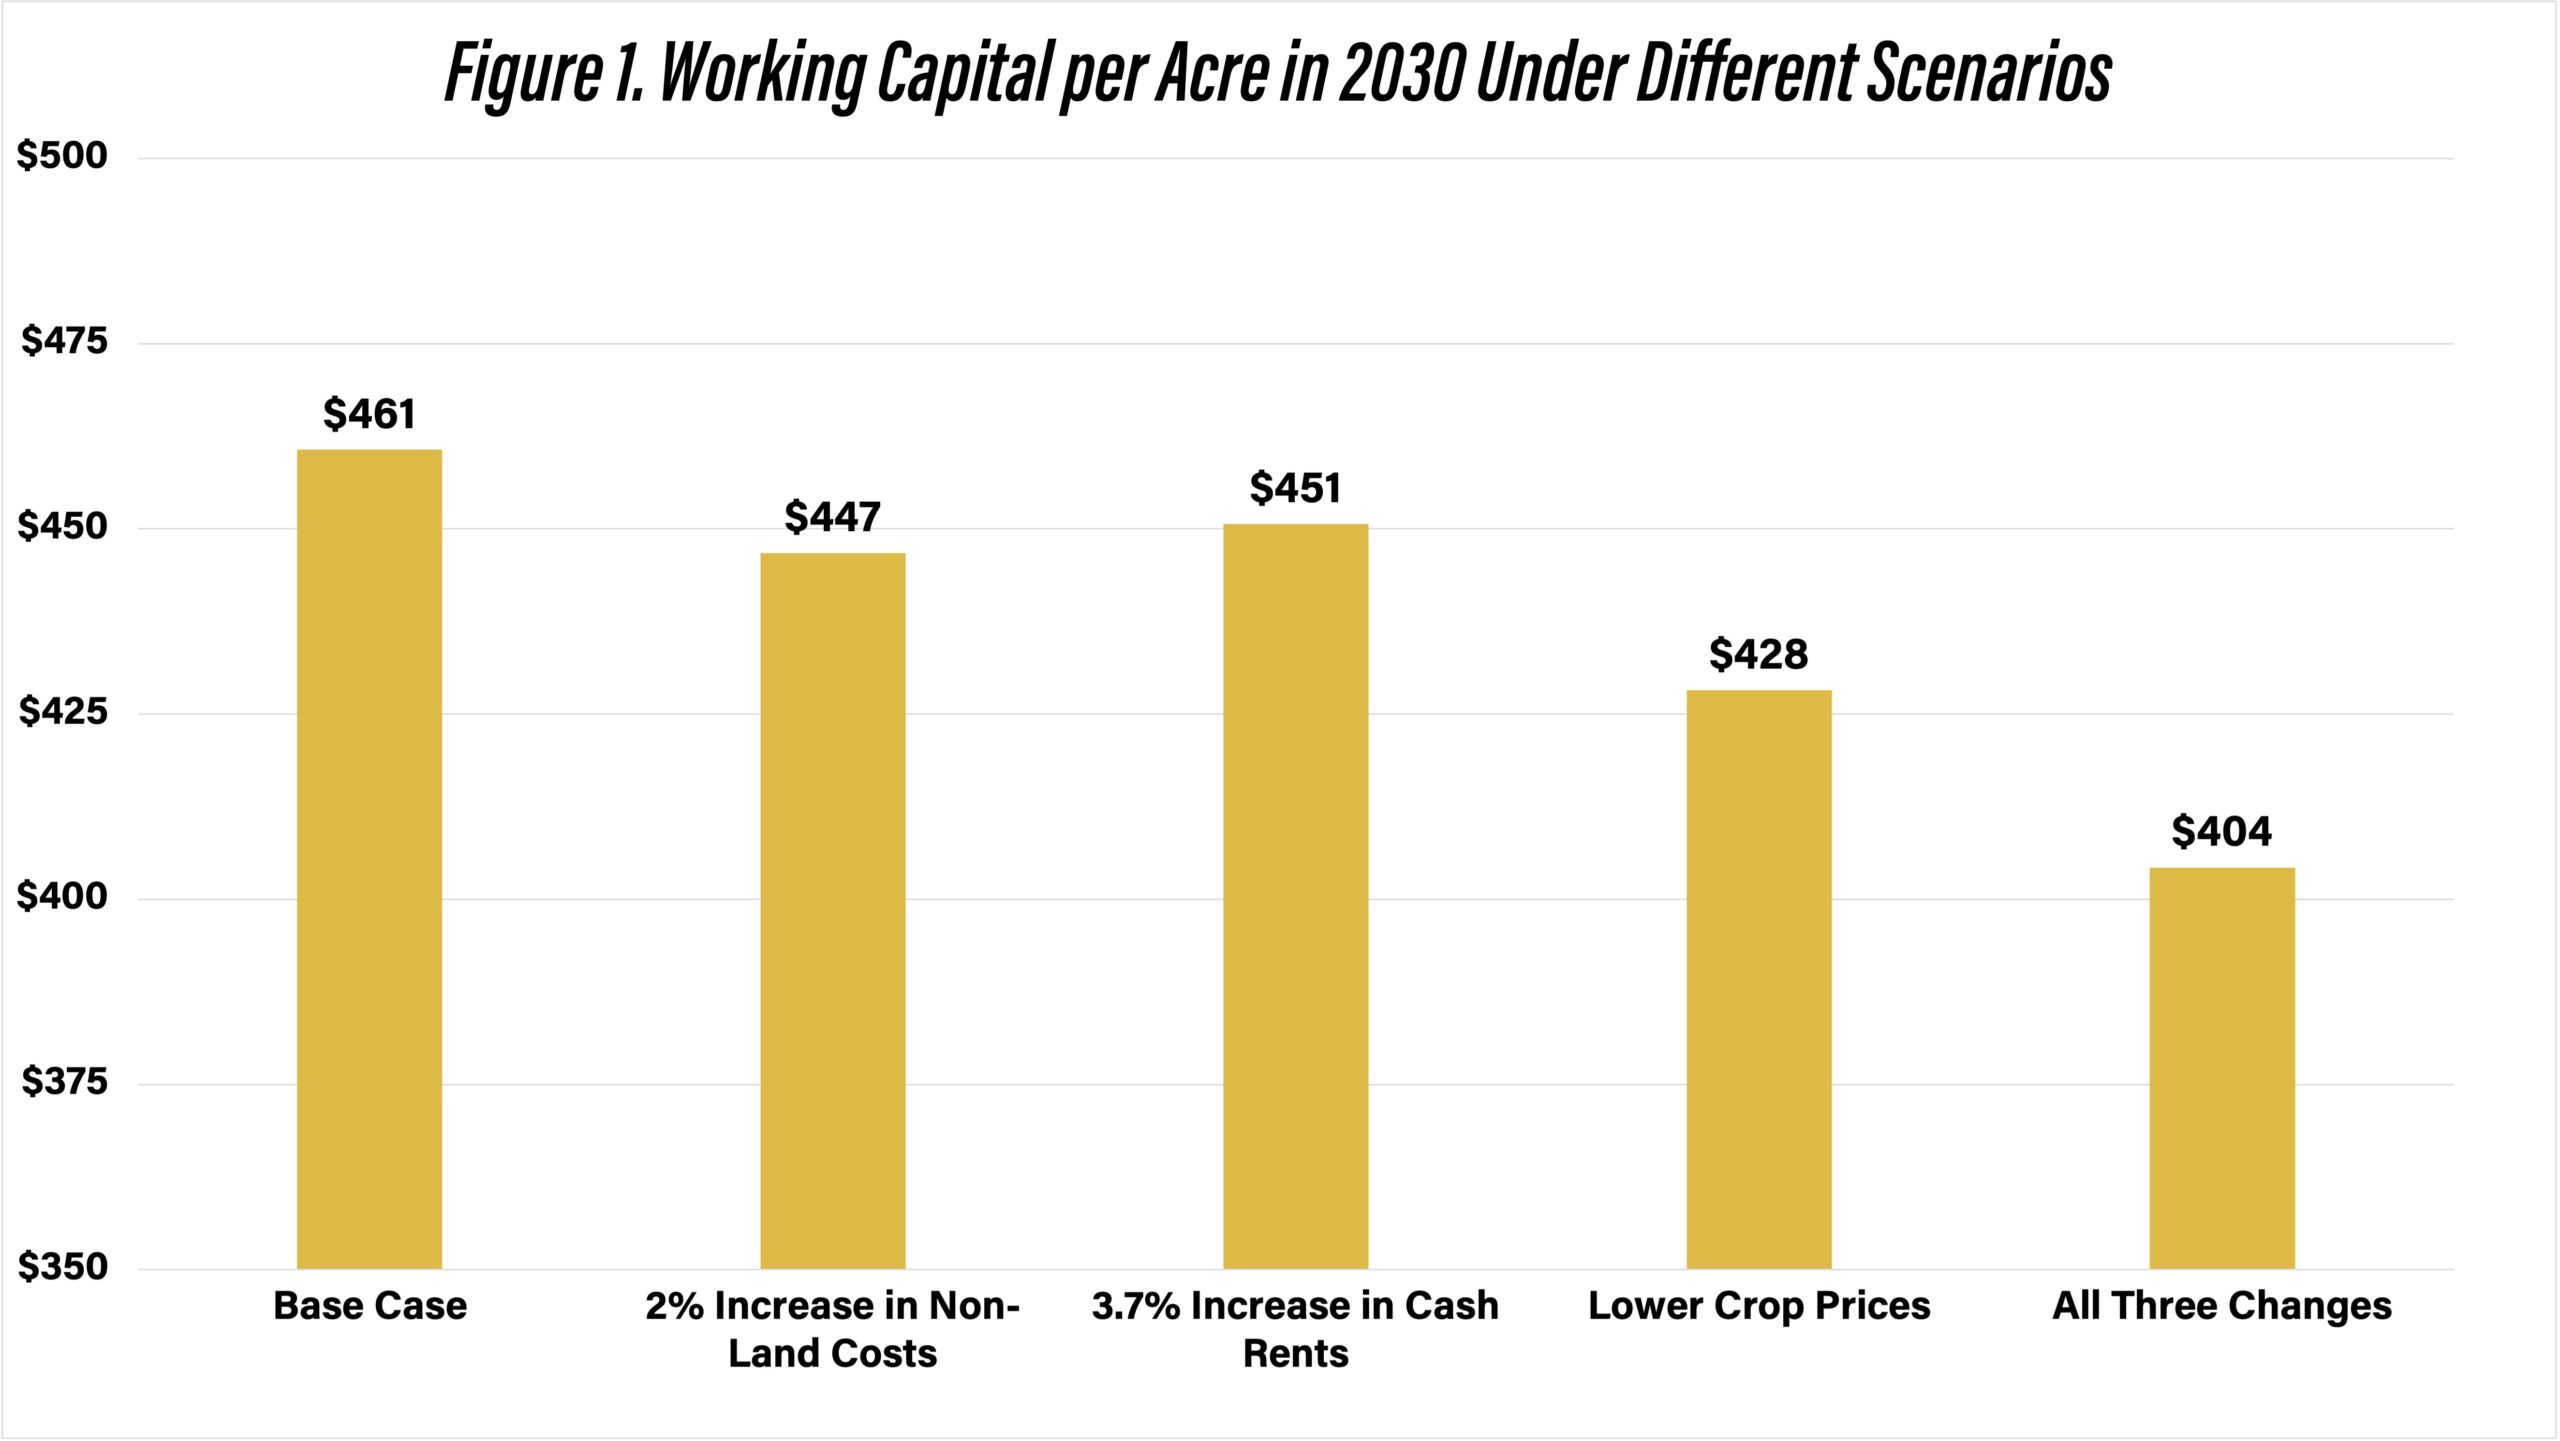
Figure 1 illustrates the sensitivity of the results to changes in assumptions regarding non-land costs, cash rent increases, and crop prices. The example described in the previous section represents the base case. For the base case, working capital per acre in 2030 is $461. If non-land costs are assumed to increase by 2% per year, working capital per acre in 2030 drops to $447. If cash rent increases by 3.7% and non-land costs do not increase, working capital in 2030 drops to $451. If crop prices remain at their 2026 level throughout the five-year period and costs do not increase, working capital per acre declines to $428. Finally, if costs increase and crop prices remain at 2026 levels, working capital per acre drops to $404. In summary, working capital per acre did not drop below $350 for any of the cost and crop price scenarios.
One of the key assumptions that we have not examined yet is the relative importance of the tract being examined to the farm’s total crop acreage. Under the scenarios examined so far, we have assumed that the tract represents 10% of total crop acreage. If the tract represented 25% of total crop acreage, costs increased, and crop prices remained at 2026 levels; working capital per acre in 2030 would drop to $260. If the tract represented 50% of total crop acreage, working capital per acre in 2030 would drop to $24. Obviously, the relative importance of the tract has a large impact on the results.
Conclusions
This article has described the key features and provided an example of how to use the long-run cash rent spreadsheet posted on the Purdue Center for Commercial Agriculture’s web site. The critical determination of whether it is not feasible to continue to cash rent a particular parcel of land depends on the erosion of working capital over time. Even during times of low prices and/or high input costs, an operator will likely continue to cash rent a particular parcel of land if the erosion in working capital is relatively small and/or the beginning working capital was relatively strong. Reasons for this are twofold. First, it is often difficult to find another tract to replace the tract that an operator is giving up. Second, the goal is not too breakeven every year. Rather the goal is to have the net returns in the good years more than offset the net returns in the bad years.
Looking ahead, the long-run cash rent spreadsheet will continue to be a valuable decision-making tool as producers face ongoing uncertainty to commodity prices, interest rates, and production costs. As margins tighten and financial risks increase, tools like this are relevant for helping farmers evaluate leasing decisions, preserve working capital, and ensure the long-term financial resilience of their operations.
References
Center for Commercial Agriculture. “Long-Run Cash Rent Spreadsheet,” October 2025.
(https://purdue.ag/long-run-cash-rent-tool).
![]()
![]()
![]()
![]()
![]()
TAGS:
TEAM LINKS:


RELATED RESOURCES
UPCOMING EVENTS
We are taking a short break, but please plan to join us at one of our future programs that is a little farther in the future.