The March 2026 CPI Report: What It Tells Us About the Iran Conflict’s Inflation Footprint — And What Is Still Coming
April 13, 2026
PAEPB-2026-04
Ken Foster, Professor of Agricultural Economics and Director, Purdue Farm Policy Study Group
![]()
![]()
![]()
![]()
![]()
Key Takeaways
-The March 2026 Consumer Price Index (CPI) report, released April 10th by the Bureau of Labor Statistics, shows the all items CPI rising 0.9 percent for the month on a seasonally adjusted basis, and 3.3 percent over the past 12 months — up sharply from 2.4 percent in February.
-Nearly three-quarters of the monthly increase was attributable to a single category: gasoline, which rose 21.2 percent in March. The broader energy index rose 10.9 percent.
-Core inflation — all items less food and energy — rose just 0.2 percent for the month and 2.6 percent over the year, essentially unchanged from February. The underlying economy showed no new generalized inflationary pressure in March.
-The food index was flat for the month. Grocery store prices fell 0.2 percent; food away from home rose 0.2 percent. This reflects the supply chain lag documented in an earlier brief, not insulation from the Iran Conflict shock. The food price impact of the Iran Conflict has not yet arrived at the grocery store.
-The March energy price shock falls disproportionately on lower-income households, for whom gasoline represents a larger share of the household budget. The broader food and goods inflation still in the pipeline will compound this distributional burden.
-With Brent crude oil remaining high as of early April, and with key commodity inputs still facing severe transit restrictions through the Strait of Hormuz, the March report is likely best understood as the opening chapter of an inflation story — not a summary of it.
What the March Report Actually Shows
The jump from 2.4 to 3.3 percent in the 12-month CPI reading sounds alarming, but the structure of that increase is analytically important and more informative than the headline number. The BLS data allow a clean decomposition.
The entire story in March is energy — specifically gasoline. Motor fuels carry a weight of approximately 2.9 percent in the CPI basket. A 21.2 percent increase in gasoline prices, therefore, contributes roughly 0.6 percentage points to the 0.9 percent monthly CPI increase — consistent with the BLS characterization that gasoline alone accounted for nearly three quarters of the total. Add broader household energy costs (electricity, natural gas, home heating oil), which carry an additional 3.4 percent weight and also rose in March, and the energy complex as a whole explains essentially all of the monthly increase.
Everything else in the price index — food, shelter, medical care, apparel, recreation, communication — collectively contributed the remaining small fraction of the monthly change. Shelter rose a modest 0.3 percent, consistent with its recent trend. Medical care, used cars, and personal care actually declined. This is not a broad-based inflation episode. It is a targeted energy price shock with a highly concentrated source.
The food result deserves special attention. Grocery store prices fell 0.2 percent in March, and food away from home rose just 0.2 percent, leaving the food index flat for the month. A casual observer might find this reassuring. It likely is not – especially if traffic through the Strait of Hormuz continues to be restricted. The Iran Conflict began on February 28, 2026. The price data collected for the March CPI report largely reflect purchases made during the first three weeks of March — a period when Brent crude had risen sharply, but food manufacturers, processors, and retailers were still operating under procurement contracts locked in before the conflict began. As documented in an earlier brief on consumer food prices, the supply chain lag between an energy shock and retail food prices typically runs three to six months for most categories, and as long as twelve months for seasonally stored commodities. The flat March food reading is precisely what was predicted — and it means the potential for a food price reckoning is still ahead of us, not behind.
Figure 1
Decomposition of the March 2026 Monthly CPI Increase by Category
Total All-Items CPI rose 0.9% (SA); gasoline alone accounted for nearly three-quarters
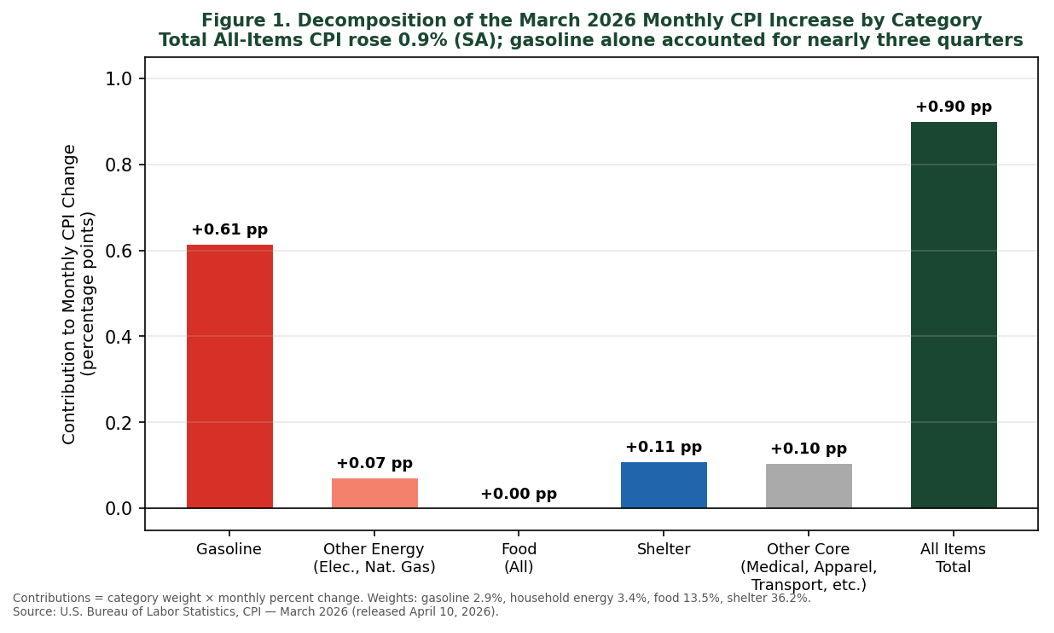
Contributions = category weight x monthly percent change. Weights: gasoline 2.9%, household energy 3.4%, food 13.5%, shelter 36.2%. Source: U.S. Bureau of Labor Statistics, CPI — March 2026 (released April 10, 2026)
Why Gasoline Was First: The Direct Price Channel
Gasoline is unique in the food and consumer price system because it has almost no supply chain lag. Crude oil prices are visible in real time; retail gasoline prices are posted at the pump and updated daily. When Brent crude surged from $71 per barrel on February 27 to $95 per barrel by March 6 and to $118 per barrel by March 18, retail gasoline prices followed within days — not months. The gasoline market is the one place where the Iran Conflict’s oil price shock passed through to consumers at close to full speed.
Figure 2
Brent Crude Oil and U.S. Retail Gasoline Prices, January-April 2026
Pump prices followed crude with roughly a one-week lag; 40% increase in six weeks
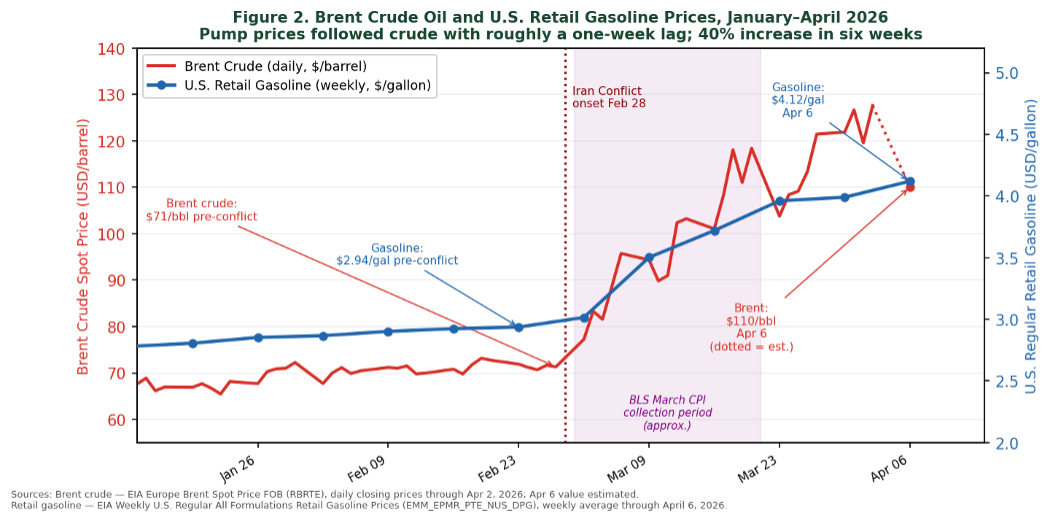
Sources: Brent crude — EIA Europe Brent Spot Price FOB (RBRTE), daily closing prices through Apr 2, 2026; Apr 6 value estimated.
Retail gasoline — EIA Weekly U.S. Regular All Formulations Retail Gasoline Prices (EMM_EPMR_PTE_NUS_DPG), weekly average through April 6, 2026
Every other category in the CPI involves a longer and more insulated transmission process. A food manufacturer buying grain, vegetable oil, and packaging has contracts that cushion against spot price moves for weeks or months. A grocery retailer sets prices on a quarterly or annual cycle for many staple items. A restaurant adjusts menu prices only when cost pressure becomes sustained and severe enough to justify the disruption. These institutional buffers are exactly what we described in our food price brief — and they are exactly why the March CPI shows the shock fully in energy but not yet in food or other goods.
Figure 3
Food-at-Home CPI Monthly Percent Change
Grocery Prices flat in March 2026 despite energy shock – supply chain lag at work
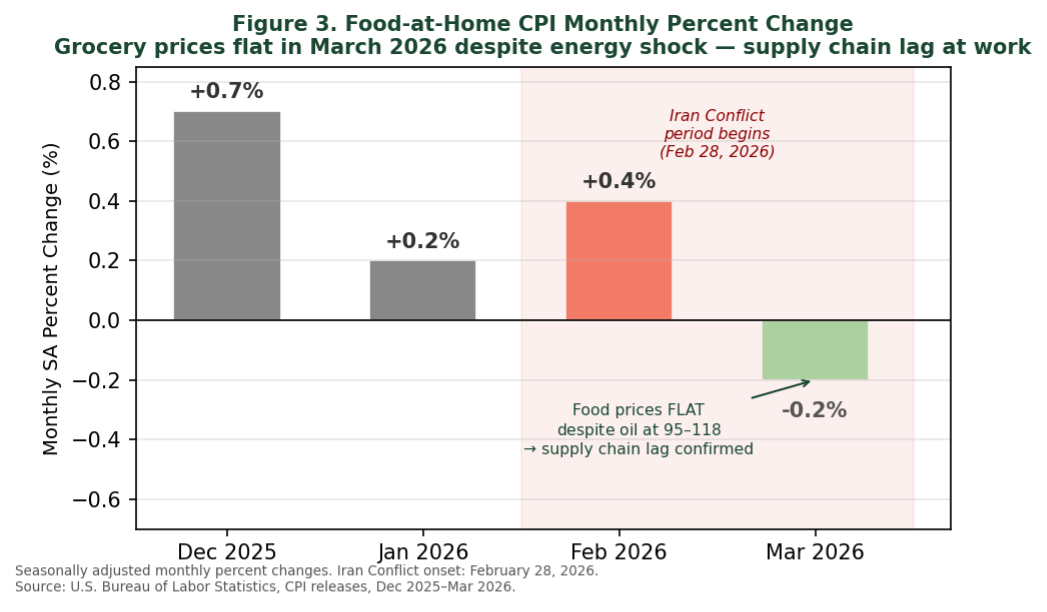
Seasonally adjusted monthly percent changes. Iran Conflict onset: February 28, 2026
Source: U.S. Bureau of Labor Statistics, CPI releases, Dec 2025-Mar 2026
Who Bears the Burden? The Regressive Nature of an Energy-Led Shock
Not all households experience the March CPI increase equally. An energy-led inflation shock of this kind is structurally regressive — meaning it falls more heavily on lower-income households as a share of their budget.
Gasoline expenditure as a share of household income declines as income rises. Lower-income households not only spend more of their budgets on gasoline in percentage terms, but they are also less able to absorb the shock through substitution: they are less likely to own fuel-efficient or electric vehicles, more likely to commute longer distances by necessity, and less able to adjust work schedules or consolidate trips. For a household in the lowest income quintile, a 21 percent increase in gasoline prices is a meaningful and immediate budget constraint. For a high-income household, it is much less so.
This distributional dimension will intensify as a sustained conflict’s cost pressure works through the supply chain into food and other goods. Lower-income households spend a substantially larger share of after-tax income on food — 25 to 35 percent for households in the lowest income quintile, compared to 7 to 10 percent for the highest. A broad energy-driven food inflation episode, therefore, compounds the gasoline burden that lower-income consumers are already absorbing. The March CPI data represent only the first — and most concentrated — wave of a price shock whose distributional consequences could broaden and deepen over the coming months.
The Inflation Pipeline: What Is Still Coming
The March report is a snapshot of the first month of the conflict’s CPI footprint. Understanding what comes next requires tracking the pipeline of cost increases that are now working their way through the supply chain toward retail prices.
The most immediate next channel is diesel fuel and transportation costs. While gasoline affects consumers directly at the pump, diesel powers the trucks, trains, and refrigerated containers that move nearly every product in the economy. Diesel prices typically lag gasoline by several weeks but follow the same crude oil trajectory. As diesel costs rise, freight rates increase — and those higher logistics costs begin embedding in the wholesale prices that manufacturers and retailers pay for delivered goods. This channel is already operating and will likely appear in the April and May CPI readings for a wide range of non-food goods.
Packaging costs represent the next wave. Petrochemical-based plastics, films, and containers are manufactured inputs whose prices are renegotiated on monthly or quarterly cycles. With crude oil above $100 per barrel for the entirety of March and possibly remaining high through April, packaging cost increases are now being quoted to food and consumer goods manufacturers. These will begin appearing in wholesale prices within sixty to ninety days and in retail prices within three to six months.
Specifically for food, the transmission follows the lag structure documented in an earlier brief. Farm input costs — fertilizer derived from natural gas, diesel for field operations — are rising and may affect decisions about input intensity for the 2026 crop. Wholesale food prices are beginning to reflect higher energy and transportation costs. The producer price index for processed foods and feeds — typically a two-to-four-month leading indicator for the retail food CPI — will be released on April 14th and will be the first systematic signal of how much food price pressure has built up in the wholesale pipeline during March.
The vegetable oil and biofuel channel noted in that brief is also now clearly active: soybean oil and related cooking oils face simultaneous demand pressure from both the Iran Conflict (rising crude makes biofuels competitive) and the recently finalized RFS volume expansion. This channel compounds the food price trajectory for oil-intensive processed foods, salad dressings, cooking oils, and food-service frying operations.
Core Inflation Is Stable — And Why That Matters
One significant finding in the March report deserves emphasis for both its economic and policy implications: core inflation — all items less food and energy — remained at 2.6 percent year-over-year and rose just 0.2 percent for the month. This is important because it indicates that the March CPI spike has not yet triggered the second-round inflation dynamics that economists most fear: broad-based shifts in expectations and generalized price increases disconnected from the original energy shock. A swift end to the conflict and return to status quo could forgo much of these effects.
Figure 4
Headline vs. Core CPI: 12-Month Percent Change, January 2024-March 2026
Core remained stable near 2.7% in March; headline jumped to 3.3%, driven by energy
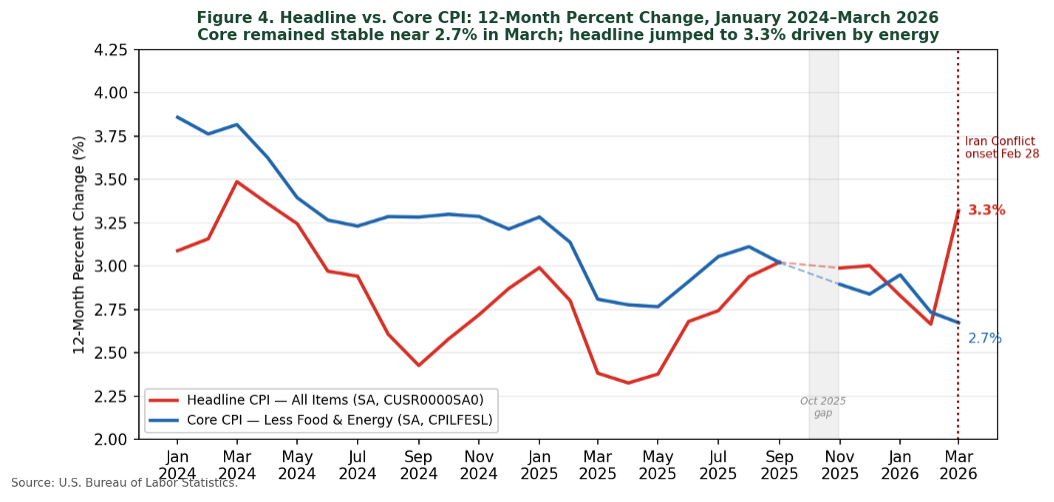
Source: U.S. Bureau of Labor Statistics
The Federal Reserve closely monitors both headline and core CPI as primary inputs to its interest rate decisions. Headline CPI captures the full consumer price experience, including the volatile food and energy components that often reflect temporary external shocks; core CPI is designed to filter out those transitory movements and reveal the underlying inflationary trend in the broader economy. The March data present the Fed with a classic tension: a very large headline number driven by a single external shock, alongside a stable core reading that suggests the broader economy has not yet internalized that shock into generalized inflation. How policymakers weigh these signals — and how the CPI readings evolve over the coming months — will be central to ongoing monetary policy deliberations.
An energy shock that passes through quickly and then dissipates need not trigger a monetary policy response if core inflation stays contained. An energy shock that persists long enough to embed in food prices and transportation costs presents a fundamentally different challenge. The March data indicate we are still in the first phase. Whether we remain there depends almost entirely on how long the Strait of Hormuz remains limited in commercial traffic flow — and that is why the monthly CPI release has become, alongside oil price movements, one of the most closely watched economic indicators in the current environment.
Three Indicators to Watch in the Coming Months
The Producer Price Index for processed foods and feeds (released April 14th) will be the earliest systematic signal of wholesale food price pressure emerging from the March energy shock. A significant increase — particularly in the processed foods category — would be the clearest early warning that food price inflation is moving through the pipeline toward retail shelves.
Retail gasoline prices over the next four to eight weeks are the key leading indicator for the next round of CPI energy pressure. Brent crude has continued rising through early April, with prices reaching $127.61 per barrel on April 2 but falling substantially with the ceasefire announcement last week. If crude stays above $100 through April, the May CPI energy reading will likely show continued pressure — and the risk that higher transportation and petrochemical costs begin embedding in other goods categories increases materially.
The monthly food-at-home CPI reading in the April and May reports will reveal how quickly the supply chain lag is compressing. If grocery prices show movement of 0.5 percent or more in April — an acceleration from March’s flat reading — it would suggest the pipeline is clearing faster than historical averages, potentially due to the breadth and severity of the current shock relative to past episodes.
The Bottom Line
The March 2026 CPI report confirms what the structural analysis predicted: the Iran Conflict’s initial consumer price impact is concentrated in motor fuels, which respond to crude oil prices with almost no lag. The 0.9 percent monthly CPI increase is large by recent standards — the largest monthly increase since mid-2022, but it is not yet the broad-based food and goods inflation that a prolonged Strait of Hormuz disruption will eventually produce.
The flat food price reading in March is a temporary buffer, not a signal of insulation. With Brent crude remaining around $100 per barrel and the Strait continuing to constrain tanker traffic, the supply chain is accumulating cost pressure that has not yet reached retail shelves. The March CPI release has moved to the center of the economic policy conversation precisely because it represents the leading edge of a much larger potential price shock still in transmission — one whose full consumer impact will unfold over the coming months in the food, transportation, and manufactured goods categories that were quiet in March but are unlikely to remain so.
References and Data Sources
U.S. Bureau of Labor Statistics. Consumer Price Index — March 2026. Released April 10, 2026. https://www.bls.gov/cpi/
U.S. Bureau of Labor Statistics. Consumer Price Index — February 2026. Released March 11, 2026. https://www.bls.gov/news.release/archives/cpi_03112026.htm
U.S. Energy Information Administration. Europe Brent Spot Price FOB (RBRTE). https://www.eia.gov/dnav/pet/hist/rbrteD.htm
Foster, K. and Dalheimer, B. (2026). “The Iran Conflict and Consumer Food Prices: A Broad but Lagged and Sticky Shock.” Purdue Agricultural Economics Policy Brief #2026-2. March 2026. https://ag.purdue.edu/commercialag/home/paer-article/the-iran-conflict-and-consumer-food-prices-a-broad-but-lagged-and-sticky-shock/
Foster, K. and Dalheimer, B. (2026). “The Iran Conflict, Energy Prices, and Farm Profitability: A Balanced Assessment.” Purdue Agricultural Economics Policy Brief #2026-1. March 2026. https://ag.purdue.edu/commercialag/home/paer-article/the-iran-conflict-energy-prices-and-u-s-farm-profitability-a-balanced-assessment
![]()
![]()
![]()
![]()
![]()