February 6, 2010
Carbon Dioxide Offsets from Anaerobic Digestion of Diary Waste
by Brent Gloy
![]()
![]()
![]()
![]()
![]()
Abstract:
Anaerobic digestion allows farmers to create renewable energy and significantly reduce manure methane emissions. Methane emission reductions have the potential to be an important source of carbon dioxide offsets under cap and trade climate legislation. Estimates of the aggregate supply curve for CO2e offsets were developed based upon dairy farm data collected by the USDA/ERS Agricultural Resource and Management Survey (ARMS). The results provide insight regarding the potential for methane emission reductions and renewable energy generation on U.S. dairy farms. Offset prices in excess of $15 per ton of carbon dioxide equivalent would be required to reduce methane emissions from manure storages by 50 percent from 2005 levels.
Anaerobic digestion (AD) is a well known technology that can be used to create renewable energy from livestock wastes. Beyond creating renewable energy, AD of livestock waste presents an opportunity to manage and reduce the amount of methane created by livestock waste storages. Methane is a potent greenhouse gas (GHG) with a global warming potential 21 times that of carbon dioxide and methane emitted from livestock waste storages is a significant source of anthropogenic methane emissions in the United States (U.S. EPA 2009).
In a report on U.S. GHG emissions, the U.S. EPA estimated that methane emissions associated with manure handling on dairy farms produced 18.1 Tg of carbon dioxide equivalent (CO2e) in 2007 (U.S. EPA, 2009). They also noted that methane emissions from dairy manure handling has increased by 60 percent since 1990 as dairy production shifted to larger farms that tend to store manure under anaerobic conditions and regulations encouraged smaller farms to store manure for more timely application to cropland. In total, manure management accounted for approximately 10 percent of the agricultural sector’s total GHG emissions on a CO2e basis. Of methane emissions associated with manure, dairy farms accounted for slightly over 40 percent of the emissions. As a result, activities that reduce dairy farm manure methane emissions have the potential to significantly reduce agricultural GHG emissions.
There are a variety of reasons that AD systems have not become standard on U.S. livestock operations, but chief among them is that the cost savings and/or revenues generated by the system’s energy production are not generally large enough to overcome the capital and operating costs associated with the systems. There is currently significant interest in activities that reduce the amount of GHGs emitted to the atmosphere, a benefit created by AD systems that, at present, is only priced in voluntary carbon markets such as the Chicago Climate Exchange (CCX).
In the United States legislators have begun debate on implementing a cap and trade system that would regulate GHG emissions for the energy production sector of the economy. Under a cap and trade system, regulated sectors would be required to reduce their GHG emissions and/or procure carbon dioxide offsets from activities that result in GHG reductions or carbon sequestration. The establishment of a cap and trade system to regulate GHG emissions in the U.S. would potentially create a market for the GHG reductions associated with AD systems. However, it is not generally known how the establishment of a market for CO2 offsets would influence adoption of AD systems.
Methane destruction through implementation of technologies such as AD adoption represents a potentially important source of carbon dioxide (CO2) offsets under cap and trade legislation. In this case, offsets would be awarded for destroying methane that would normally be released to the atmosphere. Methane destruction associated with AD installation would likely qualify as on offset, in part, because AD systems are not standard practices on livestock operations, thus satisfying the principle of additionality (US-EPA 2008).
The implementation of a cap and trade policy for the energy production sector will result in increased energy costs to consumers, either through requiring utilities to shift energy production away from low-cost fossil fuels or by paying entities to undertake GHG reducing activities (offsets) that would not be undertaken in the absence of the policy. As a result, the ultimate cost of a cap and trade policy is dependent, in part, upon the cost of supplying carbon dioxide offsets to the cap and trade system. This makes analysis of the potential supply of CO2 offsets from AD systems important for at least two reasons. First, the agricultural sector is viewed as an important supplier of CO2 offsets to a cap a trade system. The ultimate cost to deliver these offsets to the market will help determine the short-run price that society will face to implement a cap and trade system. If a large supply of carbon dioxide offsets is available at a low price, regulated sectors will be able to purchase offsets at a low price and energy price increases should be modest. However, if high offset prices are required to encourage offset production, energy prices would be expected to rise accordingly.
Second, the ability of the agricultural sector to supply CO2 offsets will play a key role in determining how the sector fares under cap and trade regulations. Because a cap and trade system would make energy more expensive, agricultural producers would face higher energy costs which would increase the cost of producing agricultural products and making them worse off in the short-run. To the extent that the sector can provide enough offsets to compensate for the increased energy costs that they face, they have the potential to be better off under a cap and trade system targeted toward GHG emissions. Of course, the long-run impacts of such a policy are quite difficult to predict because it is unclear how climate change would impact agricultural operations and whether the implementation of a policy in the U.S. would influence climate change.
This article examines the potential supply of carbon offsets associated with the destruction of methane emitted from manure storages on U.S. dairy farms. In doing so, a supply curve is developed that demonstrates how the supply of carbon dioxide offsets from this practice would be influenced by offset prices.
Anaerobic Digestion
Anaerobic digestion is a natural biological process in which bacteria convert organic materials to a compound commonly known as biogas. The primary constituent of biogas is methane which accounts for anywhere from 55 to 65 percent of biogas produced by an AD system. The methane in biogas can easily be converted to energy, typically by combustion in an electrical generator. A thorough discussion of the biological and technical details of the AD process are beyond the scope of this paper and interested readers can consult a variety of resources dedicated to these issues such as Lusk (1998) and Wright (2001).
Dairy farms are attractive candidates for installation of livestock manure based AD systems because many farms produce significant amounts of waste and store the waste in anaerobic conditions suitable for processing with AD. In fact, although the EPA reports that there were approximately 100 operating AD systems in 2005, most existed on dairy operations (US-EPA 2006). Additionally, the EPA has estimated that up to 2,600 AD systems are feasible on U.S. dairy farms and that if they were installed on these farms they would reduce GHG emissions by 572 thousand metric tons (MT) of methane or 12 million MT of CO2e (US-EPA 2006).
Carbon Offsets from AD
A variety of agricultural practices might qualify to provide offsets to a cap and trade scheme. These include practices such as destroying the methane normally emitted by livestock manure storages, using no-till to increase the carbon flux in soils, forest management practices designed to increase carbon flux in existing forests, and establishing new forests. The logic for paying entities to produce offsets is governed in part by the principles that the process used to create the offset results in emission reductions that are real, additional, permanent, and verifiable (US-EPA, 2008).
Although all of these principles have implications for modeling the potential supply of offsets, the requirement that offsets be additional makes it difficult to estimate the potential supply of offsets. The principle that offsets be additional requires that offsets only be awarded for activities that would are normally undertaken. Unfortunately, this means that there is little data available with which to estimate the costs of adopting the offset producing practices. In estimating the supply of offsets from methane destruction from AD systems it is important to only award credits for methane that would normally be emitted from the manure storage. Because many AD systems are designed to maximize methane production from manure storage, the credits will generally be less than the total amount of methane produced by the AD system. Instead, credits are awarded relative to the manure methane baseline of the livestock operation.
Agriculture and Cap and Trade
The U.S. Congress is currently considering legislation that would place a cap on GHG emissions and would allow trading of offsets from activities that reduce GHG emissions. The EPA’s analysis of House version of the cap and trade legislation notes that the bill would allow for up to 2 billion MT of offsets to be supplied to the scheme (US-EPA 2009b). They estimate that these offsets would trade at a price of $13 per MT of CO2e. Outlaw et al., (2009) analyzed how the legislation would impact agricultural producers. They note that the ability to supply offsets to the program ultimately determines whether producers are better off under the regulation in the short-term.
While it is clear that a cap and trade system with offset trading would make offset production valuable, the potential supply curve for these offsets is poorly understood. In order to shed light on this issue, this article develops an economic model to derive the supply curve for CO2e offsets from AD system installation on U.S. dairy farms.
AD Economics
Several studies have analyzed the economics of AD systems on dairy farms (Leuer, Hyde, and Richard 2008; Stokes, Rajagopalan, and Stefanou 2008; Enahoro and Gloy 2008, Bishop and Shumway 2009; Lazrus and Rudstrom 2007). In general, these studies have focused on developing capital budgeting models to explain the net present value of AD system installations. This approach is appropriate because AD systems require significant capital outlays that will be recovered over time. In all cases, these studies have focused on electrical production as the output of the system. The revenues associated with the system are savings on electricity that would otherwise be purchased and/or sales of electricity to the electrical grid. The costs of the system are capital costs and the variable costs of operating the system. Additionally, the profit equation can be modified to include the sale of CO2e offsets produced by combusting methane that would otherwise be emitted from the farm’s anaerobic manure storage.
Specifically, the profit maximization problem facing the producer is described in (1).
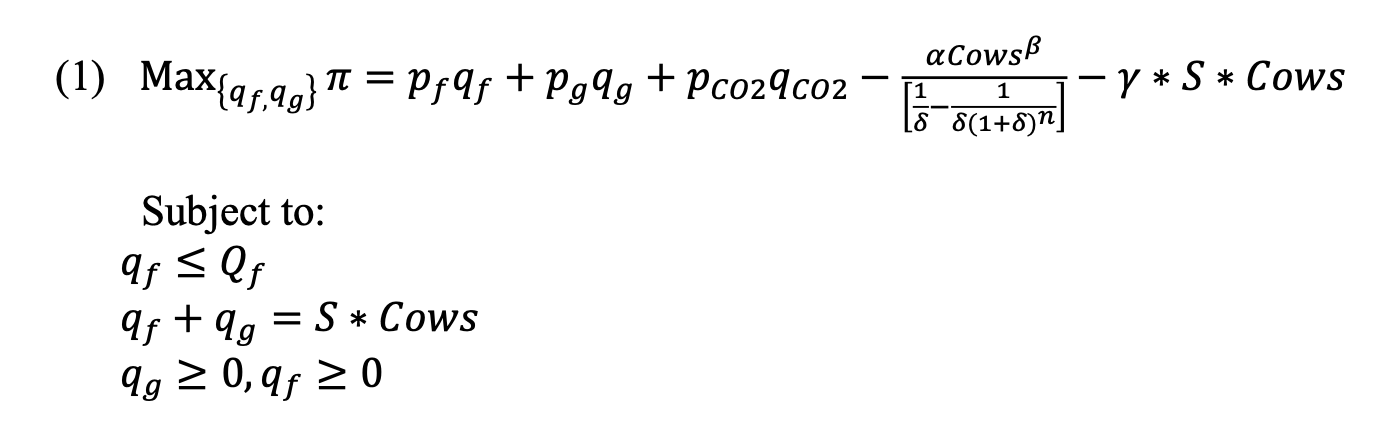
Here, pf is the price that the farm pays for electricity ($’s/kWh), qf is the quantity of AD produced electricity that the farm uses (kWh), pg is the price of electricity sold to the electrical grid ($’s/kWh), qg is the quantity of electricity that the farm sells to the grid (kWh), pco2 is the price of CO2e offsets ($’s/Mt), and qCO2 is the quantity of CO2e offsets produced by the system (Mt). The total investment required for a farm to install an AD system is determined by the number of cows milked on the farm (Cows) and the investment cost parameters, α and β. The investment is annualized by dividing by annuity factor which is dependent upon the discount rate δ and the expected life of the AD system n (years). The variable operating costs of the system are given by the cost of generating a kWh (γ) and are multiplied by the annual electrical output per cow (S) and the herd size (Cows). The constraints require that the farm cannot sell more electricity to itself than it demands (Qf), total electrical sales are equal to production, and electrical sales are non-negative.
The farm then determines the amount of electricity that it sells on the grid and to itself. If grid prices are less than the variable costs of production, the farm will not sell any electricity to the grid. If grid prices are higher than the farm price for electricity, the farm will sell all of its electricity to the grid, and when farm prices are higher than grid prices the farm first offsets electrical purchases and then sells excess electricity to the grid.
Data
The model in (1) is used to estimate the price of CO2e offsets that makes the annualized profit of the AD system break-even. The data used to estimate the model were collected from the 2005 special dairy costs and returns survey of the USDA/ERS Agricultural Resource Management Survey (ARMS) version 4. The sample for the ARMS survey is developed from a complex survey sampling methodology designed to produce estimates that are statistically representative of the population of U.S. dairy farms that milk more than 10 cows in 24 important U.S. dairy states 1. The ARMS survey is administered by paid, professional enumerators. For the 2005 dairy costs and returns study, a total of 1,815 questionnaires were completed. Details of the survey and the methodology used to develop and collect results are available at http://www.ers.usda.gov/data/arms/.
The ARMS 2005 dairy costs and returns report questionnaire contained a large number of questions about the characteristics and financial condition of U.S. dairy farms. The survey included a series of questions about the manure handling systems present on dairy farms and questions related to energy consumption and use. The data in the ARMS survey were supplemented with a variety of data sources in order to develop the parameters necessary to estimate the model in (1). These data sources included estimates of the state level prices of electricity from the Energy Information Agency and estimates of methane production from anaerobic manure storages for dairy farms from the Chicago Climate Exchange (CCX).
Electrical Production and Revenues
In nearly all operating U.S. digester systems, the methane produced by the system is used to run an electrical engine generator. A variety of factors can potentially impact the amount of electricity produced per cow per year, S. These include factors such as type of AD process used, the biogas yield of the system, the methane content of the biogas, the amount of volatile solids in the manure, and the quantity of manure handled by the system. Previous studies have used a variety of estimates for the magnitude of S with most falling between 1,000 and 1,400 kWh per cow per year (Table 1). In this study the value of S is initially set to 1,100 kWh per cow per year.
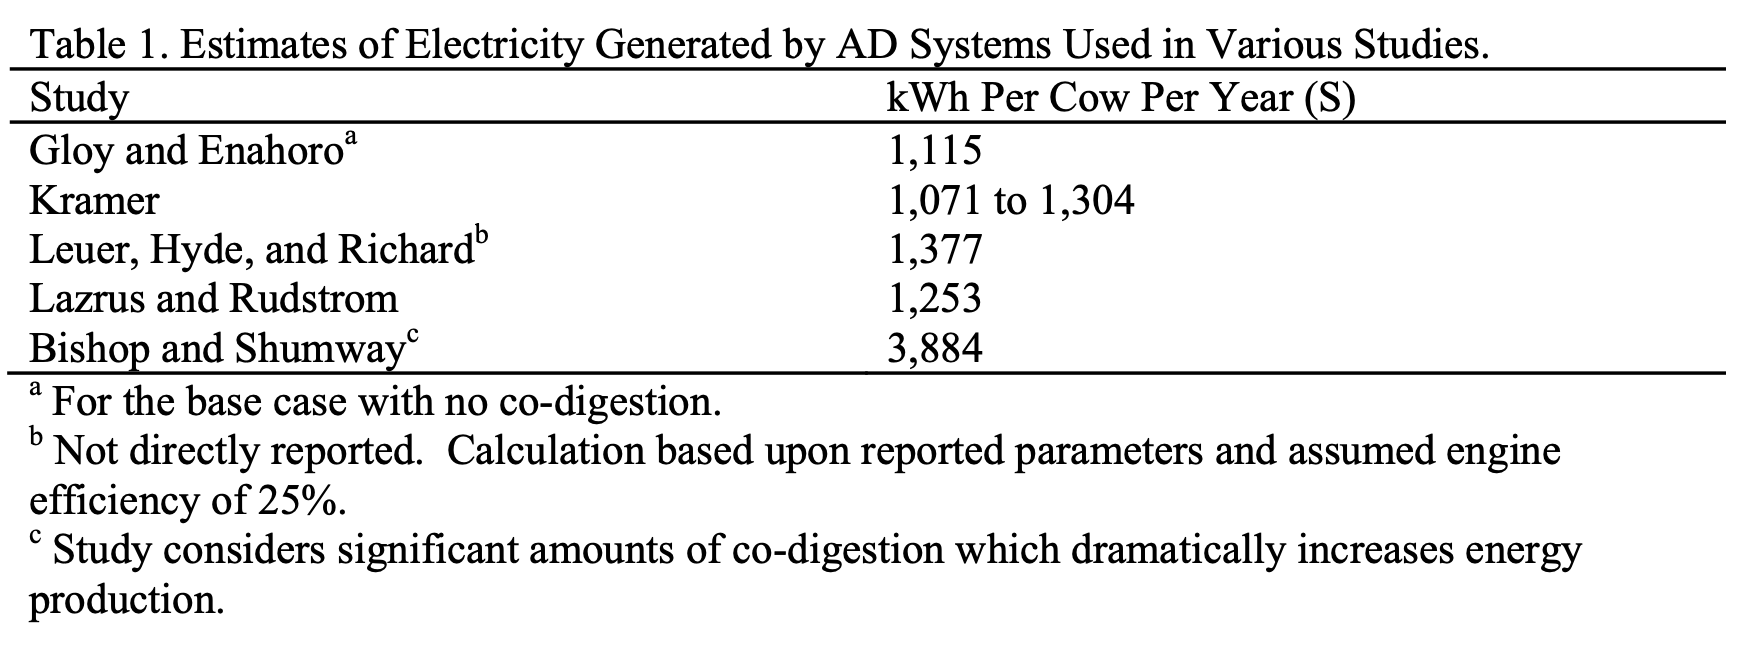
Table 1. Estimates of Electricity Generated by AD Systems Used in Various Studies.
The estimated electrical output of the system (S) was used in conjunction with electrical prices faced by the farms in order to determine the potential cost savings/electrical revenues generated by the AD system. The electrical price faced by a farm (pf) was taken from the Energy Information Administration (2007) data on the state level commercial price of electricity for 2005. Thus, all farms in a state are assumed to face the same farm level electrical prices. The electrical price data were also used with the electrical expenditure data in ARMS to estimate the total quantity of electricity consumed by the dairy farm (Qf).
The total energy usage and associated CO2 emissions for each source of energy were estimated for each farm in the ARMS data set (Table 2). The estimates of the quantities for each energy source were obtained by dividing ARMS farm level expenditure data by regional level estimates of 2005 diesel, gasoline, and LP gas prices from the National Agricultural Statistics Service (NASS) and state level electrical and natural gas prices from the Energy Information Administration (EIA) 2. The CO2e emissions for each fuel source were obtained by multiplying the quantities consumed by the associated CO2 emission factors from the EIA (2010). Emissions associated with electricity were based upon state level electrical emission factors from the EIA (2002).
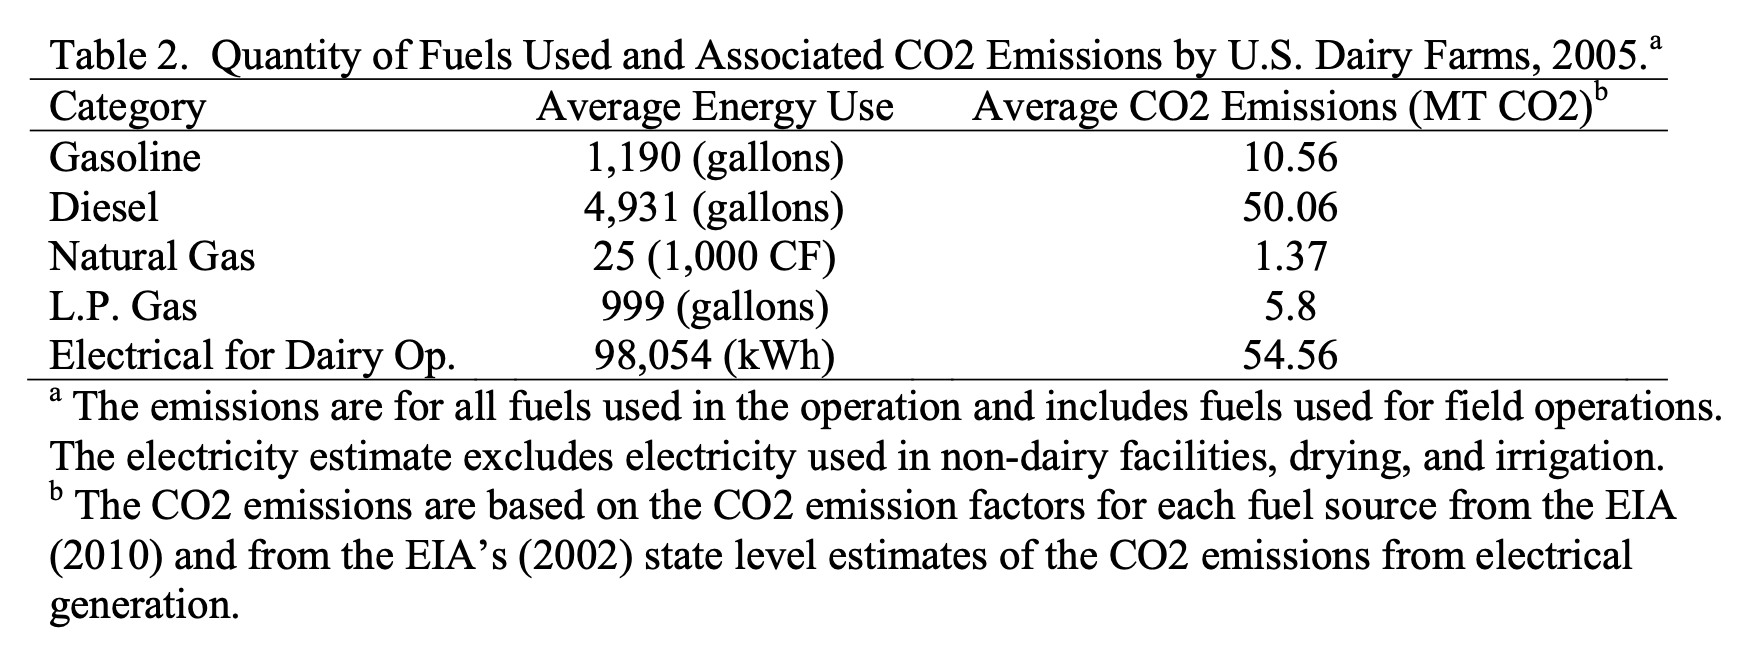
Table 2. Quantity of Fuels Used and Associated CO2 Emissions by U.S. Dairy Farms, 2005.
The largest use of fuel is for diesel which produces CO2 emissions of 50.06 MT for the average dairy farm. However, this value is highly variable and dependent upon farm size and the extent to which the farm engages in field cropping operations. For an average farm, the CO2 emissions from diesel fuel were slightly less than those associated with the electricity use (55 MT). The average farm in the data set utilizes 98,054 kWh of electricity in their dairy operation. The installation of an engine generator along with an AD system allows the farm to potentially reduce their purchases of electricity. Although some farms also have significant electrical demands for irrigation, drying, or other types of livestock facilities, the parameter Qf was set to the amount of electricity used in the dairy enterprise. This parameter is important to the economics of an AD system because it determines the amount of AD produced electricity that can be used to offset retail electricity purchases. The retail electrical price faced by each farm determines the parameter, pf.
The electrical price received by selling to the electrical grid (pg) is situation specific. In some states net metering allows for the sale of electricity to the grid at the utility’s avoided cost of generation. In others, sale to the grid may not be allowed at all or is severely limited. Some farms have been able to negotiate the sale of renewable energy certificates that provide a price supplement for electricity generated from biogas. As a result of the wide disparity in electrical prices received for AD generated electricity, several scenarios are considered for pricing electricity sold to the grid. These scenarios include no sales to the grid, sales at a price of $0.05 per kWh, sales to the grid at the farm price, and sales at $0.12 per kWh. The base scenario assumes that grid sales occur at $0.05 per kWh, which is meant to reflect selling at the utility’s avoided cost of generation plus a premium for renewable or green energy.
CO2e Offset Revenues
Calculation of the potential revenue from sale of carbon offsets requires estimation of methane emissions from manure storage on each farm. When determining the amount CO2e tons of methane destroyed by an AD system, it is critical that offsets are awarded only for methane that would otherwise have been emitted, not the total amount of methane destroyed by the AD system. As a result, all carbon offsets for manure methane destruction are awarded relative to the baseline emissions of the agricultural operation under consideration.
Manure handling systems that store manure in anaerobic conditions create significant amounts of methane. The actual amount of methane that the operation emits from its manure storage is dependent upon a variety of factors, but among the most important are the type of storage system and the geographic location of the farm. For example, farms located in warmer climates and whose conditions encourage the growth of the methanogenic bacteria generate more methane than those in cold climates. Manure that is not stored in anaerobic conditions generates negligible amounts of methane.
Currently, there is no formally regulated market for carbon offsets in the United States. However, the Chicago Climate Exchange (CCX) operates a voluntary marketplace where firms and individuals that wish to offset or reduce their greenhouse gas emissions can buy and sell carbon credits. The calculation of CO2e offsets for each farm in this article relies upon the CCX baseline methane emission protocols for agricultural manure methane destruction (Chicago Climate Exchange 2009).
Specifically, the methane emissions from U.S. dairy farms were estimated based upon the methane emission coefficients used by the CCX (2009). These coefficients provide an estimate of the methane generated by a dairy cow based upon the location of the farm and whether the farm used an anaerobic lagoon or a liquid slurry system 3. The type of manure storage used on the farm was identified based upon responses to the manure management section of the ARMS survey. The nine types of manure storages listed on the ARMS questionnaire were aggregated into 4 categories of manure storage (anaerobic lagoon, pit/slurry, shed/slab, or no storage). Farms that did not store manure in either an anaerobic lagoon or liquid slurry were assumed to generate no methane emissions from manure management. Table 3 shows the distribution of manure storage systems used on U.S. dairy farms.
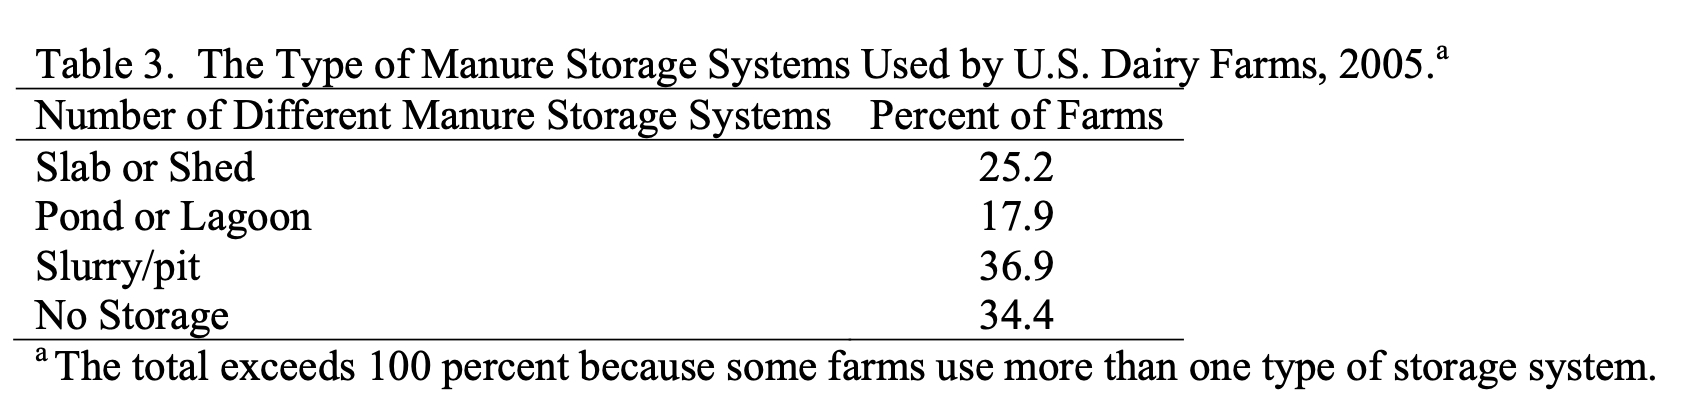
Table 3. The Type of Manure Storage Systems Used by U.S. Dairy Farms, 2005.
According to their responses to the ARMS survey, a slight majority of U.S. dairy farms store manure in an aerobic conditions.4 Those that store manure in lagoons generally emit greater amounts of methane than those that utilize slurry/pit storage systems. Farms that did not utilize manure storage or those that utilized slabs or sheds for storage were considered to create negligible manure methane emissions for purposes of this article.
After determining the type of manure storage system and the herd size of the farm, it was possible to estimate the CO2e methane emissions from manure storage for each farm (Table 4). Based upon the manure storage structures present on the farm, approximately half of the dairy farms generate methane emissions from manure storages. Considering all farms, including those with no estimated methane emissions from manure storages, the average dairy farm in the U.S. generates 424 MT of CO2e methane emissions from their manure storage. Considering only farms that generate emissions, the average CO2e manure methane emission climbs to 844 MT per farm. For farms with manure emissions, each hundred weight of milk production produces roughly 0.0178 MT of CO2e manure methane emissions. As one can see, the typical farm with manure methane emissions is larger than average and has a higher than average rate of milk production per cow per year.
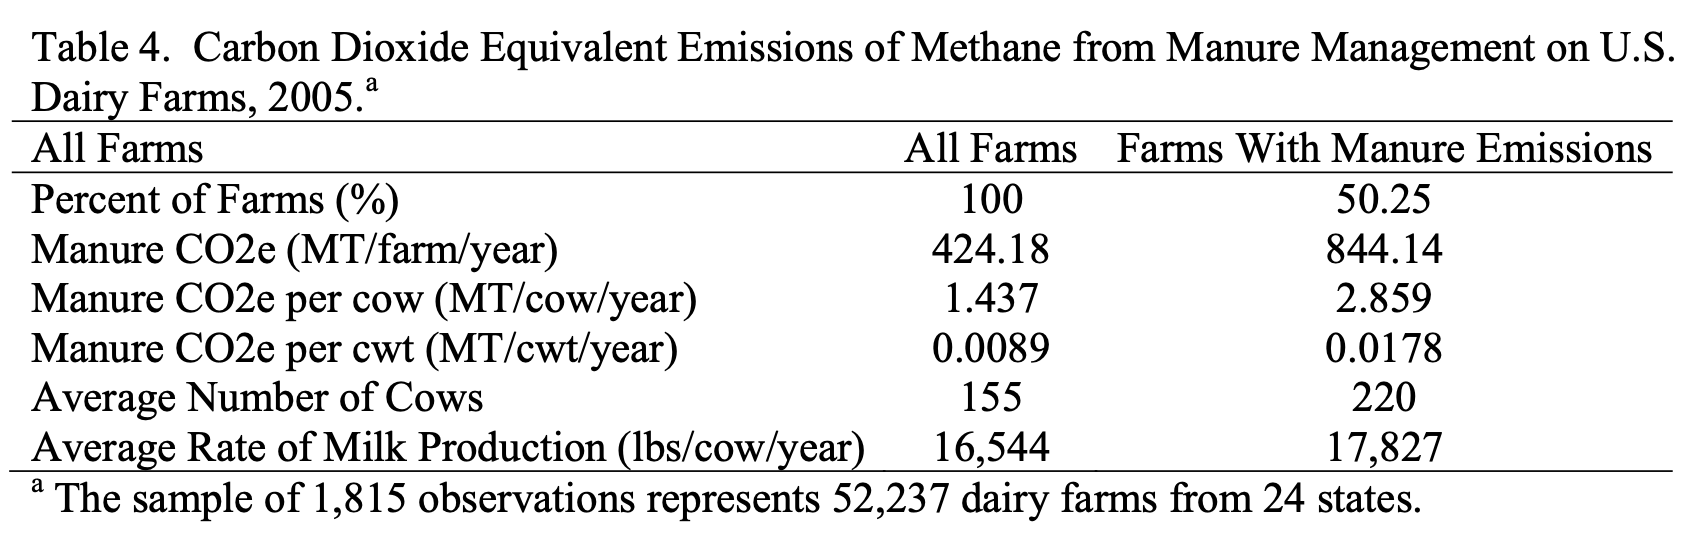
Table 4. Carbon Dioxide Equivalent Emissions of Methane from Manure Management on U.S.
Capital Costs
Capital costs account for a significant portion of AD system costs. Previous AD studies typically report estimates of the average investment cost for an AD system installed on a farm of a given size. For instance, Enahoro and Gloy (2008) examine installation of an AD system on a 1,000 cow New York dairy farm and use studies from the Cornell Manure Management Program to estimate capital expenses at $940 per cow. They also note that the US-EPA’s FarmWare AD evaluation tool produces a capital expense estimate for the same system of $788 per cow. Lazrus and Rudstrom (2007) estimate capital costs at roughly $530 per cow for an 800 cow farm in Minnesota. Leuer, Hyde and Richard (2008) estimate capital costs at $1,608 and $887 per cow for 500 and 2,000 cow installations respectively.
Recently, the US EPA (2009c) estimated an investment cost function similar to the capital cost component of (1) for 10 complete mix and 16 plug flow digester systems. Their parameter estimates place the α parameter at $12,331for a complete mix system and $12,960 for a plug flow system. The estimates of β were 0.638 and 0.668 for the complete mix and plug flow systems respectively. Using capital cost and farm size data reported by Gooch and Pronto for 10 operating digester systems one would obtain estimates of α = $7,987 and β = 0.725.
Clearly, the amount of publically available data on AD system capital costs is limited, making it difficult to precisely estimate the capital costs associated with AD systems. However, several conclusions emerge from previously published studies of AD systems. First, it is clear that the total investment costs for AD systems are substantial. Second, the average investment per animal can vary considerably from installation to installation, driven in part by differences in herd size. For example, Kramer (2004) reports average investments per cow ranging from $417 to $763 per cow. Third, most studies find that the average AD investment cost per animal tends to decline as herd size increases. Based on these conclusions and the previously estimated investment cost functions, the base parameters for the investment cost component of (1) were set to α = $10,000 and β = 0.70. The life of the digester (n) is assumed to be 20 years and the discount rate, δ, is set to 5 percent in the base case.
Operating Costs
The variable costs of operating the digester system (γ) include maintenance and repairs to the system, energy required to run the digester system, labor, etc. Previous AD studies have reported these costs in gross amounts (Enahoro and Gloy 2008; Bishop and Shumway 2009; Stokes, Rajagopalan, and Stefanou 2008), as a percentage of capital costs (US-EPA; Stokes, Rajagopalan, and Stefanou 2008), as an average cost per kWh produced by the digester system (Leuer, Hyde, and Richard 2008; Lazrus and Rudstrom 2007), or in some combination (Table 5).
The average cost of generation for these studies ranged from $0.0685 per kWh to $0.015 per kWh. The baseline analysis assumes a value of $0.035 for γ.
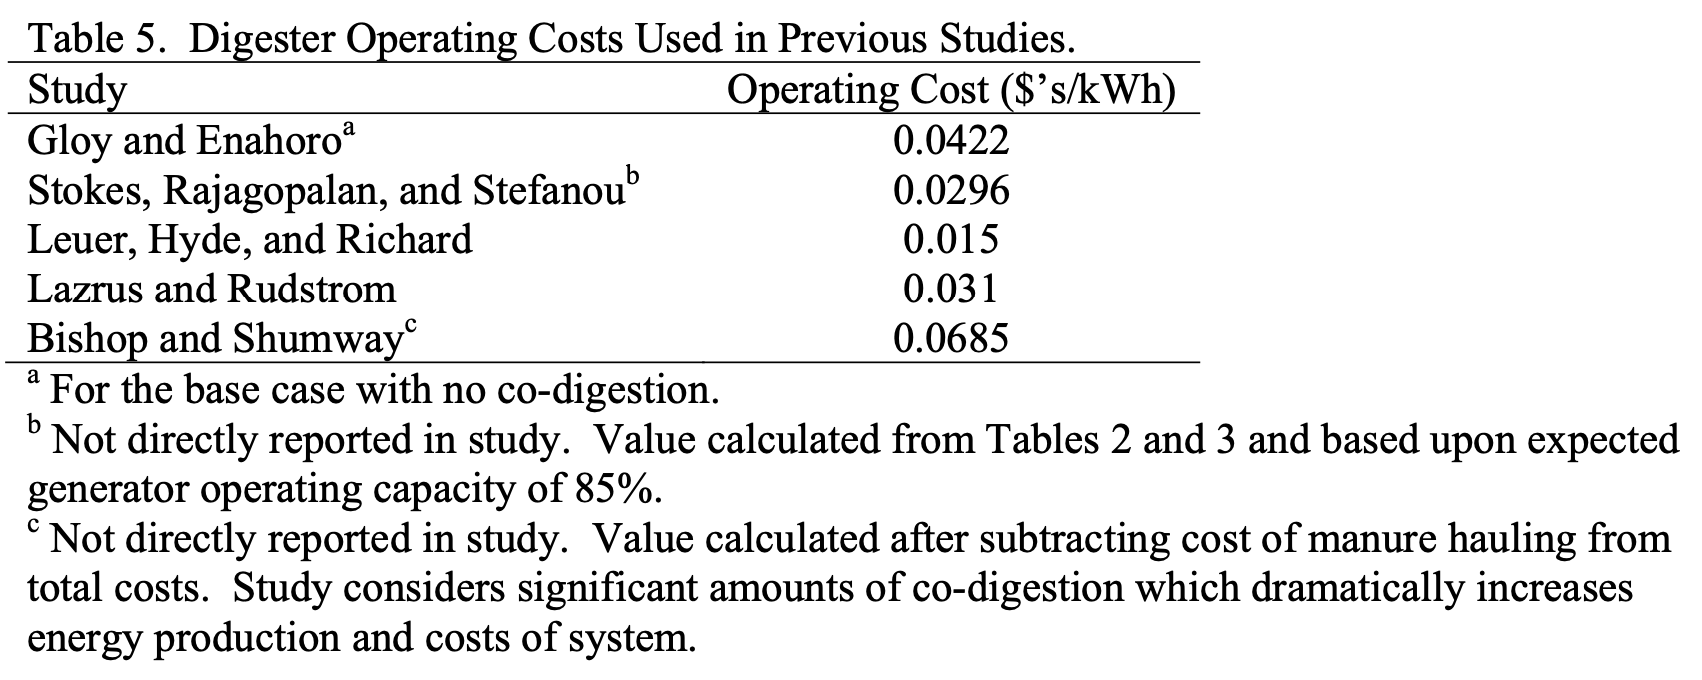
Table 5. Digester Operating Costs Used in Previous Studies.
Summary of Base Scenario Parameter Values
The profitability of an AD system for a dairy operation was evaluated using the model in (1). Given the parameters specified in Table 6, the herd size of the farm, the farm’s current electrical usage, the manure handling practice used by the farm, and the price paid for electricity, it is possible to solve (1) for the break-even price of CO2e offsets for each dairy farm. Once the break-even CO2e offset price is determined for each farm, it is possible to develop the aggregate supply curve for CO2e offsets by calculating the total quantity of CO2e offsets supplied at various price levels.
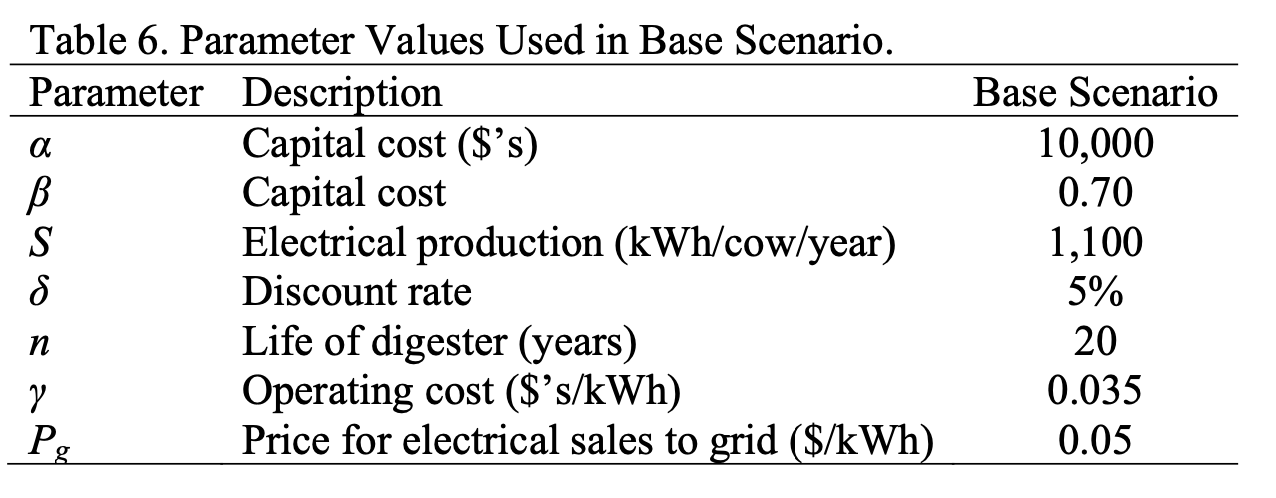
Table 6. Parameter Values Used in Base Scenario. Parameter Description
The Supply of CO2 Offsets from AD Adoption
Based on the number of farms that store manure in anaerobic conditions and the number of animals present on these farms, the maximum annual potential supply of CO2e offsets produced by AD systems is approximately 22.16 million MTs of CO2e.5 This estimate would suggest that the methane emissions from U.S. dairy farms is higher than that estimated by the EPA (2009) which placed total dairy manure methane emissions at 18.1 million MT of CO2e.6 While this value represents the theoretical maximum reduction in GHG emissions from AD adoption, it is clear that the economics of AD systems would have to improve in order to capture even a small portion of these offsets. There are several factors that influence the amount of offsets that would be provided by AD installation. These factors include the capital cost of the system, the operating costs of the system, and the energy sales of the system.
The supply curve for offsets under the base scenario is shown in Figure 1. Under the base scenario the model predicts that a modest amount of offsets would be provided when offsets have no value. The curve is clearly non-linear and relatively large gains in offset supply are achieved as CO2 offset prices increase from $0 to $20 per MT. At a price of $20 per MT, offsets would be produced by destroying approximately 60 percent (13 million MTs) of the methane normally emitted from manure storages.
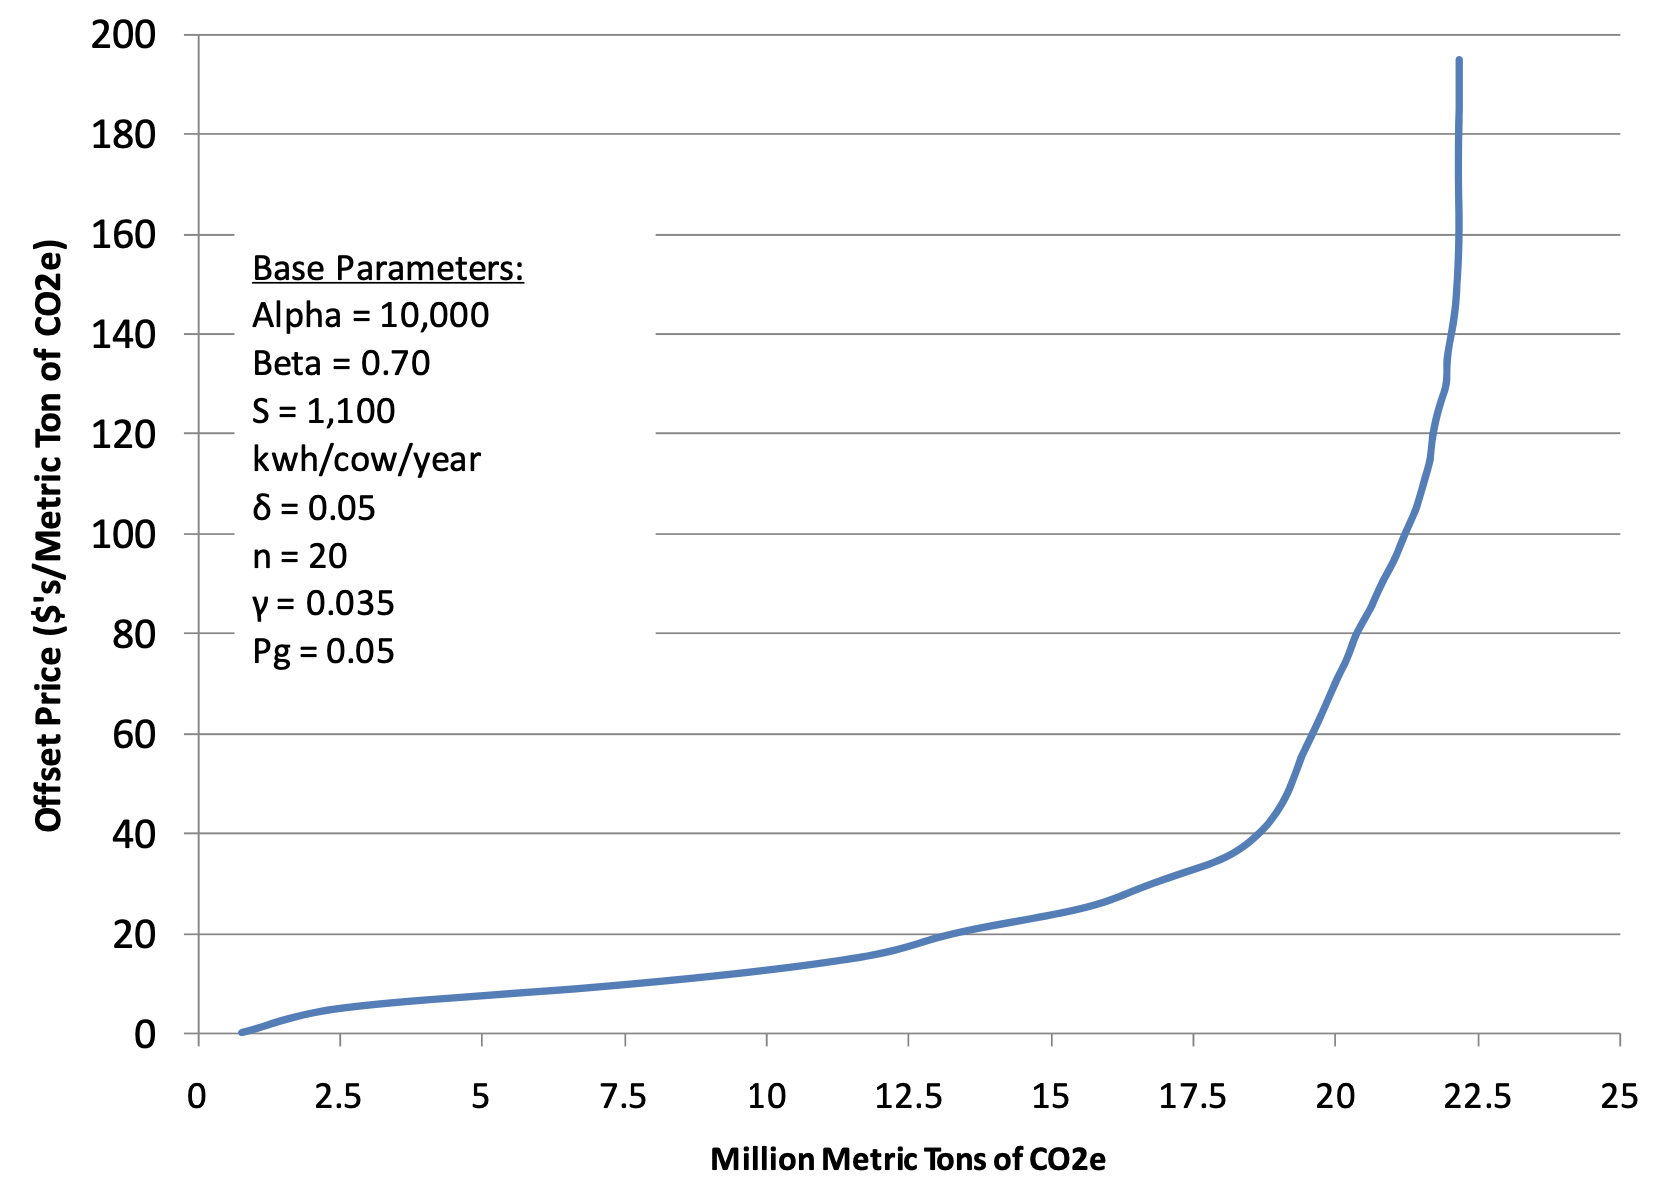
Figure 1. Supply of CO2 Offsets from Anaerobic Digestion on U.S. Dairy Farms, Million Metric Tons of C02e
More detail on the amounts of offsets provided at various price levels and the impact of changes to the capital cost parameters on offset supply is provided in Table 7. Here, the price per MT of CO2e offsets produced by the system is shown in the first column and the aggregate amount of the offsets supplied at that price is shown in the subsequent columns. The first scenario shown is the base case, and then each successive column illustrates how the aggregate supply would change if one of the parameters used to derive the capital costs of the AD system is altered. Under the base scenario, a modest amount of CO2e offsets (0.77 million MT) are provided when the offsets have no value. At a price of $15 per MT, 11.59 million MT would be supplied resulting in 48 percent decrease in the CO2e emissions associated with manure management in the dairy sector. Under the base parameter assumptions, CO2e offset prices in excess of $100 per MT are required to bring all of the potential offsets to the market.
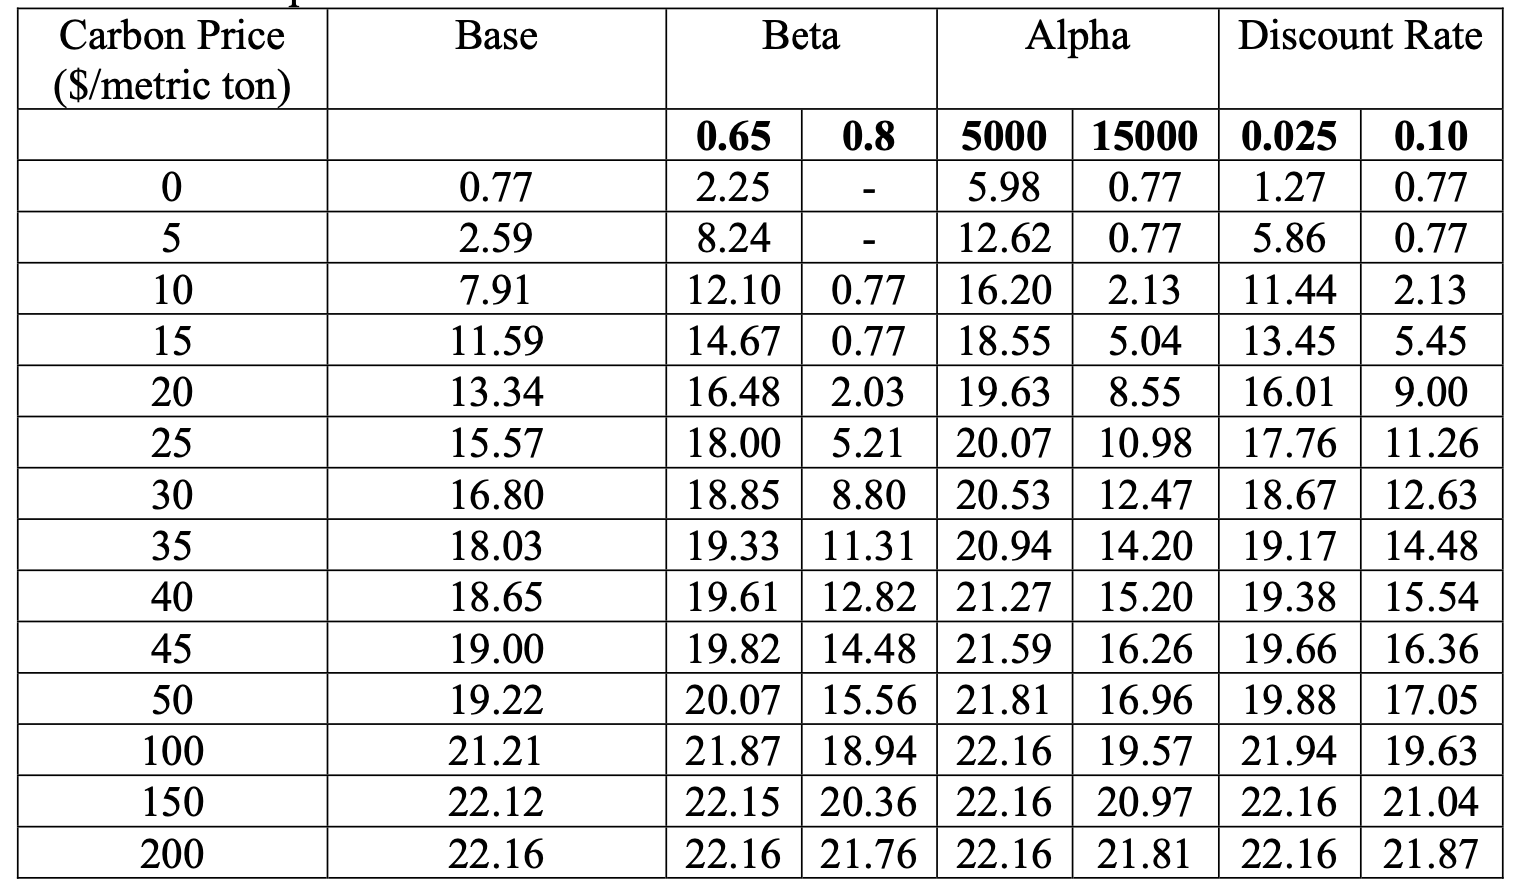
Table 7. Supply of CO2e Offsets (Million Metric Tons of CO2e) from AD under the Base and Alternative Capital Cost Scenarios.
AD systems are capital intensive and Table 7 highlights the important role that capital costs play in determining the amount of offsets that would be brought to market. As the investment cost parameters α and β decrease, the capital costs associated with an AD system decline and the amount of offsets brought to the market increases. Changes in α result in a proportional reduction in the initial investment cost. For example, reducing α from 10,000 to 5,000 would decrease the initial capital investment by half. Because changes to β cause the average investment cost per cow to decline more or less rapidly, adjustments to this parameter tend to impact the adoption decision of large farms more than small farms. If the scale parameter were increased to 0.8, the amount of offsets supplied at a price of $15 per ton would fall by 93 percent from the base case. Likewise, the discount rate used to determine the annual capital costs of the digester system also has a substantial impact on the amount of offsets supplied. Given the importance of these parameters and the wide disparity in the values reported in the literature, it is clear that more work is needed to better understand the capital costs associated with these systems and how they can be reduced if a goal is to achieve methane emission reductions through AD installation.
The profitability of AD systems is also influenced by the amount of energy that the system produces and the costs of operating the systems (Table 8). Under the base scenario, energy production by the AD system was estimated at 1,100 kWh per cow per year. As opposed to the base scenario, increasing the energy production by 36 percent (to 1,500 kWh per cow per year) would result in only a 4 percent increase in offset supply at a price of $15 per ton. Reliable operating cost data for existing digesters is difficult to obtain, but given that costs stay within $0.045 cents per kWh or lower, these costs tend to have a small impact on the amount of offsets that would be supplied at prices above $15 per ton. In fact, both energy production and operating costs within the ranges examined below have relatively modest impacts on adoption at offset prices above $15 per MT.
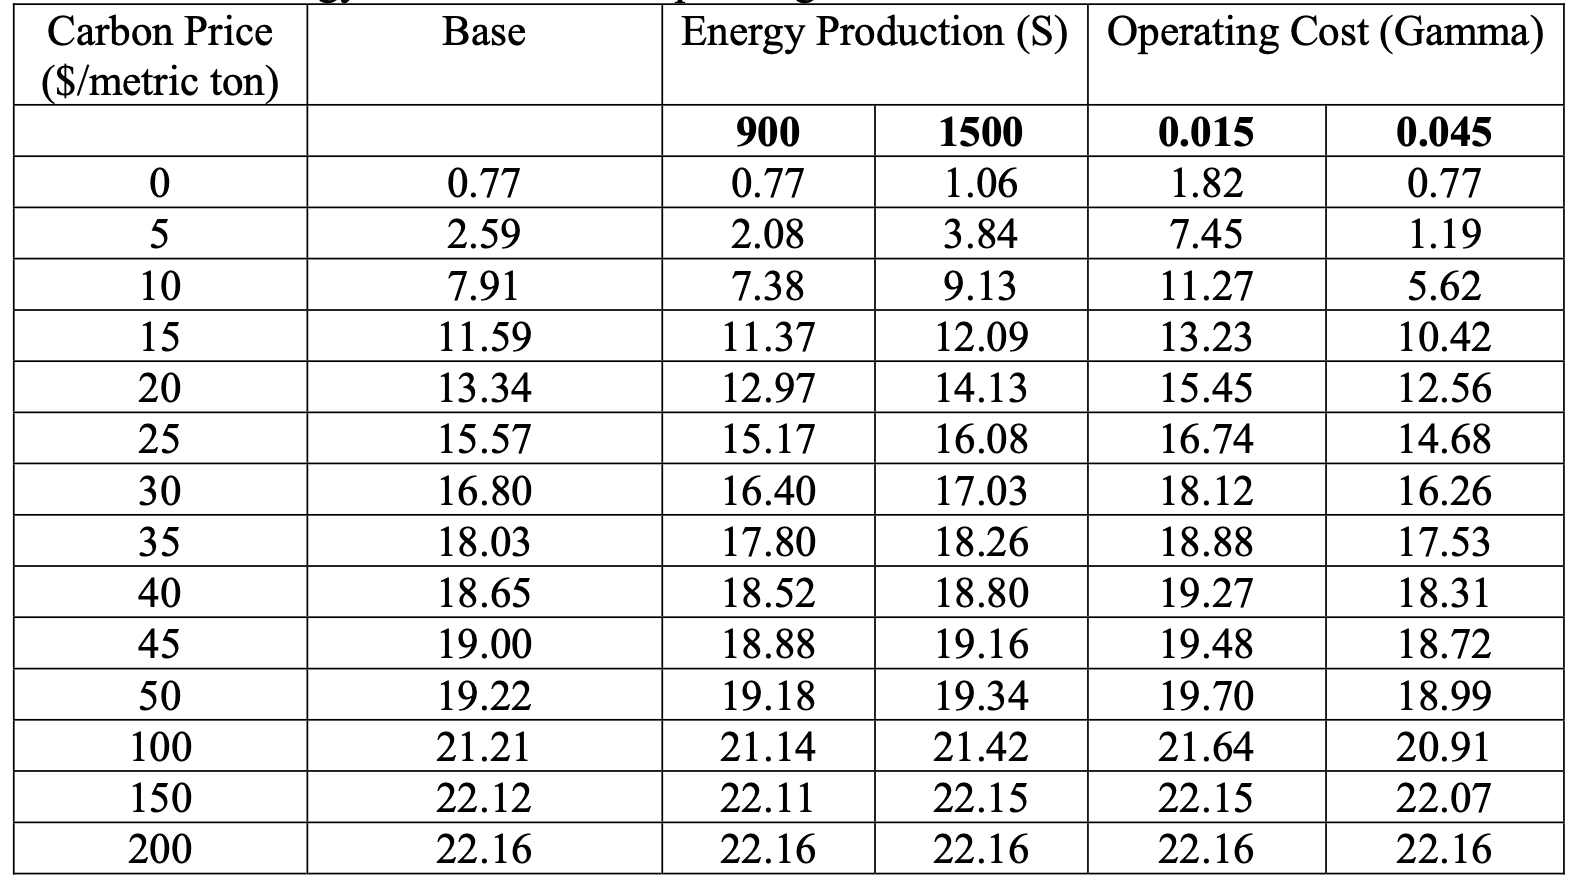
Table 8. Supply of CO2e Offsets (Million Metric Tons of CO2e) from AD under the Base and Alternative Energy Production and Operating Cost Scenarios.
The final scenarios illustrate the importance of the price received for the electrical output of the AD system (Table 9). The base scenario made the assumption that electrical sales to the grid were made at a price of $0.05 per kWh. If farms were allowed to sell energy to the grid at the retail price that they currently pay for electricity (grid price = farm price), the supply of offsets at low carbon prices would rise rapidly and then begin to plateau rather quickly. For instance under this assumption the supply would increase by more than 200 percent at an offset price of $5 per ton, but would only increase by 10% over the base case if offset prices were $15 per ton. Likewise, setting the grid sale price to $0.12 per kWh would result in even more dramatic increases in the amount of offsets supplied at low offset prices. On the other hand, eliminating the option for farms to sell electricity to the grid at $0.05 per kWh would cause large reductions in the quantity of offsets supplied until offset prices exceeded $20 per ton. For example, at offset prices of $15 per MT, the supply with no grid sales would 63 percent of that supplied under the base scenario with grid sales at $0.05 per kWh.
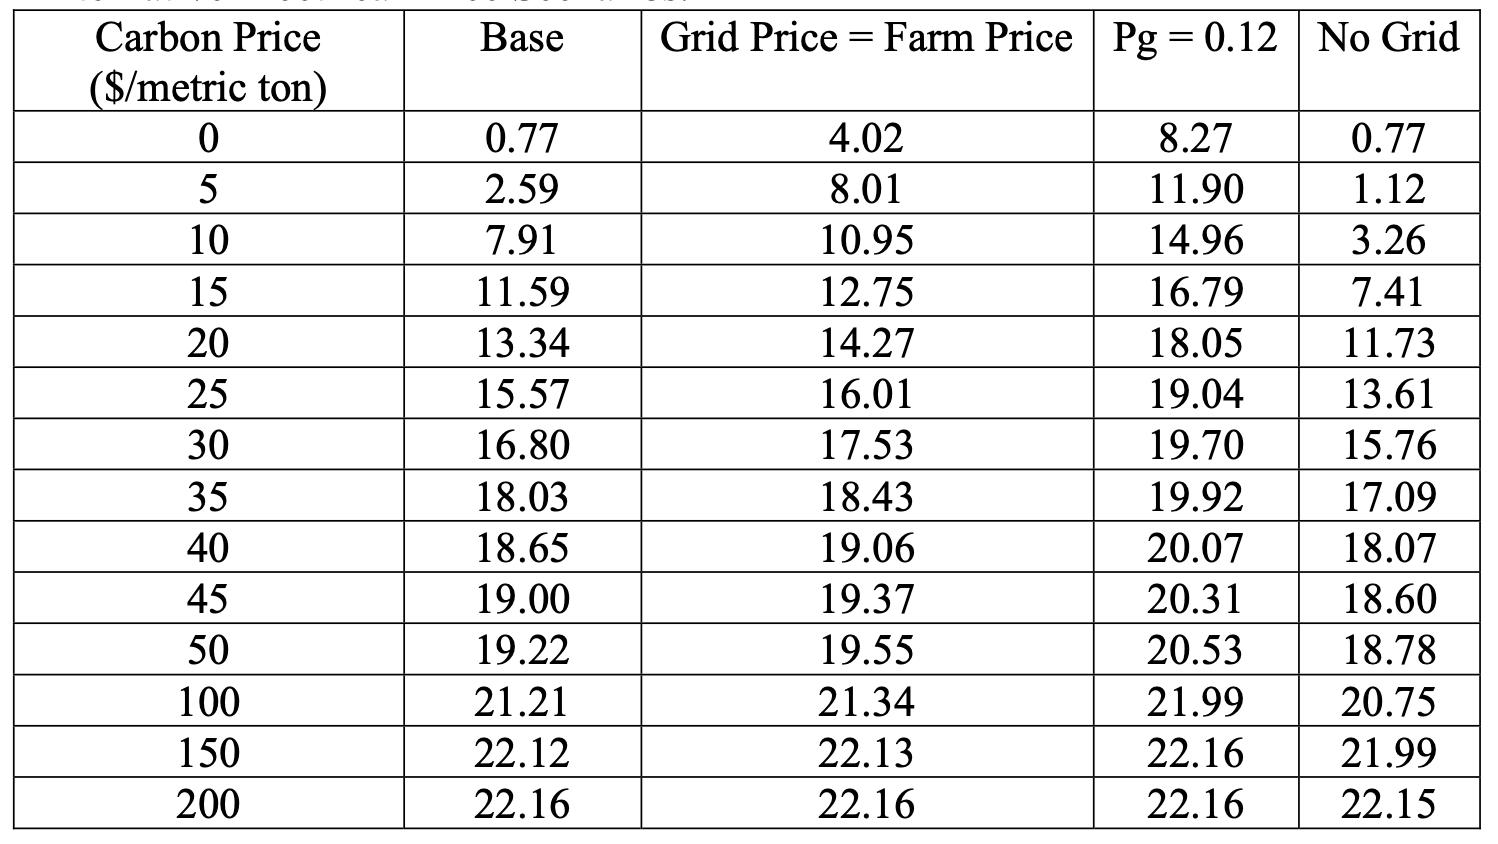
Table 9. Supply of CO2e Offsets (Million Metric Tons of CO2e) from AD under the Base and Alternative Electrical Price Scenarios.
The U.S. dairy sector continues to undergo substantial amounts of structural change with greater amounts of milk production being undertaken on the largest dairy farms (LaDue, Gloy and Cuykendall 2003; MacDonald and McBride 2009). The results of this analysis show that large dairy farms will likely receive a much greater benefit from the ability to supply CO2e offsets than smaller dairy farms (Table 10). The average herd size of farms that would be able to profitably adopt AD systems at CO2e offset prices less than $10 per MT is greater than 2,000 cows per farm. These farms account for only 1.4 percent of all dairy farms, but manage approximately 18 percent of all U.S. dairy cows. Given the high price of offsets required to make AD systems profitable on smaller dairy operations, larger farms would be more likely to take part in supplying offsets to the system thereby having a greater chance to offset energy price increases that might be associated with the implementation of a cap and trade policy for GHG emissions.
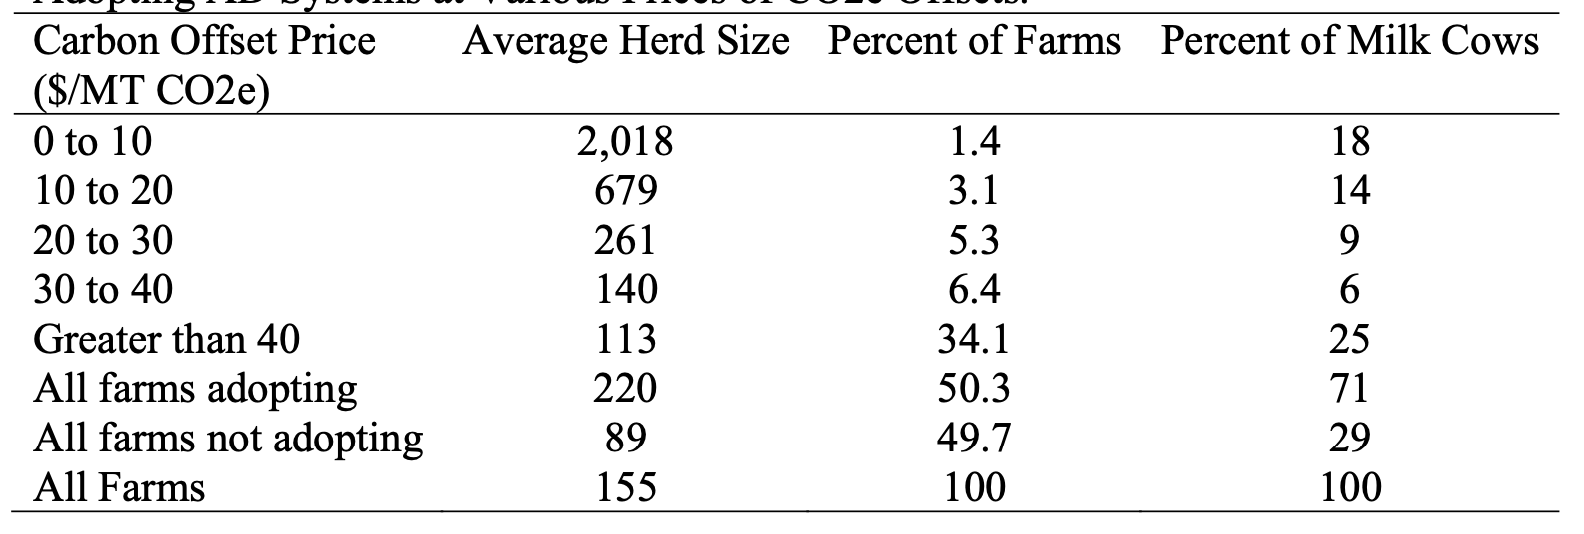
Table 10. Average Herd Size, Percent of Total Farms, and Percent of Milk Cows on Farms Adopting AD Systems at Various Prices of CO2e Offsets.
Summary
Given the current interest in reducing the emissions of greenhouse gases to the atmosphere it is important to understand the magnitude of incentives that would be required to encourage market participants to undertake actions to reduce emissions. U.S. dairy operations emit substantial amounts of methane from manure stored in anaerobic conditions. The installation of anaerobic digester (AD) systems can allow farmers to capture and destroy methane, a potent greenhouse gas. In addition, AD systems allow farmers to generate electricity which can be used to offset their own purchases of electricity or sold to consumers who desire to purchase renewable energy.
Despite these benefits, AD systems are capital intensive and current electrical prices do not justify widespread adoption. The implementation of a cap and trade policy allowing dairy producers to create carbon dioxide equivalent (CO2e) offsets, has the potential to change the economic situation facing dairy producers considering the installation of an AD system. Under current proposals before the U.S. Congress offsets will play a key role in determining the ultimate cost that consumers bear for implementing a cap and trade GHG regulatory mechanism. Offsets produced by installation of AD systems are often suggested as a way for dairy producers to benefit from a cap and trade policy.
The analysis in this article indicates that relatively high offset prices would be required to entice widespread adoption of AD systems by U.S. dairy producers. Offset prices of $5 per ton would result in an aggregate reduction of methane emissions from manure storages of approximately 11 percent of 2005 levels. Prices of $20 per ton of CO2e would be required to reduce methane emissions from dairy manure storages by 60 percent and $35 per ton would be required to achieve an 80 percent reduction.
Several factors have an important influence on the amount of offsets that would be expected to be supplied by dairy producers. Among the most important is the capital cost of installing the digester system. Much more work is needed to understand the investment cost function for AD systems. Likewise, policies that allow producers to receive higher prices for the renewable energy generated by AD systems would speed adoption.
The analysis in this paper also clearly points to several areas where additional research is needed. Because AD systems appear to exhibit substantial economies of scale, it is quite likely that the largest dairy producers would be the most likely to benefit from the ability to supply offsets. This would naturally raise concerns about the distributional impacts of such a policy within the dairy sector. Because all producers would face higher energy prices with the implementation of a cap and trade system, it is clear that those able to supply offsets to the scheme would have a cost advantage over those unable to supply to the system. Although these distributional issues exist within the dairy industry, it is likely that offsets produced by AD systems will be among the higher cost alternatives for creating CO2e offsets. This would suggest that dairy producers would be disadvantaged relative to other agricultural operations able to produce lower cost offsets.
References
Bishop, C.P. and C.R. Shumway. 2009. “The Economics of Dairy Anaerobic Digestion with Coproduct Marketing.” Review of Agricultural Economics, 31(3):394-410.
Chicago Climate Exchange. 2009. Chicago Climate Exchange Offset Project Protocol: Agricultural Methane Collection and Combustion. Chicago Climate Exchange, Inc. Available at: http://www.chicagoclimatex.com/docs/offsets/CCX_Agricultural_Methane_Final.pdf
Enahoro, D.K. and B.A. Gloy. 2008. “Economic Analysis of Anaerobic Digestion Systems and the Financial Incentives provided by the New York State Renewable Portfolio Standard Customer-Sited Tier Anaerobic Digester Gas-to-Electricity Program.” Department of Applied Economics and Management, Extension Bulletin 2008-4, Cornell University.
Gooch, C.A. and J. L. Pronto. 2009. “Capitalizing on Energy Opportunities on New York Dairy Farms.” Participant Briefing Paper: Opportunity Analysis, Dairy Power New York Summit, Innovation Center for U.S. Dairy.
Kramer, J.M. 2004. Agricultural Biogas Casebook: 2004 Update. Madison, WI. Resource Strategies, Inc.
Lazarus, W.F. and M. Rudstrom. 2007. “The Economics of Anaerobic Digester Operation on a Minnesota Dairy Farm.” Review of Agricultural Economics, 29(2):349-364.
LaDue, E.L., B.A. Gloy, and C. Cuykendall. 2003. “Future Structure of the Dairy Industry: Historical Trends, Projections, and Issues.” Department of Applied Economics and Management, Research Bulletin 2003-1, Cornell University.
Leuer, E.R., J. Hyde, and T.L. Richard. “Investing in Methane Digesters on Pennsylvania Dairy Farms: Implications of Scale Economies and Environmental Programs.” Agricultural and Resource Economics Review 37/2 (October 2008): 188–203.
Lusk, P. 1998. Methane Recovery from Methane Recovery from Animal Manures The Current Opportunities Casebook. Report for National Renewable Energy Laboratory, U.S. Department of Energy, Golden, CO.
MacDonald, J.M. and W.D. McBride. 2009. The Transformation of U.S. Livestock Agriculture: Scale, Efficiency, and Risks. Washington, D.C.: U.S. Department of Agriculture, Economic Research Service, Economic Information Bulletin, 43, January.
Outlaw, J.L., J.W. Richardson, H.L. Bryant, J.M Raulston, G.M. Knapek, B.K. Herbst, L.A. Ribera, and D.P. Anderson. 2009. “Economic Implications of the EPA Analysis of the CAP and Trade Provisions of H.R. 2454 for U.S. Representative Farms.” AFPC Research Paper 09-02. College Station, TX.
Stokes, J.R., R.M. Rajagopalan, and S. E. Stefanou. 2008. “Investment in a Methane Digester: An Application of Capital Budgeting and Real Options.” Review of Agricultural Economics, 30(4): 664-676.
U.S. Energy Information Administration. 2002. Updated State-level Greenhouse Gas Emission Coefficients for Electricity Generation 1998-2000. Available at: http://www.eia.doe.gov/pub/oiaf/1605/cdrom/pdf/e-supdoc.pdf.
U.S. Energy Information Administration. 2007. Electrical Power Annual State Data Tables 1990-2007. Available at: http://www.eia.doe.gov/cneaf/electricity/epa/epa_sprdshts.html.
U.S. Energy Information Administration. 2010. Fuel and Energy Source Codes and Emission Coefficients. Voluntary Reporting of Greenhouse Gases Program, Available at http://www.eia.doe.gov/oiaf/1605/coefficients.html. Accessed February 8, 2010.
U.S. Environmental Protection Agency. AgSTAR Handbook: A Manual for Developing Biogas Systems at Commercial Farms in the United States, Second Edition. Undated Manuscript. Available at http://www.epa.gov/agstar/resources/handbook.html.
U.S. Environmental Protection Agency. 2005. Greenhouse Gas Mitigation in U.S. Forestry and Agriculture. Washington, D.C.
U.S. Environmental Protection Agency. 2006. Market Opportunities for Biogas Recovery Systems: A Guide to Identifying Candidates for On-Farm and Centralized Systems. AgStar Program, EPA-430-8-06-004. Washington, D.C.
U.S. Environmental Protection Agency. 2008. Climate Leaders Greenhouse Gas Inventory Protocol Offset Project Methodology for Managing Manure with Biogas Recovery Systems, Version 1.3. Washington, D.C.
U.S. Environmental Protection Agency. 2009. Inventory of U.S. Greenhouse Gas Emissions and Sinks: 1990-2007. EPA-430-R-09-004, Washington, D.C.
U.S. Environmental Protection Agency. 2009b. EPA Analysis of the American Clean Energy and Security Act of 2009 H.R. 2454 in the 111th Congress. Washington, D.C.
U.S. Environmental Protection Agency. 2009c. Anaerobic Digestion Capital Costs for Dairy Farms. AgStar Program. Project Development Resources, Available at: http://www.epa.gov/agstar/pdf/digester_cost_fs.pdf.
Wright, P. 2001. “Overview of Anaerobic Digestion Systems for Dairy Farms.” Natural Resource, Agriculture and Engineering Service (NRAES-143), March.
End Notes
1 The states covered by the survey are AZ, CA, FL, GA, ID, IL, IN, IA, KY, ME, MI, MN, MO, NM, NY, OH, OR, PA, TN, TX, VT, VA, WA, WI
2 The diesel fuel, gasoline, and LP gas prices are regional prices for bulk delivery and taken from the NASS Quick Stats database, (http://www.nass.usda.gov/QuickStats). The natural gas prices are state level prices for commercial delivery of natural gas and from the EIA (http://tonto.eia.doe.gov/dnav/ng/ng_pri_sum_a_epg0_pcs_dmcf_a.htm).
3 The coefficients reported in the protocols were converted to annual CO2e emissions per cow assuming production of 365 days in a year and a global warming potential for methane of 21 (US-EPA 2009).
4 Some farms reported utilizing both a liquid slurry system and a lagoon based storage system. Ideally, one would estimate the quantity of manure held in each system. While ARMS collects the volume of each storage system, it does not collect information regarding the moisture content of manure in each, making it impossible to precisely estimate the amount of manure in stored in each system. As a result, farms that utilized both types of systems were assumed to use the anaerobic lagoon as their primary storage and were classified accordingly. After accounting for farms with both lagoon and slurry storages, 50.25 percent of U.S. farms stored manure in anaerobic conditions that create methane emissions.
5 This value was calculated by multiplying the average CO2e emissions from manure storage per farm (Table 4) by the total number of farms represented by the ARMS survey (52,237).
6 Several factors could account for the discrepancy. First, the emission factors used by the CCX may be higher than estimates used by the EPA. Second, the estimates from EPA did not utilize the same level of detailed data as that used in this study. Third, the estimates used in this paper rely on emission factors for milking cows instead of heifers and calves while EPA apparently makes such a distinction. Neither study accounts for the fact that the manure production for lactating and non-lactating animals can differ substantially. It should also be noted that EPA significantly increased their estimates of emissions from manure management in the 2009 GHG inventory.
![]()
![]()
![]()
![]()
![]()
TAGS:
TEAM LINKS:

RELATED RESOURCES
UPCOMING EVENTS
We are taking a short break, but please plan to join us at one of our future programs that is a little farther in the future.