September 16, 2015
Benchmarking Machinery Investment and Cost
![]()
![]()
![]()
![]()
![]()
Key Machinery Benchmarks
Machinery investment per acre is computed by dividing total crop machinery investment (i.e., investment in tractors, combines, and other machinery) by crop acres or harvested acres. In regions where double-cropping is prevalent, using harvested acres gives a more accurate depiction of machinery investment.
Machinery investment per acre typically declines with farm size. It is important for farms to compare machinery investment per acre with similarly sized farms and to examine the trend in this benchmark for a particular farm. A farm with relatively high machinery investment per acre needs to determine whether this high value is a problem. If the farm faces serious labor or timeliness constraints, this benchmark may be relatively high. However, if this benchmark is high due to the purchase of assets used to mitigate income tax obligations, the farm needs to think about whether this is a profitable long-term strategy (i.e., is the farm going to exhibit higher costs per acre due to this strategy).
Machinery cost per acre is computed by summing depreciation, interest, property taxes, insurance, building expense, leasing, repairs, fuel and lubricants, and custom hire and rental expense; and dividing the resulting figure by crop acres or harvested acres. Interest should include both cash interest paid and an opportunity charge on machinery and equipment that is owned. Again, in regions where double-cropping predominates, using harvested acres is preferable.
Case Farm Illustration
Machinery investment and cost for a case farm in west central Indiana is presented in table 1. This case farm has 1500 acres of full-season corn and 1500 acres of full-season soybeans. If this farm had livestock, the relevant machinery investment and cost figures for the livestock operation would need to be excluded from total machinery investment and cost to compute the values in table 1. Machinery investment per acre for this farm is $270.33. Machinery costs include depreciation, interest, insurance, building expense, repairs, and fuel and lubricant. This farm does not custom hire or lease machinery so the values for these items are zero in table 1. Interest was computed my multiplying machinery investment by a long-term interest rate (6%). Machinery cost per acre for the case farm is $97.08.
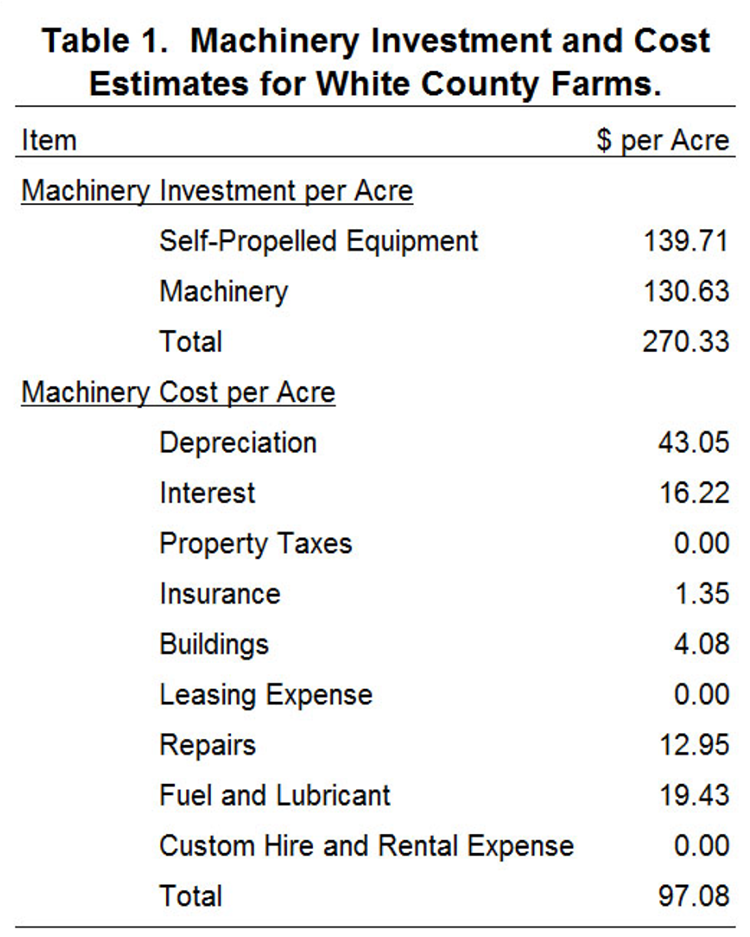
Table 1. Machinery Investment and Cost Estimates for White County Farms.
Unfortunately, crop machinery benchmarks are not readily available. However, some information is available from farm management association programs in Illinois and Kansas. For a farm with 3000 crop acres, machinery investment per acre and machinery cost per acre are typically below $375 and $125 per acre, respectively. The benchmark values for the case farm are below these amounts. For an illustration of crop machinery investment per acre for Illinois FBFM farms see here.
It is also important to note that this farm also has strong labor benchmarks. Given the potential tradeoff between labor cost and machinery cost, it is often important to compute both labor and machinery benchmarks. For a closer examination of labor benchmarks for the case farm see farmdoc daily September 4, 2015.
Conclusions
This article defined, described, and illustrated crop machinery investment and cost benchmarks for a case farm in west central Indiana. The case farm had benchmarks that were below the specified targets. In order to more fully gauge farm efficiency, it would be helpful to also compare the farm’s profitability and financial efficiency ratios to farms of the same type and similar in size. Additional information pertaining to benchmarks can found on the web site for the Center for Commercial Agriculture (here).
![]()
![]()
![]()
![]()
![]()
TAGS:
TEAM LINKS:
RELATED RESOURCES
UPCOMING EVENTS
We are taking a short break, but please plan to join us at one of our future programs that is a little farther in the future.