January 12, 2016
Crop Margins in a Boom-Moderation Price Cycle
![]()
![]()
![]()
![]()
![]()
A glance at a chart of commodity prices over say 100 or more years reveals periods of surging prices followed by a period of moderation in prices. Once prices moderate, they may stay relatively low for an extended time. Some have observed that this total cycle may be around 30 years, with the boom-moderation phase lasting 12 to 15 years.
The number of years in a price cycle will depend on how events unfold in each cycle and for each commodity. So while crude oil and corn prices have some common economic drivers that tend to cause a similar price pattern, they each have unique supply and demand forces that can make the magnitudes of price moves, the pattern, and the timing vary.
Some Economic Drives of Boom-Moderation Cycles
There are fundamental reasons why boom-moderation price cycles occur and have a common pattern. The price boom is often set off by some unexpected upward surge in demand. Starting with the 2006 corn and soybean crops the largest of these was the global biofuels policy shift to use much more crop production for fuel, and also the surging Chinese demand for soybeans. With world usage exceeding production for a number of years, world inventories were quickly drawn down and the words “food shortages” began to drive prices upward. Higher prices from basic supply and demand forces were complemented by other drivers such as some years of low yields, a weak U.S. dollar, and artificially low interest rates.
High prices immediately increased margins for the world’s crop producers resulting in profits which mean revenues exceed all costs of production. A Midwest crop producer might say it like this: “After I paid all my variable costs, paid cash rent, paid for depreciation on machinery, and paid all my family living expenses, there was still a lot of money left over.” Revenues above all costs, especially over several years stimulated global supply resulting in increased acreage and especially increased use of a broad range of yield increasing technologies.
Over a series of years, total global production rose enough to meet the global usage, especially when the rate of growth in that global usage slowed down. The slowing rate of global usage growth was a function of a general leveling off of the biofuels growth rate after the 2010 crops and more recently as the economic growth rate began to slow in countries like China.
For the past three crop years (2013, 2014, and 2015 crops), corn and soybean prices have been falling. Why? Each year, world production has exceeded usage and world inventories have been rising. Also in the U.S. during the price boom, a weak dollar helped stimulate added exports contributing to the price boom. Now a strong dollar has a dampening impact on U.S. exports contributing to price weakness. In addition, artificially low interest rates during the boom period was an influence on a weaker dollar, on higher farm margins, and on higher land values. Now, higher interest rates are expected to have a dampening effect on farm margins and asset values.
Finally, commodities like oil and crops tend to have relatively high fixed or overhead costs. This means that once prices moderate, producers are slow to reduce production. Continued high production can contribute to low commodity prices for extended years.
Crop Margin Implications
The figure provides Purdue estimates of the revenues and total costs per acre for an Indiana farm with one-half corn and one-half soybeans on average quality land. The chart begins with the 2005 crops, the last of the $2.00 per bushel corn era. Total revenues (market, crop insurance, and government payments) and total costs of production are similar. Then beginning with the 2006 crops, prices and revenues begin to rise, eventually more than doubling by the 2012 crops.
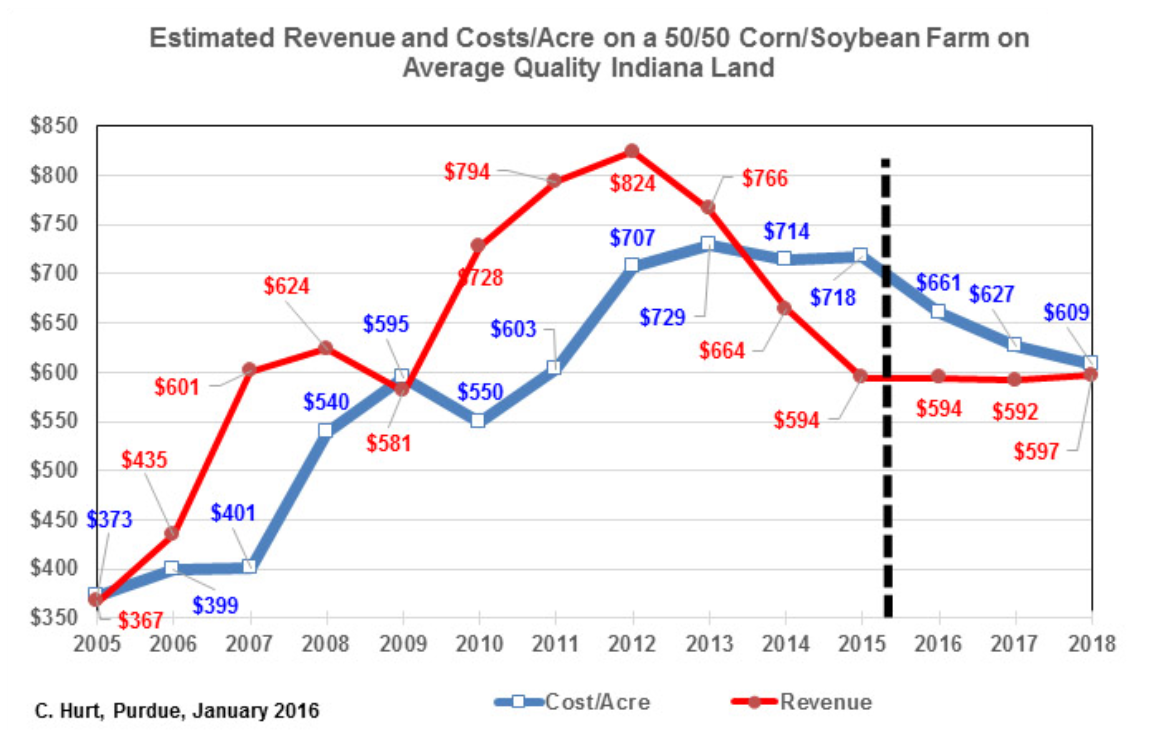
Figure 1. Estimated Revenue and Costs/Acre on a 50/50 Corn/Soybean Farm on Average Quality Indiana Land
Total costs of production also rose over the boom period, but with a lag of 1 to 3 years. The sharp and immediate rise in revenues and the lagging nature of costs, set up large profit margins during the boom. By 2014, revenues dropped below total costs. Costs have been slower to moderate and thus margins are negative.
The 2016 crops are the first to have noticeable reductions in production costs with lower fertilizer, fuel and cash rents. Projected revenues for 2016, 2017, and 2018 are based on current futures market prices adjusted to a cash estimate. Unfortunately, those projected revenues are flat for 2016 to 2018. While corn futures prices do increase each year, government program payments drop as prices rise.
If revenues remain flat, then the drive to get costs back in alignment with revenues would need to come from lowering costs of production as shown in the graph.
In markets, it is all about timing. This illustration demonstrates the distinctly different farm strategies needed in boom and moderation periods. The boom period is dominated by surging revenues with costs more slowing adjusting upward. The moderation period is dominated by rapidly falling revenues with costs needing multiple years to adjust lower.
Part of the study of commodity price patterns is to understand the adjustment processes of getting revenues in alignment with costs. When those are aligned, we call it equilibrium. But in reality, most of the time is spent in disequilibrium with economic forces of profits and losses pulling in one direction or the other and with prices constantly adjusting to these forces as new supply and demand information enters the marketplace.
![]()
![]()
![]()
![]()
![]()
TAGS:
TEAM LINKS:
RELATED RESOURCES
U.S. farm income in 2026 appears stable, but increased government payments are masking weaker livestock receipts and rising costs. Indiana faces a sharper decline, with net farm income projected to fall 28%, highlighting tighter margins and growing financial pressure heading into 2027.
READ MOREUPCOMING EVENTS
We are taking a short break, but please plan to join us at one of our future programs that is a little farther in the future.