September 12, 2016
2016 Agriculture and Applied Economics Association Annual Outlook Survey Highlights
![]()
![]()
![]()
![]()
![]()
Since the late 1970s an annual survey of agricultural economists has been conducted by members of the Agricultural and Applied Economics Association (AAEA) to learn more about economists expectations for the agricultural economy in the upcoming year. This year’s AAEA survey was conducted by the Purdue Center for Commercial Agriculture in July 2016 and included responses from over 50 agricultural economists from across the U.S. A copy of this year’s survey along with a summary of responses for each question can be found online (Survey Results Here, Annual Outlook Survey Tool Here). This paper identifies several key points from the AAEA survey and, where possible, contrasts findings from the survey of economists with responses from a related survey of U.S. agricultural producers conducted during the same time frame.
Pessimism Toward the Future
The AAEA survey provided an opportunity to learn how economists’ perspective on the agricultural economy compared to producers’ perspective. The Purdue/CME Group Ag Economy Barometer provides insight each month into the sentiment of U.S. agricultural producers by posing five questions to 400 agricultural producers across the nation and using their responses to calculate a sentiment index. The same five questions were posed to agricultural economists[1]. By comparing AAEA survey respondents’ responses in July to producer responses for the same period, it was possible to compute a relative sentiment score from the AAEA survey for comparison to the Ag Economy Barometer. Responses to the July AAEA survey revealed that agricultural economists were notably less optimistic about the agricultural economy than producers. During July the AAEA survey responses produced a relative sentiment score of 79, well below the Ag Economy Barometer (producer survey) value of 112. In fact, July’s AAEA sentiment score of 79 was even lower than the lowest producer sentiment reading of 85, recorded in March 2016, since the Ag Economy Barometer’s inception in October 2015.
Responses to the Ag Economy Barometer monthly survey are divided into two broad sub-components, the Index of Current Conditions and the Index of Future Expectations, to provide further clarity with respect to what is driving change in the Barometer over time. The same approach was undertaken with respect to the AAEA survey responses and results for both the producer and AAEA surveys are provided in figure 1. While the producer and AAEA responses in July for the Index of Current Conditions were nearly identical, that was not the case for the Index of Future Expectations. Specifically, the producer score for this forward-looking index was 121 in July, whereas the relative score from the survey of agricultural economists was just 72. In short, producers were much more optimistic about future economic conditions in the agricultural sector than economists.
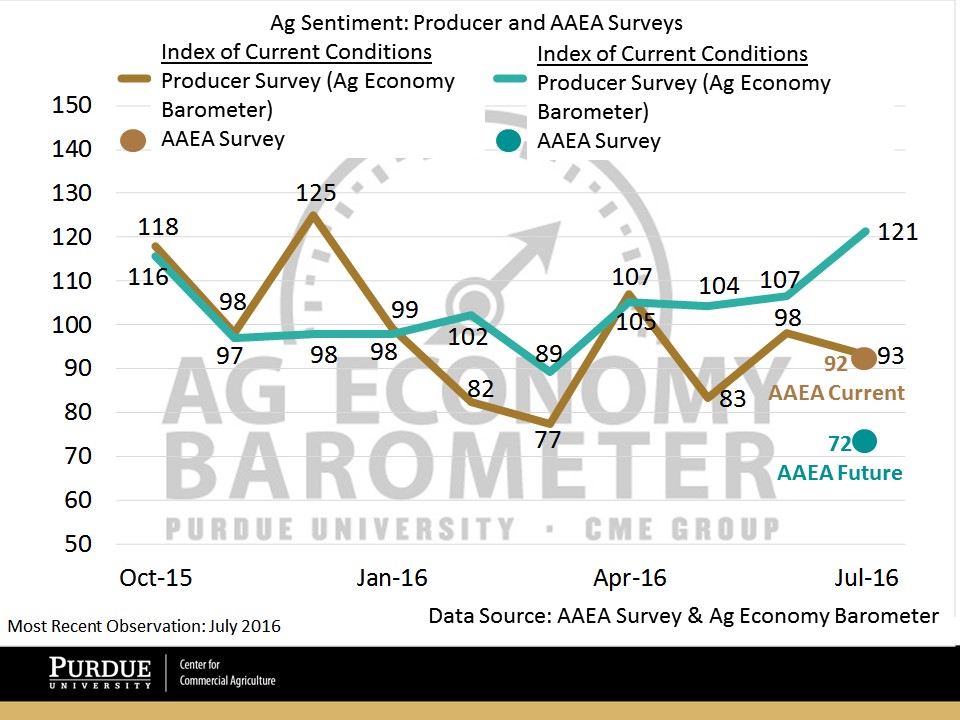
Figure 1. Purdue/CME Ag Economy Barometer and the relative score from AAEA respondents (October 2015- July 2016). Index of Current Conditions (brown) and Index of Future Expectations (green).
To further highlight differences between agricultural economists’ and producers’ views about the future, figure 2 depicts the share of respondents that think during the next five years U.S. agriculture will experience widespread “bad times” financially. During July, 40 percent of producer respondents expected bad times, which was the lowest percentage observed in 10 months of data collection. In contrast, two-thirds of economists surveyed expect widespread “bad times” in the next five years.
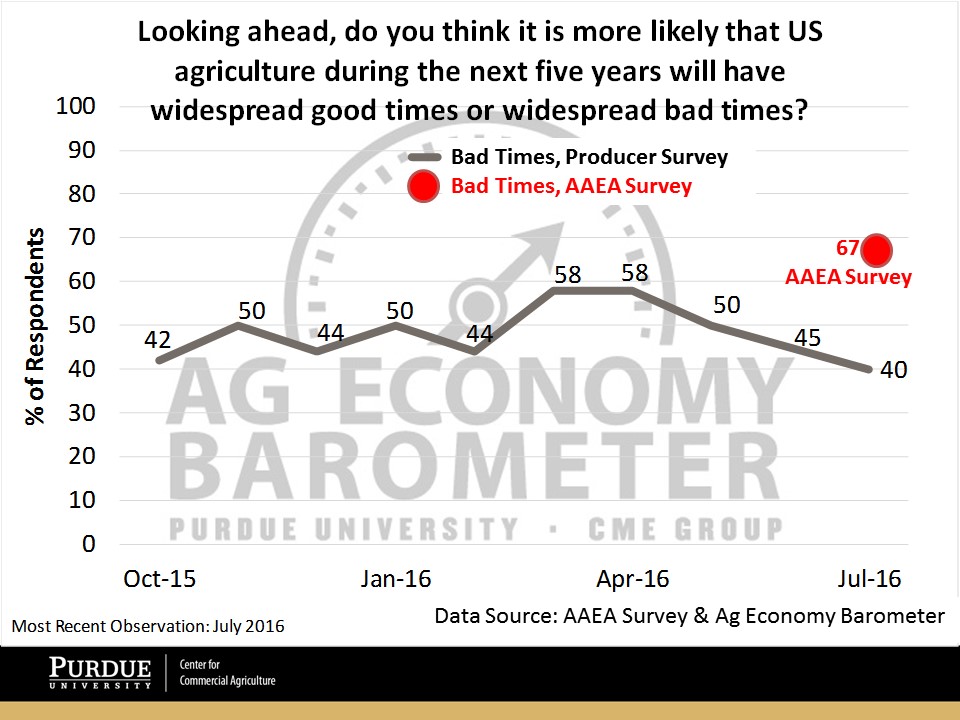
Figure 2. Percentage of respondents expecting ‘bad times’ financially in U.S. agriculture over the next 5 years. Purdue/CME Ag Economy Barometer Producer Survey (in gray) and AAEA Survey (red). October 2015 – July 2016.
Farmland Values
A key metric within the U.S. agricultural economy is the value of farmland. When AAEA survey respondents were asked about their expectations with respect to changes in farmland values 12 months out (e.g., in July 2017 vs. July 2016), the majority (54 percent) reported that they the expect lower farmland values in the year ahead with just 13 percent of respondents expecting higher farmland values (Figure 3). The outlook for farmland values among agricultural economists was noticeably more pessimistic than among producers as just 25 percent of producers reported that they expect lower farmland values in the year ahead with almost as many producers (23 percent) expecting farmland values to increase over the next twelve months.
To focus more clearly on farmland values in the U.S. Corn Belt, the AAEA survey asked economists about their expectations with respect to the value of High-Grade Farmland Values in Iowa in November 2016 and November 2017, both compared to a year earlier. Respondents, on average, expect the Iowa farmland market in November 2016 to be 3.6 percent lower than in November 2015. When asked about Iowa farmland values in November 2017, again relative to one year earlier, economists were somewhat less bearish, expecting, on average, a decline of 1.8 percent.
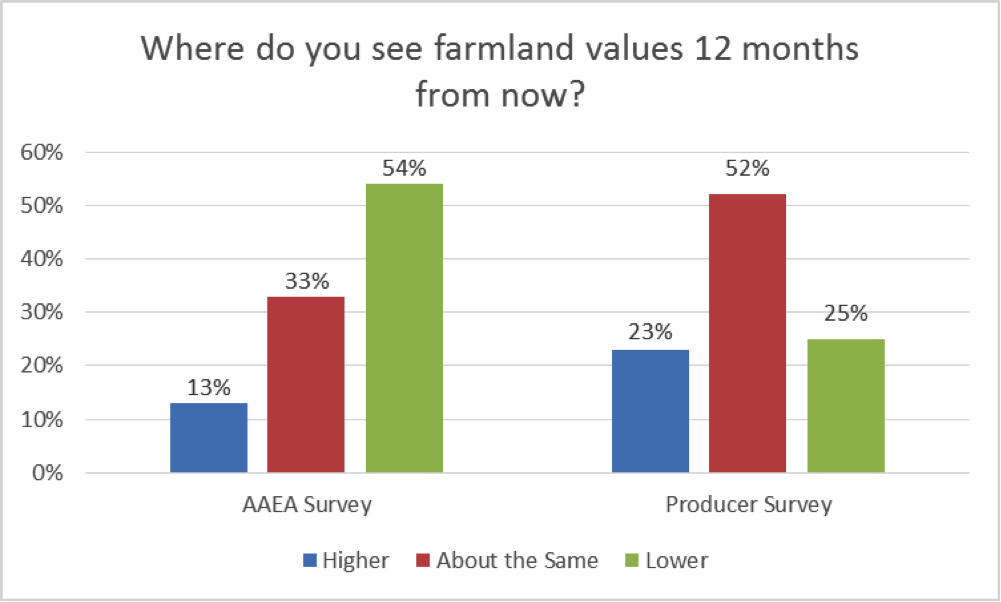
Figure 3. AAEA and Producer Survey Respondents’ Expectation of Farmland Values 12 months out. July 2016.
Commodity Prices
A key driver of the agricultural economy is commodity prices. The AAEA survey posed several questions about commodity prices to capture insights into expected changes in major agricultural commodities prices.
Figure 4 provides AAEA survey respondents expectations for livestock price changes in the year ahead. For beef cattle – choice (fed) steers and Oklahoma City feeder steers – 60 percent or more of economists reported that they expect lower prices 12 month out, whereas less than 10 percent expect higher prices and 31 percent expected prices to be unchanged. In contrast, nearly half of the economists completing the survey expect hog prices 12 months ahead to be about the same as in July 2016, while just over 40 percent of respondents look for prices to decline and 9 percent think prices will increase. The majority of economists (61 percent) in the AAEA survey expect broiler prices to be unchanged in the year ahead with the remainder of survey respondents almost equally divided between expecting higher and lower prices. Agricultural economists responding to the survey were almost equally divided between expecting higher and unchanged milk prices in the next twelve months, with just 16 percent of those surveyed reporting that they expect milk prices to decline from July 2016 to July 2017.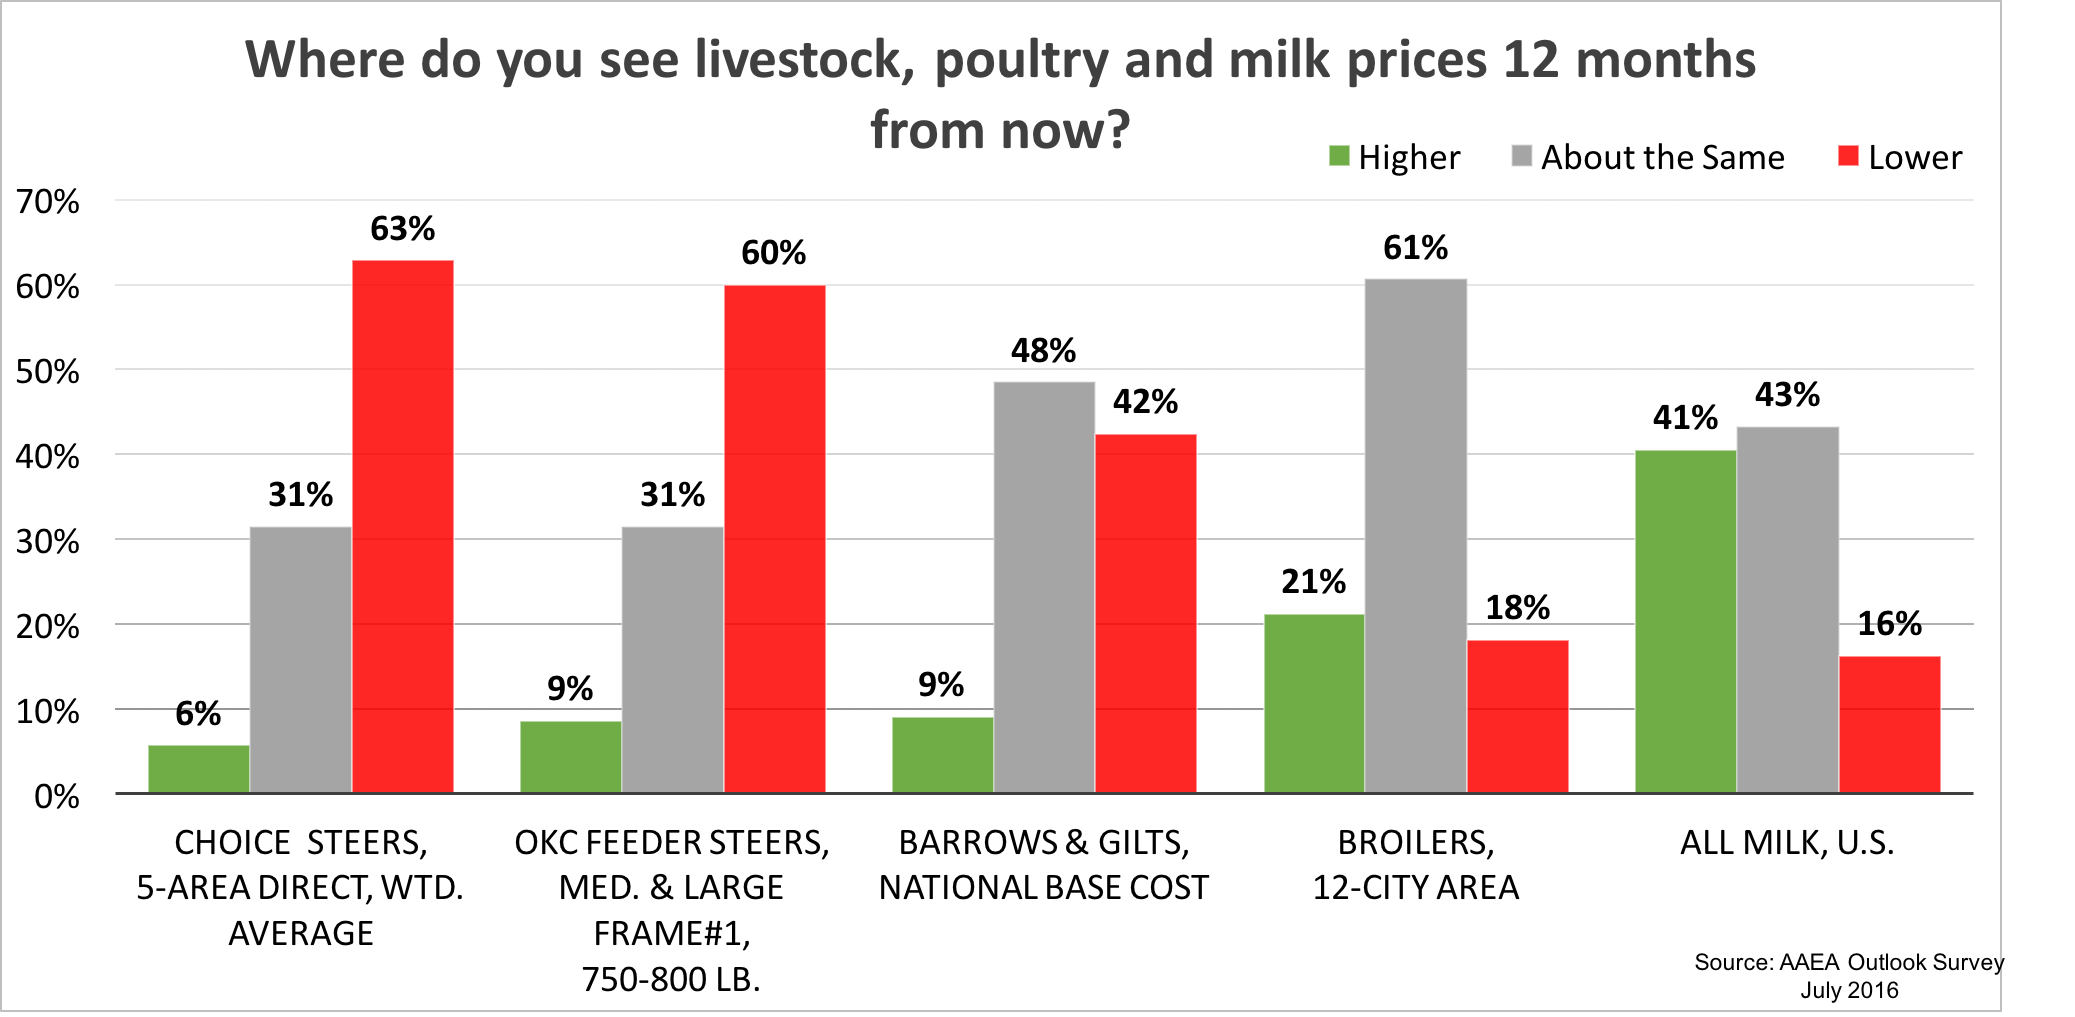
In figure 5 the respondents’ expectation for field crop commodity prices one year ahead are shown. Wheat was the only commodity for which a larger share of agricultural economists reported that they expect higher, rather than lower, prices by mid-summer 2017 vs mid-summer 2016. For corn and soybeans, the percentage of agricultural economists expecting lower prices in summer 2017 vs. 2016 was more than double the percentage that expect prices for these two commodities to be higher. Again, the agricultural economists responding to the AAEA survey were notably more pessimistic about the direction of field crop prices than producers. For example, on the July Ag Economy Barometer survey less than 20 percent of producers reported that they expect corn or soybean prices in July 2017 to be lower than July 2016.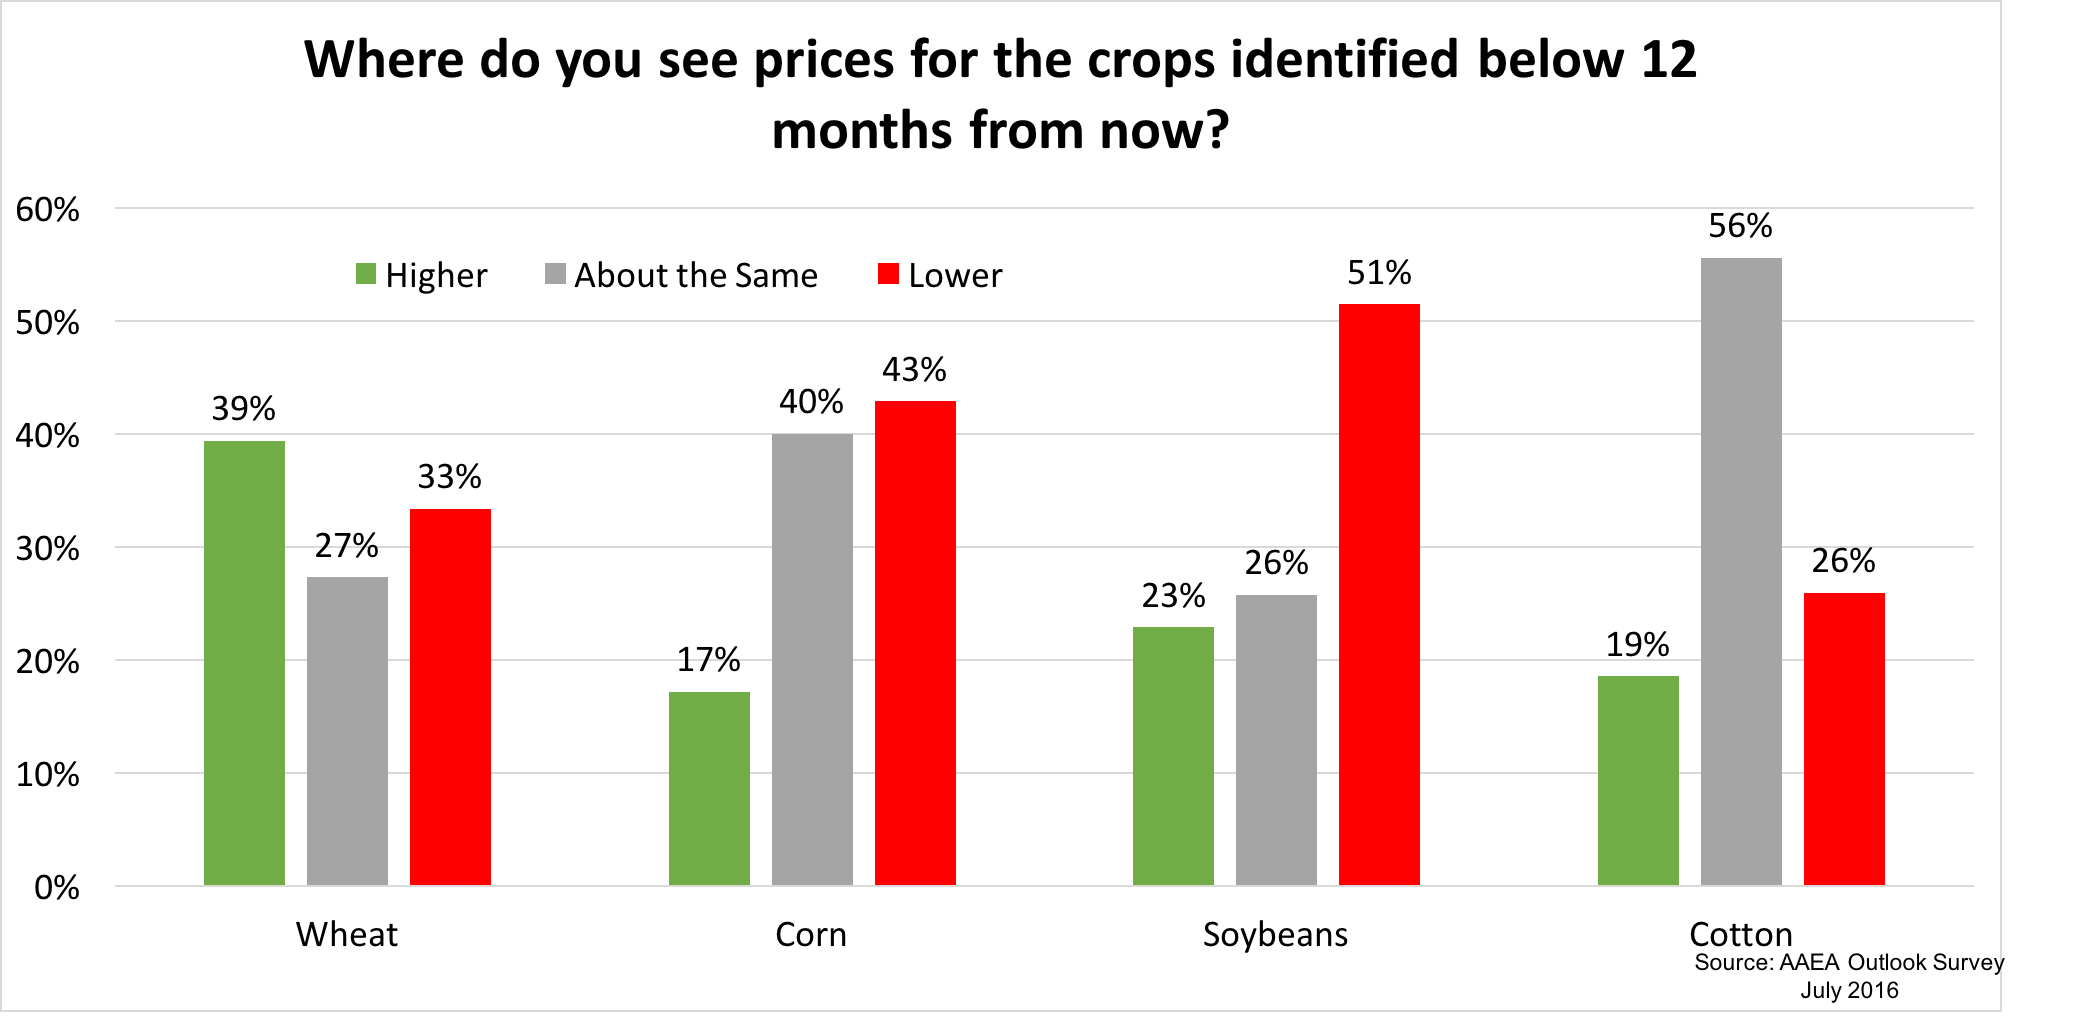
A second way in which respondents were asked about commodity price expectations was to report their expectation for the trading high, trading low, and settlement price on June 30, 2017 for the specific future contract. Not all survey respondents provided a response for these questions so results by respondent are provided as well as average figures for the group of respondents. Figure 6 summarizes these results for the July 2017 CBOT corn futures contract (for details regarding other commodities, a complete set of survey results available here.
Nineteen agricultural economists provided forecasts for the expected high, low and June 30, 2017 settlement prices for July 2017 CBOT corn futures prices. The average of all respondents forecast for the June 30th settlement price was $3.77 per bushel. The majority of respondents expect the settlement price on June 30, 2017 to fall between $3.50 and $4.00 per bushel. Three respondents expect the settlement price to be above $4.00 per bushel whereas just two respondents expect the June 30th settlement price to be near $3.00 per bushel. When thinking about the range (high and low) of prices the contract from August 1, 2016 to June 30, 2017, 12 out of 19 respondents believe July CBOT corn futures prices will exceed $4.00 per bushel at some point whereas just one agricultural economist expects the July corn futures contract to drop below $3.00 per bushel.
Eighteen economists provided forecasts for the expected high, low and the June 30, 2017 settlement prices for July 2017 CBOT soybean futures prices. The average of all respondents forecast for the June 30th settlement price was $10.18 per bushel. Two-thirds of the respondents expect the settlement price on June 30, 2017 to be above $10 per bushel and all of the respondents expect settlement price at the end of June to be $9 or higher. Several survey respondents expect a very wide trading range for the July 2017 soybean futures contract, although most respondents expect the contract to trade between $9 and about $11 per bushel.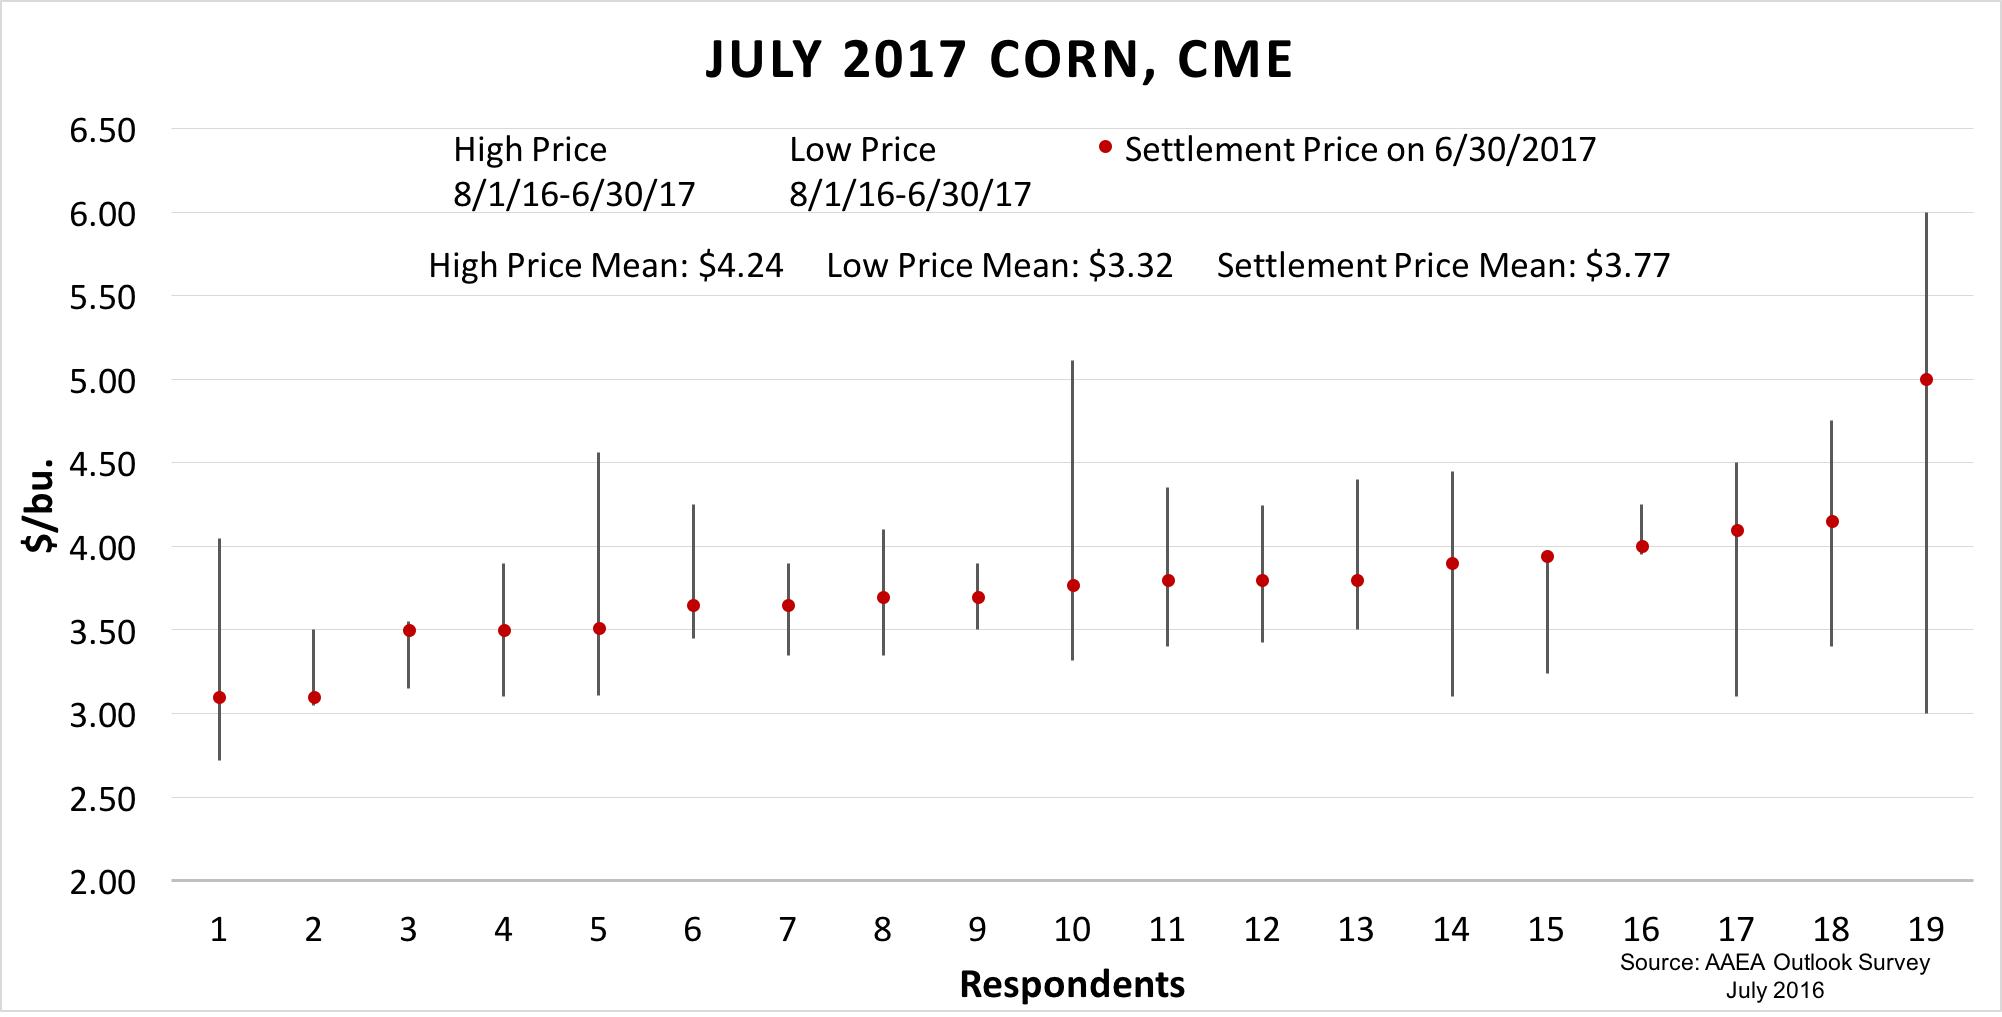
Final Thoughts
The AAEA Annual Outlook Survey provides an opportunity to discern the perspective of a group of agricultural economists with regard to the health of the agricultural economy, their expectations about the future direction of key commodity prices and their forecasts regarding farmland values. Since many of the questions posed in the AAEA Annual Outlook Survey mirror those posed monthly to producers responding to the Purdue/CME Group Agricultural Economy Barometer survey, the AAEA survey also provides an opportunity to compare and contrast results obtained from agricultural economists with those provided by U.S. agricultural producers.
Results from these two surveys reveal that there are some stark differences in opinion between economists and producers regarding the U.S. agricultural economy. Although U.S. producers and agricultural economists both have a similar perspective regarding the current health of the U.S. farm economy, their perspectives diverge quite sharply when questioned about the future. Agricultural economists were generally more pessimistic about the future direction of crop prices and farmland values than agricultural producers. Expected weakness in key commodity prices in turn led agricultural economists to have a much more negative view about the future health of the U.S. agricultural economy than expressed by U.S. farmers.
[1] The text for questions in the AAEA survey was adjusted slightly to reflect differences in the two survey audiences. For example, questions in the producer survey that ask about “your operation” were changed in the AAEA survey to inquire about “the operations you are most familiar with.”
![]()
![]()
![]()
![]()
![]()
TAGS:
TEAM LINKS:
RELATED RESOURCES
U.S. farm income in 2026 appears stable, but increased government payments are masking weaker livestock receipts and rising costs. Indiana faces a sharper decline, with net farm income projected to fall 28%, highlighting tighter margins and growing financial pressure heading into 2027.
READ MOREUPCOMING EVENTS
We are taking a short break, but please plan to join us at one of our future programs that is a little farther in the future.