September 12, 2016
International Benchmarks for Wheat Production (2016)
![]()
![]()
![]()
![]()
![]()
Examining the competitiveness of wheat production in different regions of the world is often difficult due to lack of comparable data and consensus regarding what needs to be measured. To be useful, international data needs to be expressed in common production units and converted to a common currency. Also, production and cost measures need to be consistently defined across production regions or farms.
This paper examines the competitiveness of wheat production for important international wheat regions using 2013 to 2015 data from the agri benchmark network. Articles pertaining to corn and soybeans can be found here and here. The agri benchmark network collects data on beef, cash crops, dairy, pigs and poultry, horticulture, and organic products. There are 36 countries represented in the cash crop network. The agri benchmark concept of typical farms was developed to understand and compare current farm production systems around the world. Participant countries follow a standard procedure to create typical farms that are representative of national farm output shares, and categorized by production system or combination of enterprises and structural features. Gross revenue and cost for each typical farm are converted to U.S. dollars.
The sample of farms used in this paper was comprised of seven typical farms with wheat enterprise data from Australia, Canada, Germany, Ukraine, and United States. The farm and country abbreviations used in this paper are listed in table 1. Typical farms used in the agri benchmark network are defined using country initials and hectares on the farm. It is important to note that wheat enterprise data is collected from other countries. These five countries represented in table 1 were selected to simplify the illustration of costs and discussion. There are three U.S. farms with wheat in the network. The U.S. farm used to illustrate wheat production in this paper is the western Kansas farm.
All of the typical farms listed in table 1 produced multiple crops. The Australian farm produced barley, fodder, rapeseed, and summer wheat. The Canadian farm in the Red River Valley produced rapeseed, soybeans, and winter wheat. The Canadian farm in Saskatchewan produced linseed, oats, peas, rapeseed, and summer wheat. The German farm produced rapeseed, sugar beets, and winter wheat. The smaller Ukraine farm produced corn, rapeseed, soybeans, and winter wheat. The larger Ukraine farm produced corn, soybeans, sunflowers, and winter wheat. The U.S. farm produced corn (non-irrigated and irrigated) and winter wheat.
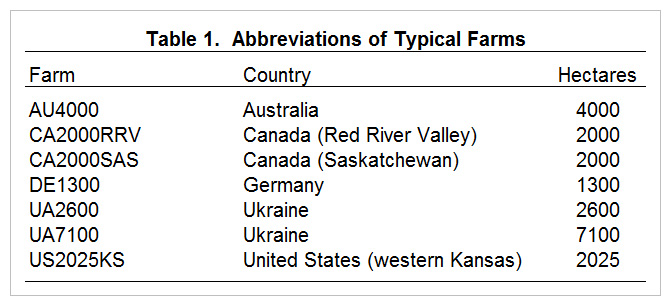
Table 1. Abbreviations of Typical Farms
Wheat Yields
Although yield is only a partial gauge of performance, it reflects the available production technology across farms. Average wheat yield for the farms in 2013 to 2015 was 4.63 metric tons per hectare (68.9 bushels per acre). Average farm yields ranged from approximately 2.00 metric tons per hectare for the typical farm in Australia (29.8 bushels per acre) to 9.26 metric tons per hectare for the German farm (137.7 bushels per acre). The U.S. farm had an average yield of 2.74 metric tons per hectare (40.7 bushels per acre). Figure 1 illustrates average wheat yield for each typical farm.
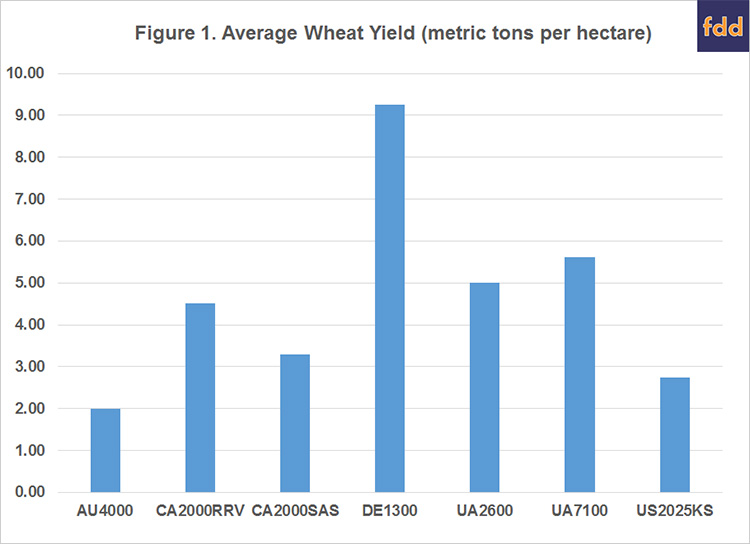
Figure 1. Average Wheat Yield (metric tons per hectare)
Input Cost Shares
Due to differences in technology adoption, input prices, fertility levels, efficiency of farm operators, trade policy restrictions, exchange rate effects, and labor and capital market constraints, input use varies across typical wheat farms. Figure 2 presents the average input cost shares for each farm. Cost shares were broken down into three major categories: direct costs, operating costs, and overhead costs. Direct costs included seed, fertilizer, crop protection, crop insurance, and interest on these cost items. Operating cost included labor, machinery depreciation and interest, fuel, and repairs. Overhead cost included land, building depreciation and interest, property taxes, general insurance, and miscellaneous cost.
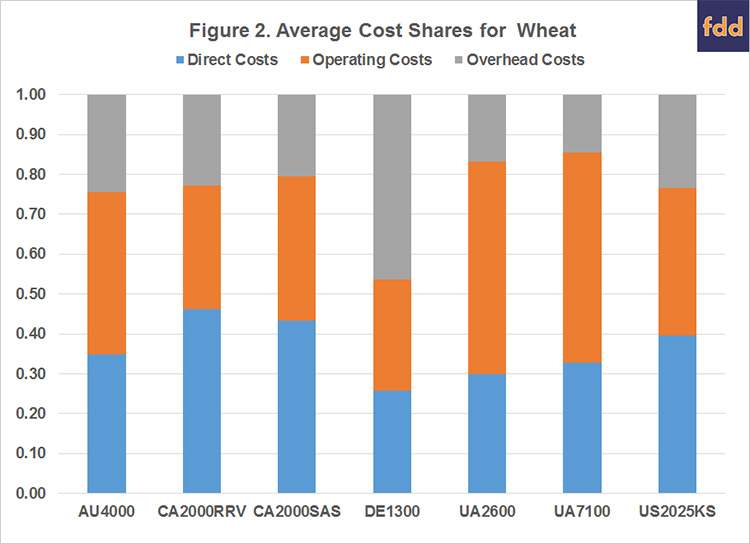
Figure 2. Average Cost Shares for Wheat
The average input cost shares were 36.1 percent for direct cost, 39.8 percent for operating cost, and 24.1 percent for overhead cost. The U.S. farm had below average cost shares for operating cost and overhead cost, and an above average cost share for direct cost. Crop establishment costs are a large proportion of direct cost. Figure 3 presents seed, fertilizer, and pesticide cost per hectare for each of the typical farms. The U.S. farm has the lowest pesticide cost per hectare. Compared to the U.S. farm, seed and fertilizer costs per hectare are relatively lower in Australia. As noted above, the German farm has by far the highest yield per hectare. However, its establishment cost ($488 per hectare) is more than 90 percent above the average for the seven typical farms.
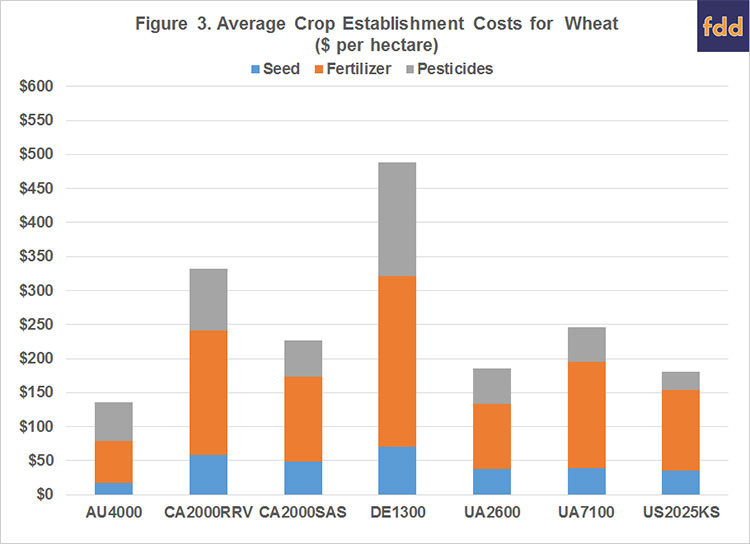
Figure 3. Average Crop Establishment Costs for Wheat ($ per hectare)
Revenue and Cost
Figure 4 presents average gross revenue and cost for each typical farm. Gross revenue and cost are reported as U.S. dollars per hectare. Wheat is a major enterprise on all of the typical farms presented in figure 4. It is obvious from figure 4 that gross revenue per hectare is substantially higher for the German farm. However, cost is also substantially higher for this farm. In fact, the German farm has the highest direct cost, operating cost, and overhead cost per hectare.
All of the typical farms had a positive average economic profit during the 2013 to 2015 period. Average economic profit ranged from $11 per hectare ($4 per acre) for the U.S. farm to $145 and $160 per hectare ($59 and $65 per acre) for the Ukraine farms. Despite having the lowest gross revenue per hectare, the Australian farm had an average economic profit of $53 per hectare ($21 per acre) during the three-year period.
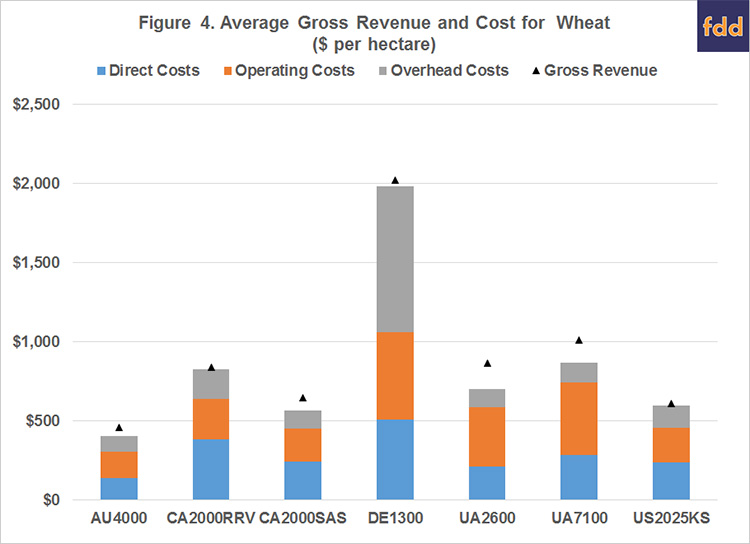
Figure 4. Average Gross Revenue and Cost for Wheat ($ per hectare)
Conclusions
This paper examined yield, gross revenue, and cost for farms with a wheat enterprise in the agri benchmark network from Australia, Canada, Germany, Ukraine, and United States. All of the typical farms analyzed had a positive average economic profit during the 2013 to 2015 period. The two typical farms from Ukraine had the highest economic profits during the three-year period.
References
Langemeier, M. “International Benchmarks for Soybean Production.” farmdoc daily (6):171, Department of Agricultural and Consumer Economics, University of Illinois at Urbana-Champaign, September 9, 2016.
Langemeier, M. “International Benchmarks for Corn Production.” farmdoc daily (6):167, Department of Agricultural and Consumer Economics, University of Illinois at Urbana-Champaign, September 2, 2016.
![]()
![]()
![]()
![]()
![]()
TAGS:
TEAM LINKS:
RELATED RESOURCES
UPCOMING EVENTS
We are taking a short break, but please plan to join us at one of our future programs that is a little farther in the future.