October 12, 2016
Impact of Lower Corn Prices on Feeding Cost of Gain and Cattle Finishing Net Returns
![]()
![]()
![]()
![]()
![]()
Both fed cattle and corn prices have dropped significantly during the last year. Specifically, since September 2015 fed cattle prices in Kansas have declined approximately 23 percent (from $137.35 to $106.07 per cwt), and corn prices have declined approximately 16 percent (from $3.88 to $3.25 per bushel). Using these prices, the fed cattle to corn price ratio has declined from 35.4 in September 2015 to 32.6 in September 2016. Lower corn prices along with a lower fed cattle to corn price ratio naturally lead to questions pertaining to the impact of corn price on feeding cost of gain and cattle finishing net returns, the topic of this article.
Feeding Cost of Gain
Figure 1 illustrates feeding cost of gain from January 2006 to August 2016. Feeding cost of gain information was obtained from monthly issues of the Focus on Feedlots newsletter. Feeding cost of gain averaged $85.16 per cwt. in 2015, and declined from $81.87 per cwt. in January of this year to $77.68 per cwt. in August. Given current corn and alfalfa price projections, feeding cost of gain is expected to range from $75 to $80 for the rest of 2016.
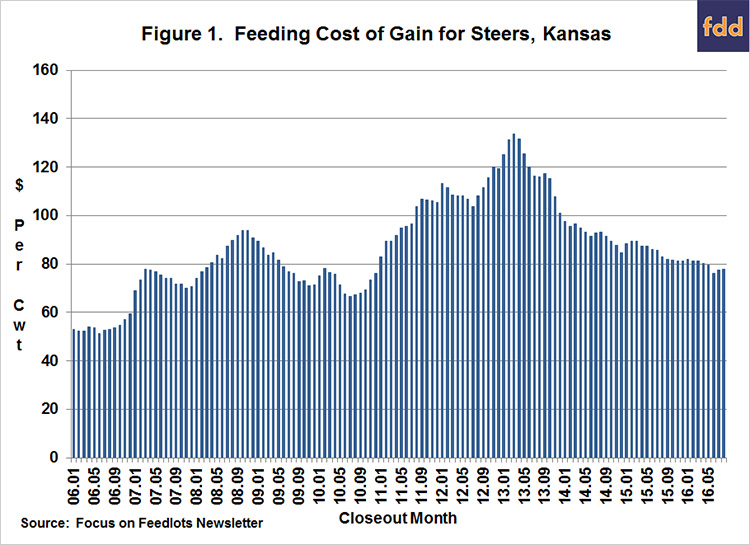
Figure 1. Feeding Cost of Gain for Steers, Kansas
Feeding cost of gain is sensitive to changes in feed conversions, corn prices, and alfalfa prices. Regression analysis was used to examine the relationship between feeding cost of gain, and feed conversion, corn prices, and alfalfa prices. Results are as follows: each 0.10 increase in feed conversion increases feeding cost of gain by $1.19 per cwt., each $0.10 per bushel increase in corn prices increases feeding cost of gain by $1.01 per cwt., and each $5 per ton increase in alfalfa prices increases feeding cost of gain by $0.62 per cwt. Using this information, the $0.60 decline in corn prices during the last year, holding all else constant, resulted in a decrease in feeding cost of gain of approximately $6 per cwt.
Feeder to Fed Price Ratio
Figure 2 illustrates the ratio of feeder prices to fed cattle prices from January 2006 to August 2016. Feeder cattle and fed cattle prices were obtained from theLivestock Marketing Information Center. The average ratio over this period was 1.195. The feeder to fed price ratio was one standard deviation below (above) this average for 13 (20) months during the ten-year period. The average net return for the months in which the ratio was below one standard deviation of the average was $72 per head. In contrast, the average loss for the months in which the ratio was above one standard deviation was $229 per head. Of the 20 months with a ratio above one standard deviation of the average, 15 months have occurred since January 2015.
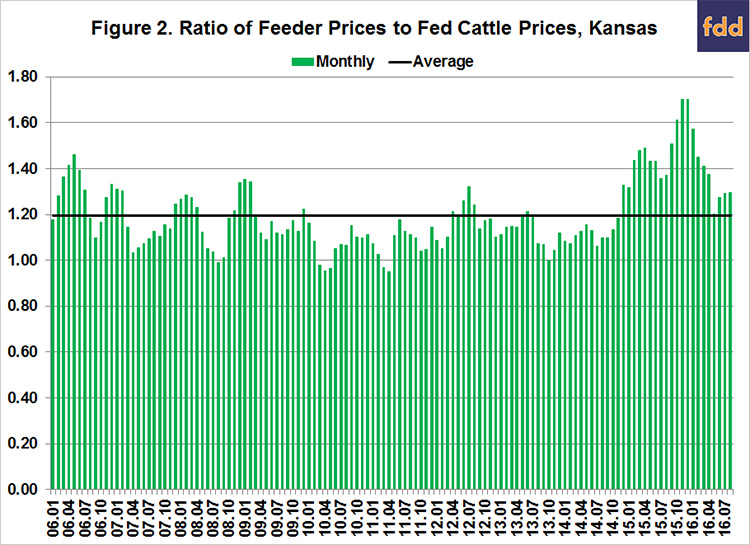
Figure 2. Ratio of Feeder Prices to Fed Cattle Prices, Kansas
As cattle feeders well know, if cattle are not purchased at the “right price”, losses will incur. Given the uncertainty in fed cattle prices, this is easier said than done. The strong correlation coefficient between cattle finishing net returns and the feeder to fed cattle price ratio almost guarantees that losses will occur when this ratio is relatively high.
Cattle Finishing Net Returns
Monthly cattle finishing net returns from January 2006 to August 2016 are presented in figure 3. It is important to note that net returns were computed using closeout months rather than placement months. Several data sources were used to compute net returns. Average daily gain, feed conversion, days on feed, in weight, out weight, and feeding cost of gain were obtained from the Focus on Feedlots newsletter, feeder cattle and fed cattle prices from the Livestock Marketing Information Center, and interest rates from the Federal Reserve Bank of Kansas City.

Figure 3. Historical Net Returns for Finishing Steers, Kansas
After a profitable run from October 2013 to November 2014, losses have been the norm. Average losses in 2015 were $247, and ranged from $56 per head in January to $521 per head in December. So far in 2016, net returns have ranged from a loss of $362 in January to a profit of $57 in May.
Correlation coefficients can be used to examine the relationship between net returns, feeding cost of gain, and the feeder to fed cattle price ratio. Correlation is a statistical measure of how variables move together and is bounded by -1.0 and 1.0. A value of -1.0 indicates two variables move together perfectly, but in opposite directions, while a value of 1.0 indicates two variables move up and down together proportionally. Values close to zero indicate two variables have little relationship to each other.
Net returns are significant and negatively correlated with feeding cost of gain (r = -0.146) and the feeder to fed cattle price ratio (r = -0.759). The strong correlation between net returns and the feeder to fed cattle ratio emphasizes the importance of purchasing feeders at the “right price”.
Cattle finishing net returns are sensitive to changes in feeding cost of gain and the feeder to fed cattle price ratio. Regression analysis was used to examine the relationship between these variables. Results are as follows: each $1 increase in feeding cost of gain results in a decrease in cattle finishing net returns of $1.99 per head, and each 1 percent increase in the feeder to fed cattle price ratio results in a decrease of $7.62 per head in cattle finishing net returns. Using relationships between corn prices, feeding cost of gain, and cattle finishing net returns; the $0.60 decline in corn prices during the last year, holding all else constant, resulted in an increase in cattle finishing net returns of approximately $12 per head.
Summary and Conclusions
This article examined the impact of lower corn prices on feeding cost of gain and cattle finishing net returns. Each $0.10 decrease in corn price results in a decrease in feeding cost of gain of approximately $1. In turn, each $1 decrease in feeding cost of gain results in a $2 per head increase in cattle finishing net returns. Using these values, holding all else constant, the $0.60 drop in corn prices since last August has resulted in a $6 per cwt. decline in feeding cost of gain and a $12 per head increase in cattle finishing net returns. The impact of lower corn prices on cattle finishing net returns may seem small to some industry observers. It is important note that the impact of lower corn prices on cattle finishing net returns is dampened by the fact that lower corn prices typically increase feeder prices. These relatively higher feeder prices adversely impact cattle finishing net returns. In summary, lower corn prices are helpful, but, unfortunately, they are only going to partially stem the red ink anticipated in the next few months.
References
Focus on Feedlots. Animal Sciences and Industry, Kansas State University, www.asi.k-state.edu/about/newsletters/focus-on-feedlots , accessed October 13, 2016.
Livestock Marketing Information Center, www.lmic.info/, accessed October 13, 2016.
![]()
![]()
![]()
![]()
![]()
TAGS:
TEAM LINKS:
RELATED RESOURCES
AgLease101.org helps both land owners and land operators learn about alternative lease arrangements and includes sample written lease agreements for several alternatives. Ag Lease 101 was created by and is maintained by the North Central Farm Management Extension Committee (NCFMEC).
READ MOREUPCOMING EVENTS
We are taking a short break, but please plan to join us at one of our future programs that is a little farther in the future.