February 12, 2019
Net Return Prospects for Cattle Finishing in 2019
by Michael Langemeier
![]()
![]()
![]()
![]()
![]()
After averaging $111 per head in 2017, net returns averaged a loss of $45 per head in 2018. The largest losses occurred in June and July, with losses of $126 and $108, respectively. Are the prospects for 2019 more positive? In addition to discussing net return prospects for cattle finishing in 2019, this article discusses trends in feeding cost of gain and the feeder to fed price ratio, key factors influencing changes in net returns.
Several data sources were used to compute net returns. Average daily gain, feed conversion, days on feed, in weight, out weight, and feeding cost of gain were obtained from monthly issues of the Focus on Feedlots newsletter. Futures prices for corn and seasonal feed conversion rates were used to project feeding cost of gain for the next several months. Net returns were computed using feeding cost of gain from monthly issues of the Focus on Feedlots newsletter, fed cattle prices and feeder cattle prices reported by the Livestock Marketing Information Center (LMIC), and interest rates from the Federal Reserve Bank of Kansas City.
Figure 1 illustrates monthly feeding cost of gain from January 2009 to December 2018. Feeding cost of gain averaged $78.10 per cwt. in 2018 ranging from a low of $74.87 in May to a high of $80.31 in December. Given current corn and alfalfa price projections, feeding cost of gain is expected to range from $79 to $82 during the first 6 months of 2019. Feeding cost of gain is sensitive to changes in feed conversions, corn prices, and alfalfa prices. Regression analysis was used to examine the relationship between feeding cost of gain, and feed conversion, corn prices, and alfalfa prices. Results are as follows: each 0.10 increase in feed conversion increases feeding cost of gain by $1.43 per cwt., each $0.10 per bushel increase in corn prices increases feeding cost of gain by $0.87 per cwt., and each $5 per ton increase in alfalfa prices increases feeding cost of gain by $0.55 per cwt.
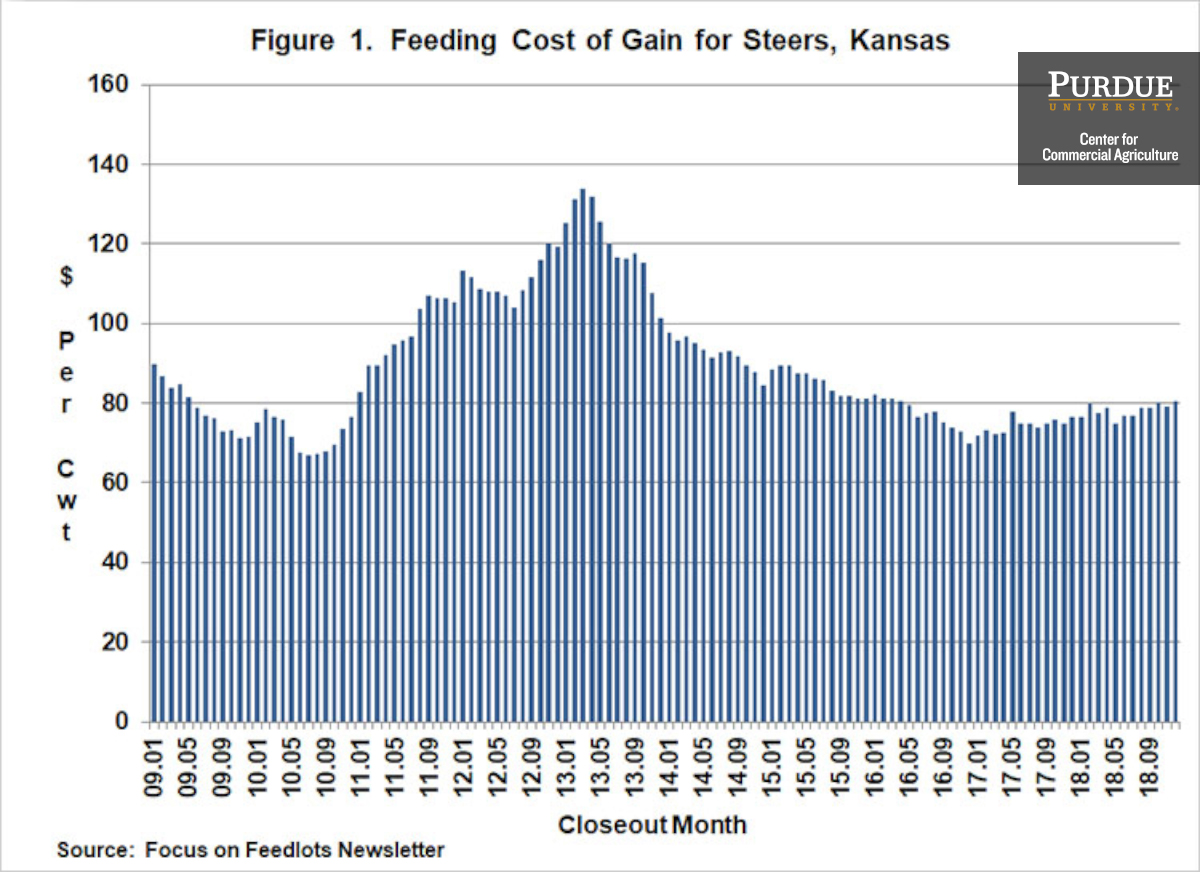
Figure 1. Feeding Cost of Gain for Steers, Kansas
The ratio of feeder to fed cattle prices for the last ten years is illustrated in Figure 2. During the ten-year period, this ratio averaged 1.20. The feeder to fed price ratio was one standard deviation below (above) this average for 13 (18) months during the ten-year period. The average net return for the months in which the ratio was below one standard deviation of the average was $159 per head. In contrast, the average loss for the months in which the ratio was above one standard deviation was $238 per head. The average ratio for the 18 months with a feeder to fed price ratio that was above one standard deviation of the ten-year average was 1.35. Given current price projections, the feeder to fed price ratio is not expected to reach these levels. However, the projected ratio is expected to remain above the ten-year average for most of 2019, with the exception being June. If these ratios materialize, we would expect at least small losses during these months. Of course, an unexpected increase in fed cattle prices would create a downward spike in this price ratio and would improve the outlook for net returns.
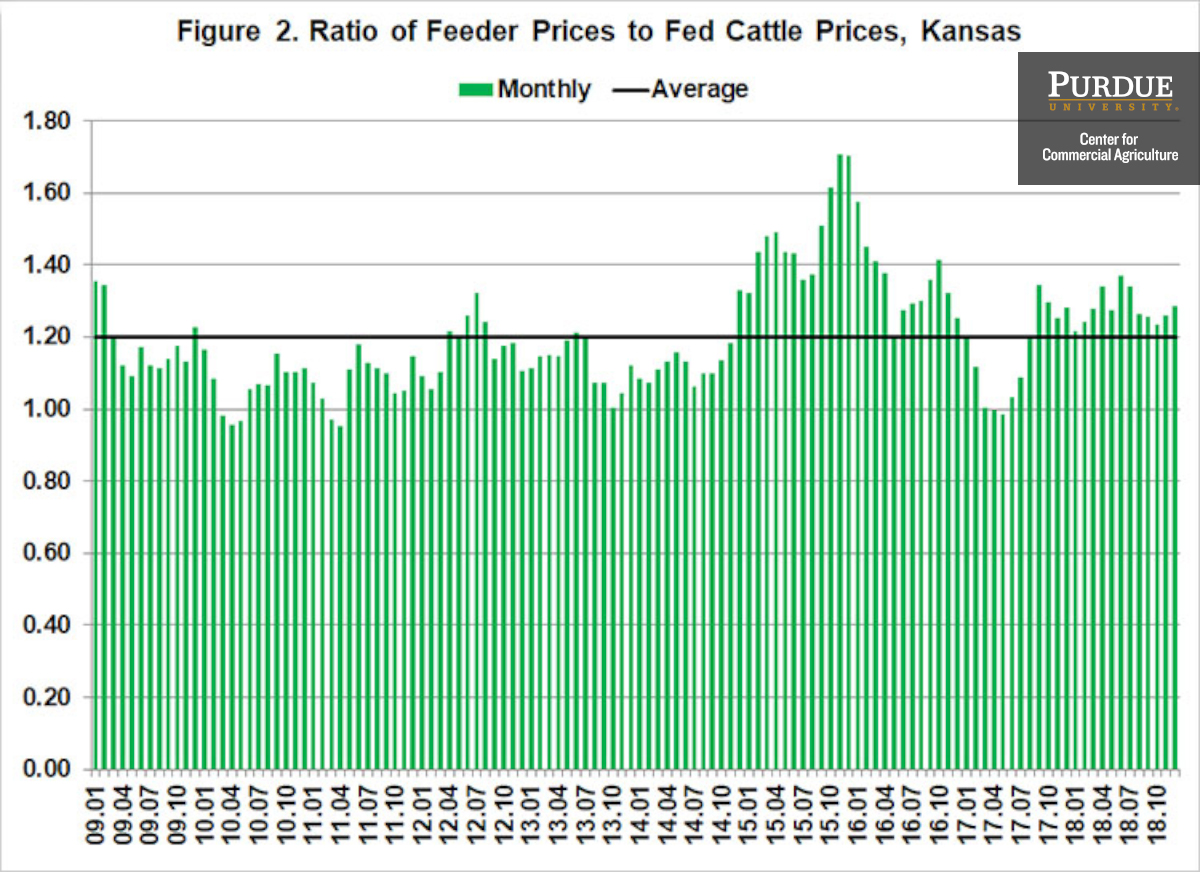
Figure 2. Ratio of Feeder Prices to Fed Cattle Prices, Kansas
Monthly steer finishing net returns from January 2009 to December 2018 are presented in Figure 3. It is important to note that net returns were computed using closeout months rather than placement months. Net returns averaged $111 per head in 2017 and a negative $45 per head in 2018. Historical and breakeven prices for the last ten years, as well as projected breakeven prices for 2019 are illustrated in Figure 4. Breakeven prices in the first quarter of 2019 are expected to range from $124 to $126 per cwt. Breakeven prices for the rest of the year are expected to be considerably lower than this range. For the second quarter, breakeven prices are expected to range from $116 to $121 while during the second half of 2019 the expected range drops to $116 to $119 per cwt. Current fed cattle price projections suggest that breakeven prices during the first half of 2019 will result in average losses of approximately $25 per head. Turning to the second half of 2019, average losses in the third quarter are expected to be larger than $25 per head while net returns in the fourth quarter are expected to be close to breakeven.
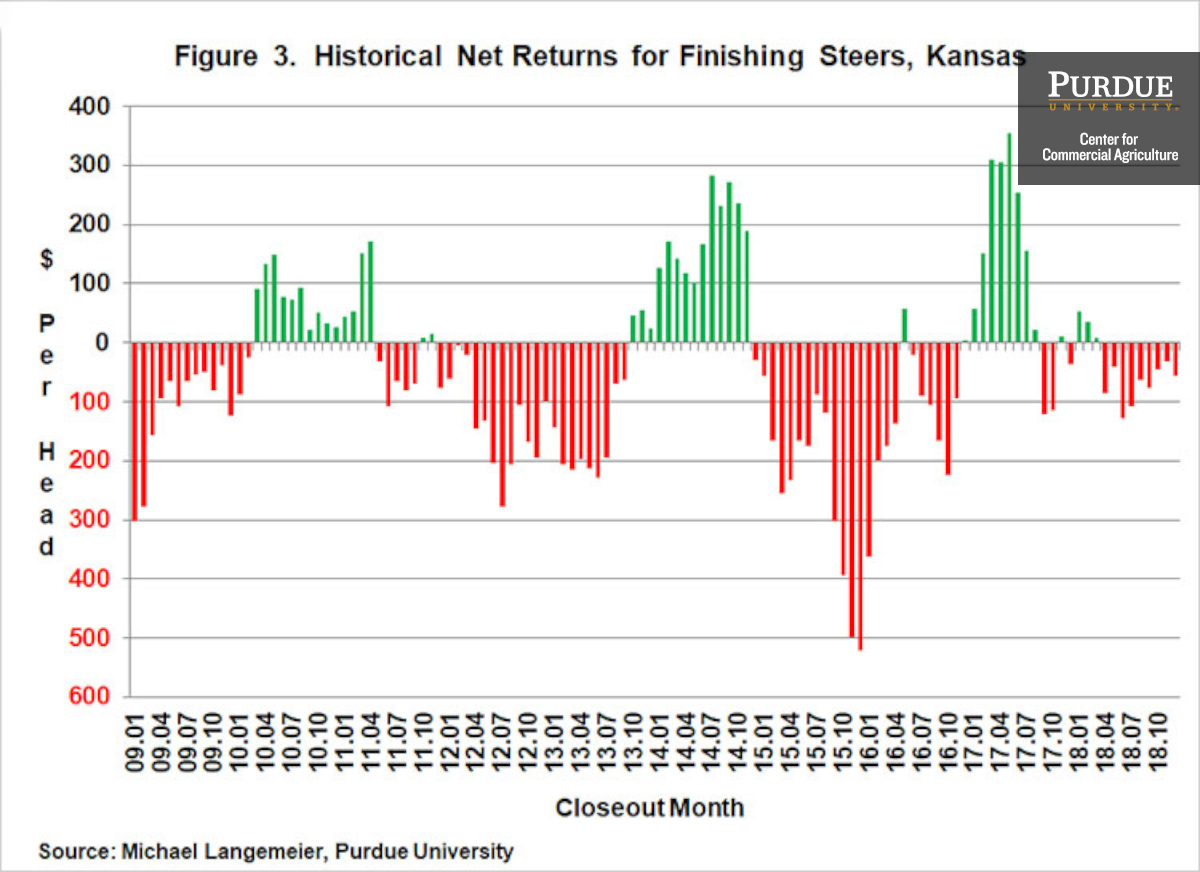
Figure 3. Historical Net Returns for Finishing Steers, Kansas
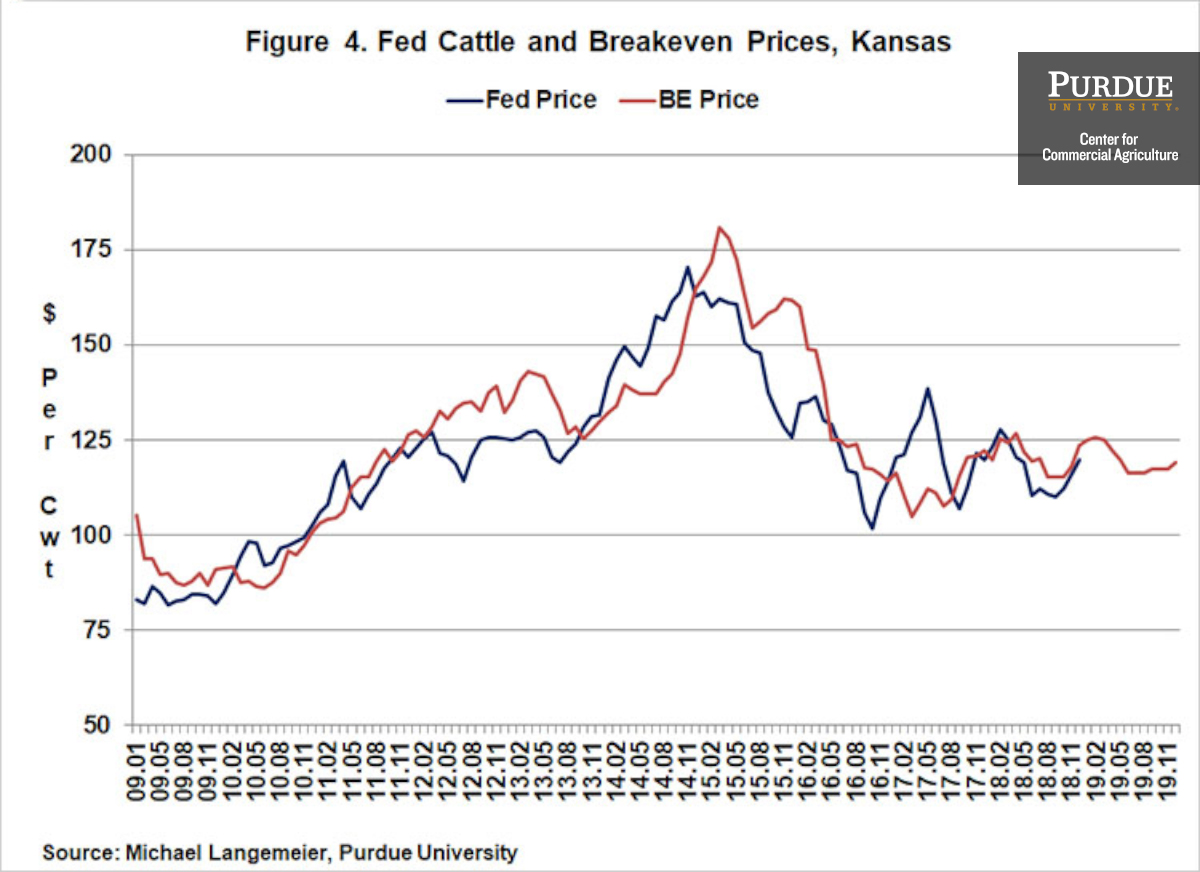
Figure 4. Fed Cattle and Breakeven Prices, Kansas
This article discussed recent trends in feeding cost of gain, the feeder to fed price ratio, and cattle finishing net returns. Average cattle finishing losses in 2018 were $45 per head. Current breakeven and fed cattle price projections suggest that losses will continue into 2019. Given the recent stability in feeding cost of gain, net return projections for the next few months are primarily driven by the feeder to fed price ratio. For net returns to positive in 2019, fed cattle prices will need to approach $125 per cwt. in the first quarter, $120 per cwt. in the second quarter, and $118 per cwt. in the third and fourth quarters of 2019.
References
Focus on Feedlots, Animal Sciences and Industry, Kansas State University, www.asi.k-state.edu/about/newsletters/focus-on-feedlots, accessed March 6, 2019.
Livestock Marketing Information Center, www.lmic.info, accessed March 6, 2019.
![]()
![]()
![]()
![]()
![]()
TAGS:
TEAM LINKS:

RELATED RESOURCES
AgLease101.org helps both land owners and land operators learn about alternative lease arrangements and includes sample written lease agreements for several alternatives. Ag Lease 101 was created by and is maintained by the North Central Farm Management Extension Committee (NCFMEC).
READ MOREUPCOMING EVENTS
We are taking a short break, but please plan to join us at one of our future programs that is a little farther in the future.