May 12, 2019
International Benchmarks for Corn Production (2019)
by Michael Langemeier and Rachel Purdy
![]()
![]()
![]()
![]()
![]()
Examining the competitiveness of corn production in different regions of the world is often difficult due to lack of comparable data and agreement regarding what needs to be measured. To be useful, international data needs to be expressed in common production units and converted to a common currency. Also, production and cost measures need to be consistently defined across production regions or farms.
This paper examines the competitiveness of corn production for important international corn regions using 2013 to 2017 data from the agri benchmarknetwork. Earlier papers examined international benchmarks for the 2012 to 2014 period (here), the 2013 to 2015 period (here), and the 2013 to 2016 period (here).
The agri benchmark network collects data on beef, cash crops, dairy, pigs and poultry, horticulture, and organic products. There are 40 countries represented in the cash crop network. The agri benchmark concept of typical farms was developed to understand and compare current farm production systems around the world. Participant countries follow a standard procedure to create typical farms that are representative of national farm output shares and categorized by production system or combination of enterprises and structural features.
Data from seven typical farms with corn enterprise data from Argentina, Brazil, Russia, Ukraine, and United States were used in this paper. It is important to note that corn enterprise data is collected from other countries. For more information, visit the agri benchmark website (here). These five countries were selected to simplify the illustration of costs and discussion.
The farm and country abbreviations used in this paper are listed in table 1. While the farms may produce a variety of crops, this paper only considers corn production. Typical farms used in the agri benchmark network are defined using country initials and hectares on the farm. There are five U.S. farms with corn in the network. The two Indiana farms used to illustrate corn production in this paper were the west central Indiana (US1215INC) typical farm and the southern Indiana (US1215INS) typical farm. One Iowa typical farm (US700) was also selected for this analysis.
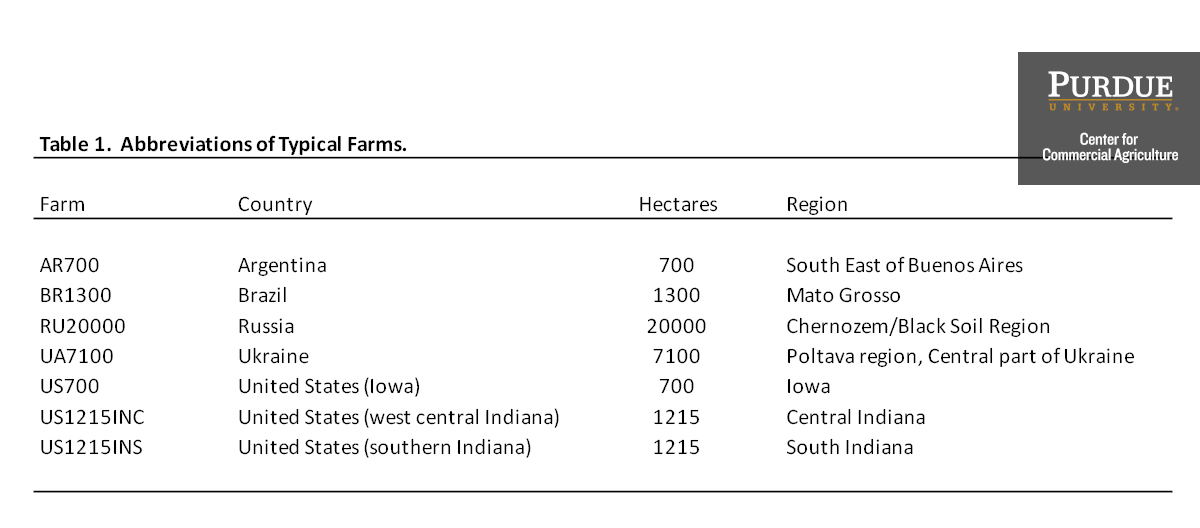
Table 1. Abbreviations of Typical Farms.
Corn Yields
Although yield is only a partial gauge of performance, it reflects the available production technology across farms. Average corn yield for the farms in 2013 to 2017 was 139.3 bushels per acre (8.75 metric tons per hectare). Average farm yields ranged from approximately 92.6 bushels per acre for the Russian typical farm (5.81 metric tons per hectare) to 191.4 bushels per acre for the Iowa typical farm (12.01 metric tons per hectare). Figure 1 illustrates average corn yield for each typical farm. All of the U.S. farms had average corn yields above 175.0 bushels per acre (10.98 metric tons per hectare). The range of yields, for U.S. farms, was within 15.2 bushels per acre (0.95 metric tons per hectare). It is important to note that corn is the second crop of the year for the typical farms in Argentina and Brazil.
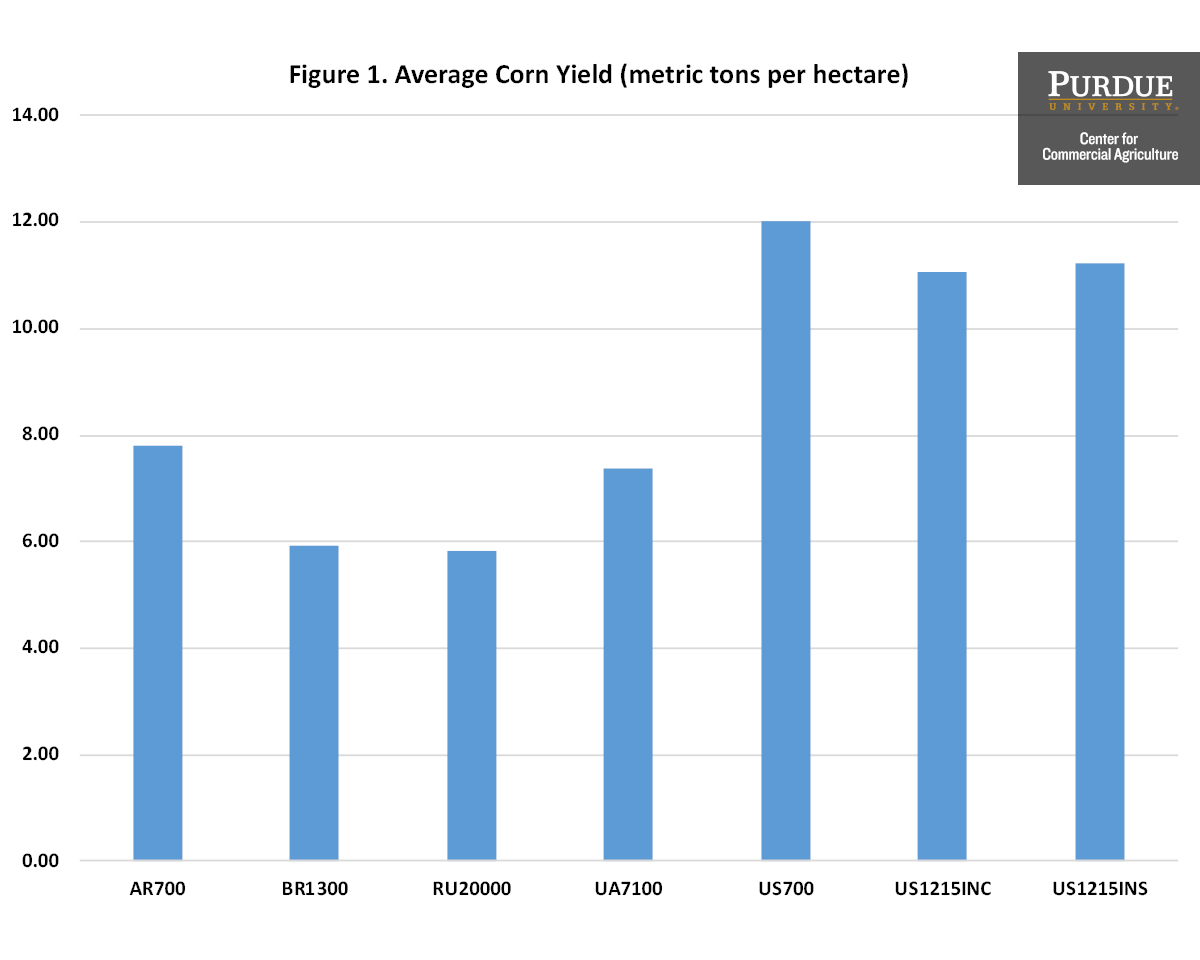
Figure 1. Average Corn Yield (metric tons per hectare)
Input Cost Shares
Due to differences in technology adoption, input prices, fertility levels, efficiency of farm operators, trade policy restrictions, exchange rate effects, and labor and capital market constraints, input use varies across corn farms. Figure 2 presents the average input cost shares for each farm. Costs included both cash and opportunity costs. Cost shares were broken down into three major categories: direct costs, operating costs, and overhead costs. Direct costs included seed, fertilizer, crop protection, crop insurance, and interest on these cost items. Operating cost included labor, machinery depreciation and interest, fuel, and repairs. Overhead cost included land, building depreciation and interest, property taxes, general insurance, and miscellaneous cost.
The average input cost shares were 43.1 percent for direct cost, 32.5 percent for operating cost, and 24.4 percent for overhead cost. The typical farms from Russia, Ukraine, and Iowa had below average cost shares for direct cost, while the typical Brazilian farm and the Southern Indiana farm had the highest average direct cost shares. Direct cost shares ranged from 35.4 percent for the Iowa typical farm to 50.9 percent for the Brazilian typical farm. The typical farms from Argentina, Brazil, and United States had below average cost shares for operating cost. The typical Russia farm and Ukraine farm had above average operating cost shares. The typical Russian farm had the highest operating cost share at 57.3 percent. The typical farms from Brazil, Russia, and Ukraine had below average cost shares for overhead cost. The Iowa farm had the highest share of overhead cost, at 38.3 percent, followed by the west central Indiana farm at 33.8 percent. The relatively large cost shares for overhead cost in the U.S. were the result of relatively high land costs.
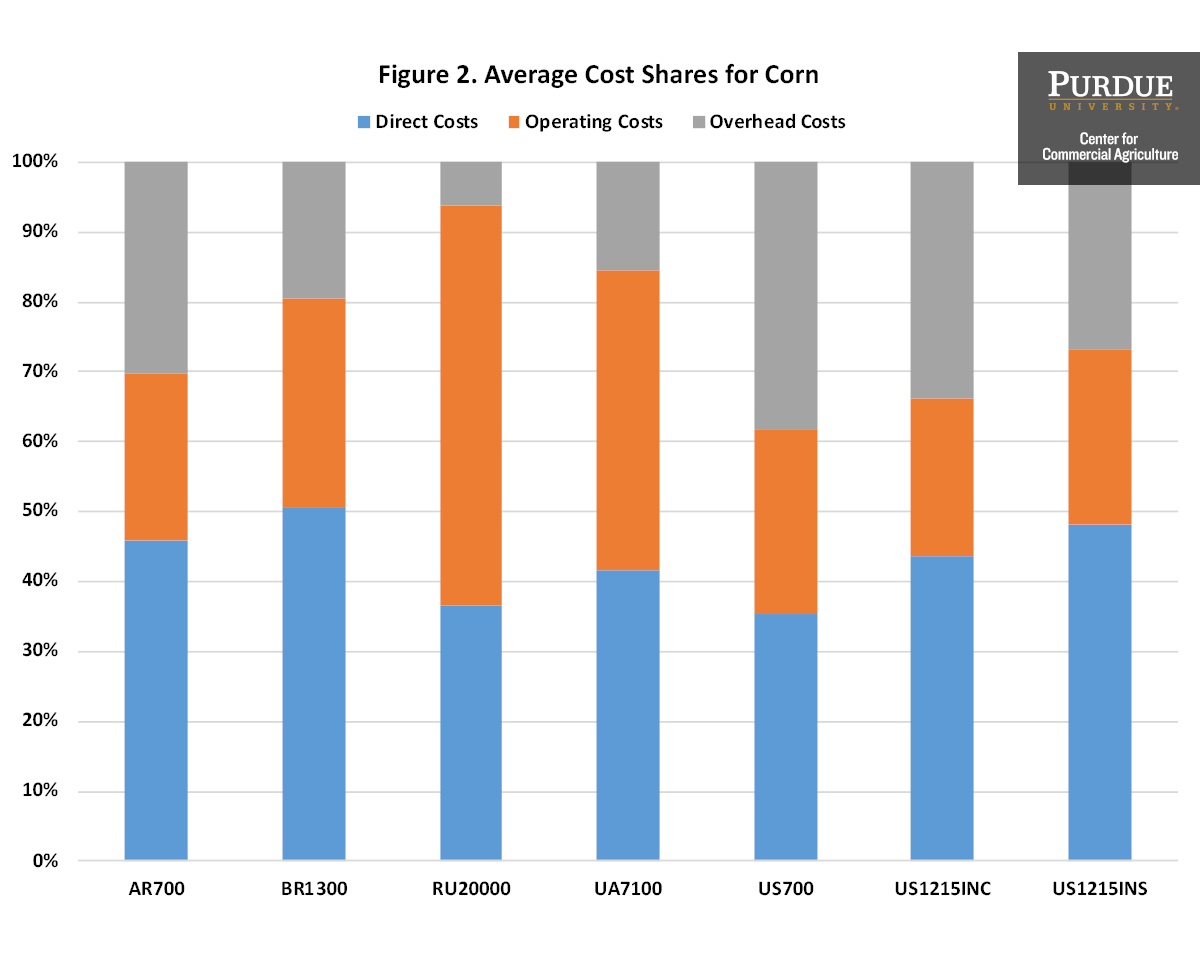
Figure 2. Average Cost Shares for Corn
Revenue and Cost
Figures 3 and 4 present average gross revenue and cost per hectare and per ton for each typical farm. Gross revenue and cost are reported in U.S. dollars for each typical farm. It is obvious from figures 3 and 4 that gross revenue was substantially higher for the typical farms in United States and Ukraine. However, cost is also substantially higher for the U.S. typical farms. The typical farms from Argentina, Russia, and Ukraine exhibited economic profits during the five-year period of $107, $15, and $93 per acre, respectively ($264, $38, and $231 per hectare, respectively). Average losses for the typical farms from Brazil, Iowa, west central Indiana, and southern Indiana were $57, $64, $90, and $24 per acre, respectively, during the five-year period ($141, $159, $222, and $60 per hectare, respectively). Over the five-year period, the largest loss occurred in 2015 for the west central Indiana farm, at $194 per acre ($479 per hectare). The typical Argentina farm earned the largest profit in 2016 at $224 per acre ($553 per hectare).
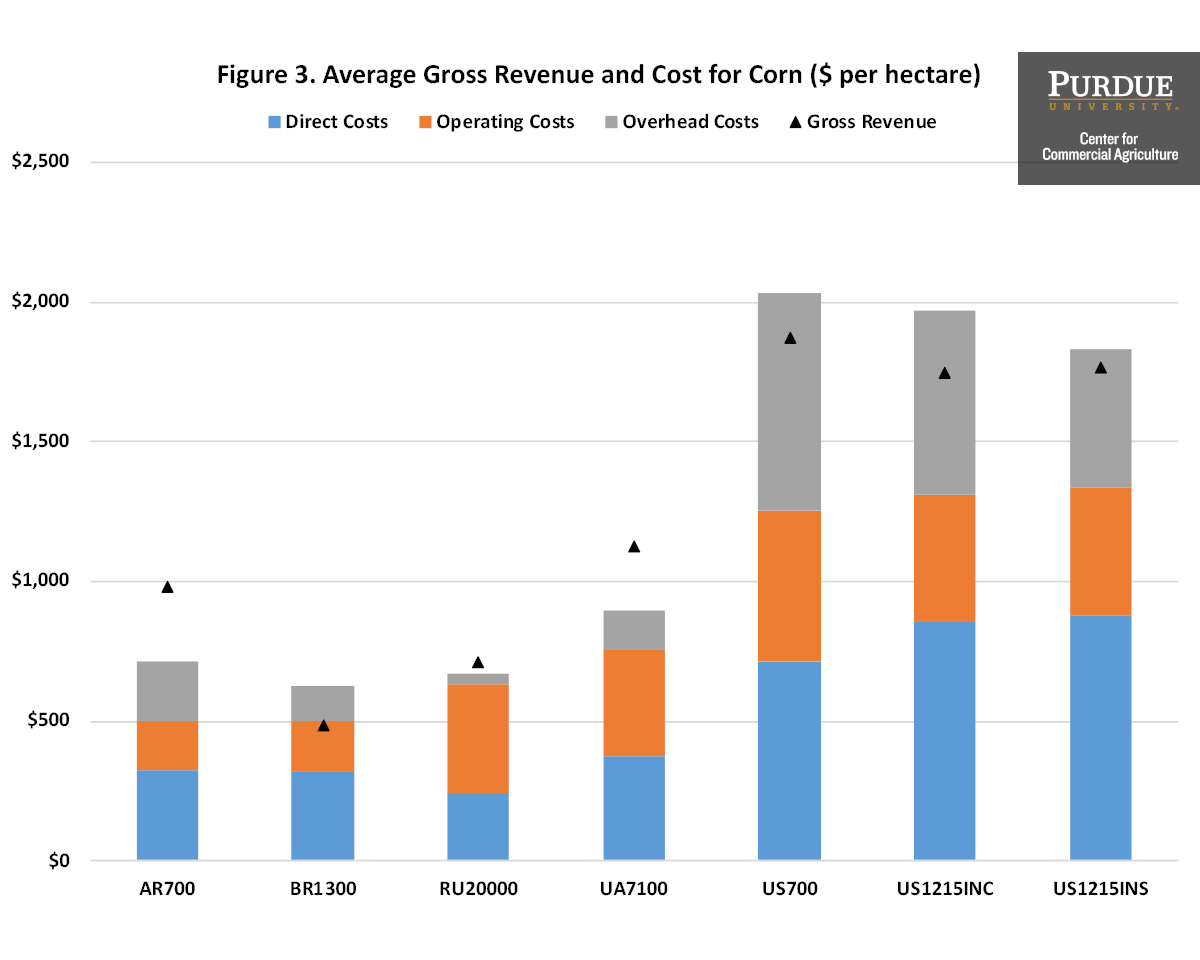
Figure 3. Average Gross Revenue and Cost for Corn ($ per hectare)
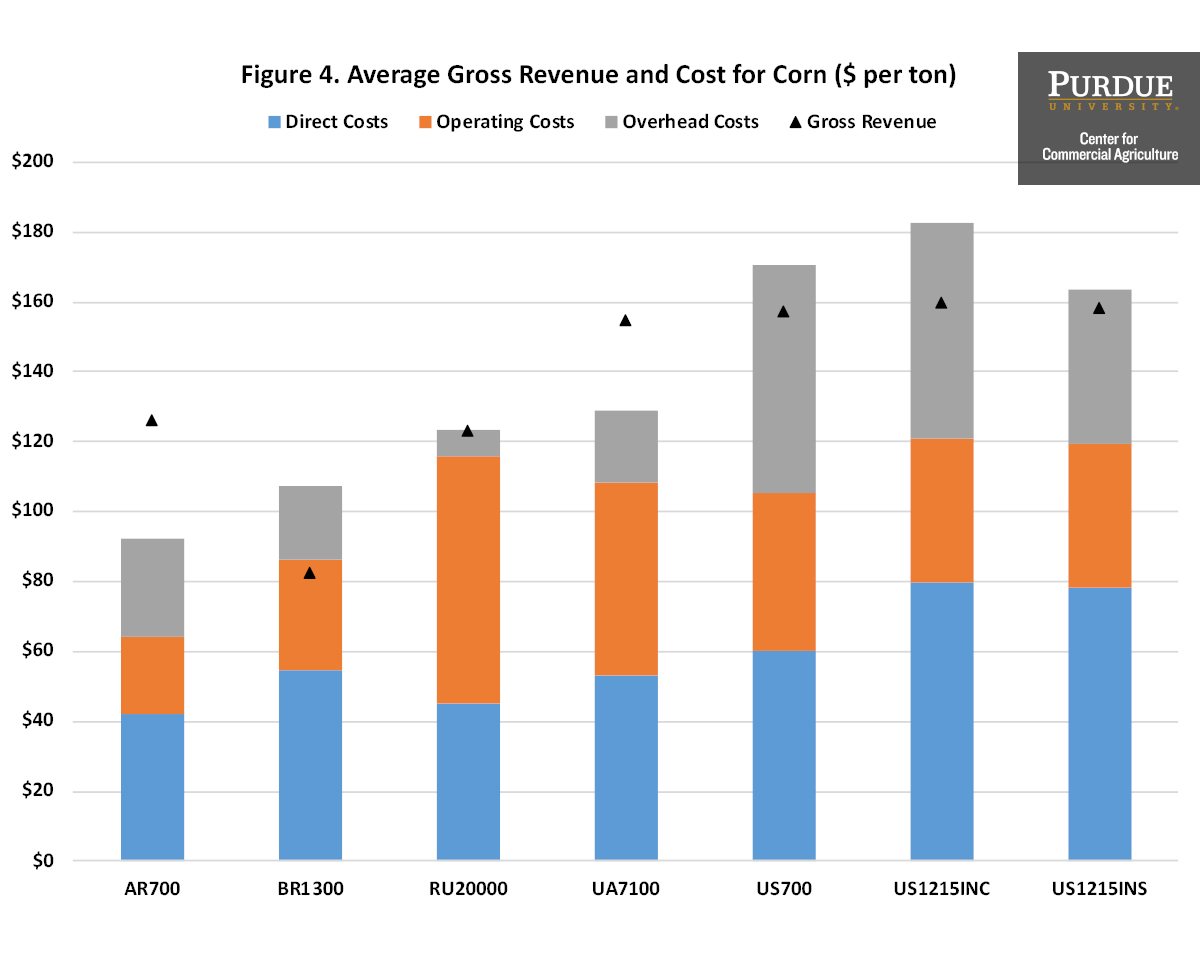
Figure 4. Average Gross Revenue and Cost for Corn ($ per ton)
Conclusions
This paper examined yield, gross revenue, and cost for farms in the network from Argentina, Brazil, Russia, Ukraine, and the United States with corn enterprise data. Yield, gross revenue, and cost were substantially higher for the U.S. farms. The typical farms in Argentina, Russia, and Ukraine exhibited a positive average economic profit during the 2013 to 2017 period.
References
Agri benchmark. http://www.agribenchmark.org/home.html. Retrieved on 4/30/19.
Langemeier, M. “International Benchmarks for Corn Production.” Center for Commercial Agriculture, Purdue University, September 2016.
Langemeier, M., and E. Lunik. “International Benchmarks for Corn Production.” Center for Commercial Agriculture, Purdue University, November 2015.
Purdy, R. and M. Langemeier. “International Benchmarks for Corn Production.” Center for Commercial Agriculture, Purdue University, June 2018.
![]()
![]()
![]()
![]()
![]()
TAGS:
TEAM LINKS:


RELATED RESOURCES
UPCOMING EVENTS
We are taking a short break, but please plan to join us at one of our future programs that is a little farther in the future.