May 12, 2019
International Benchmarks for Wheat Production (2019)
by Michael Langemeier and Rachel Purdy
![]()
![]()
![]()
![]()
![]()
Examining the competitiveness of wheat production in different regions of the world is often difficult due to lack of comparable data and consensus regarding what needs to be measured. To be useful, international data needs to be expressed in common production units and converted to a common currency. Also, production and cost measures need to be consistently defined across production regions or farms.
This paper examines the competitiveness of wheat production for important international wheat regions using 2013 to 2017 data from the agri benchmark network. Earlier work examined international benchmarks for the 2013 to 2015 period (here) and the 2013 to 2016 period (here). The agri benchmark network collects data on beef, cash crops, dairy, pigs and poultry, horticulture, and organic products. There are 40 countries represented in the cash crop network. The agri benchmark concept of typical farms was developed to understand and compare current farm production systems around the world. Participant countries follow a standard procedure to create typical farms that are representative of national farm output shares and categorized by production system or combination of enterprises and structural features.
The sample of farms used in this paper was comprised of ten typical farms from Argentina, Australia, Canada, Germany, Russia, Ukraine, and United States. The farm and country abbreviations used in this paper are listed in table 1. Typical farms used in the agri benchmark network are defined using country initials and hectares on the farm. It is important to note that wheat enterprise data is collected from other countries. The seven countries represented in table 1 were selected to simplify the illustration of costs and discussion. There are three U.S. farms with wheat in the network. The U.S. farms used to illustrate wheat production in this paper are the western Kansas farm (US2025KS) and the southern Indiana farm (US1215INS). The southern Indiana farm produced double-crop soybeans on the wheat acres.
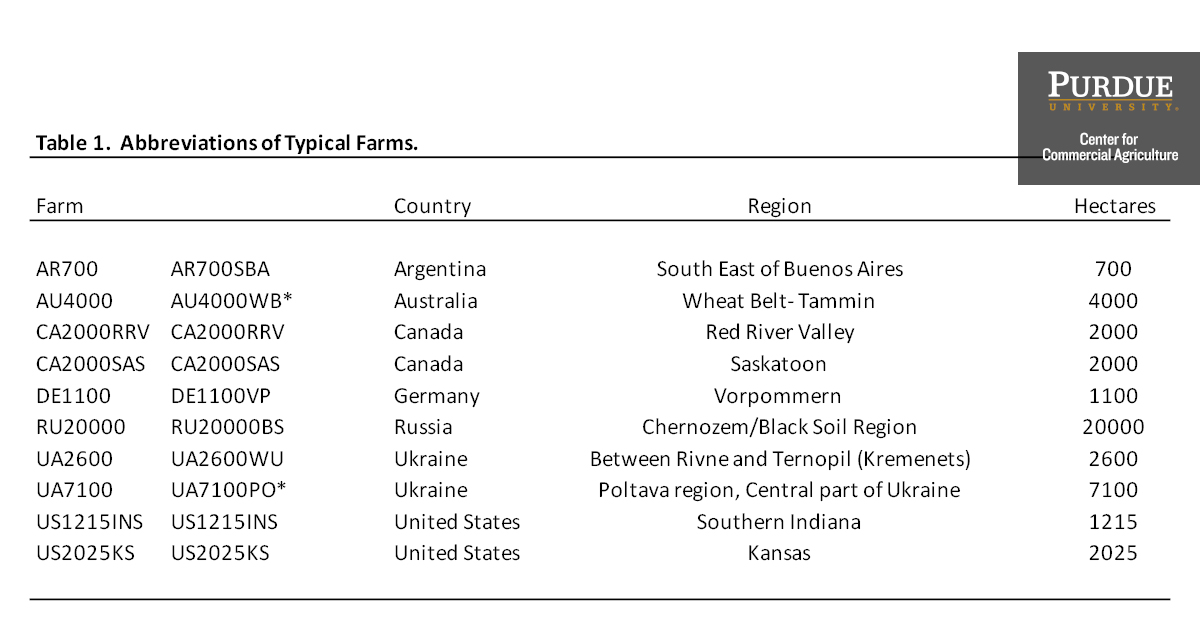
Table 1. Abbreviations of Typical Farms.
All of the typical farms listed in table 1 produced multiple crops. The Argentine farm produced soybeans, corn, sunflowers, and winter wheat. The Australian farm produced barley, fodder, rapeseed, and summer wheat. The Canadian farm located in the Red River Valley produced barley, rapeseed, soybeans, summer wheat, and winter wheat. The Canadian farm located in Saskatchewan produced linseed, oats, peas, rapeseed, barley, and summer wheat. The German farm produced rapeseed, barley, corn silage, and winter wheat. The smaller Ukraine farm produced corn, rapeseed, soybeans, sunflowers, and winter wheat. The larger Ukraine farm produced corn, soybeans, sunflowers, and winter wheat. The southern Indiana farm produced corn, soybeans, and winter wheat. The Kansas farm produced corn (both irrigated and non-irrigated) and winter wheat.
Wheat Yields
Although yield is only a partial gauge of performance, it reflects the available production technology across farms. Average wheat yield for the farms in 2013 to 2017 was 65.3 bushels per acre (4.39 metric tons per hectare). Figure 1 illustrates average wheat yield per hectare for each typical farm. Average farm yields ranged from approximately 29 bushels per acre (1.95 metric tons per hectare) for the typical farm in Australia to 119.1 bushels per acre (8.01 metric tons per hectare) for the German farm. The Indiana farm had an average yield of 65.5 bushels per acre (4.41 metric tons per hectare) while the Kansas farm had an average yield of 40.4 bushels per acre (2.71 metric tons per hectare).
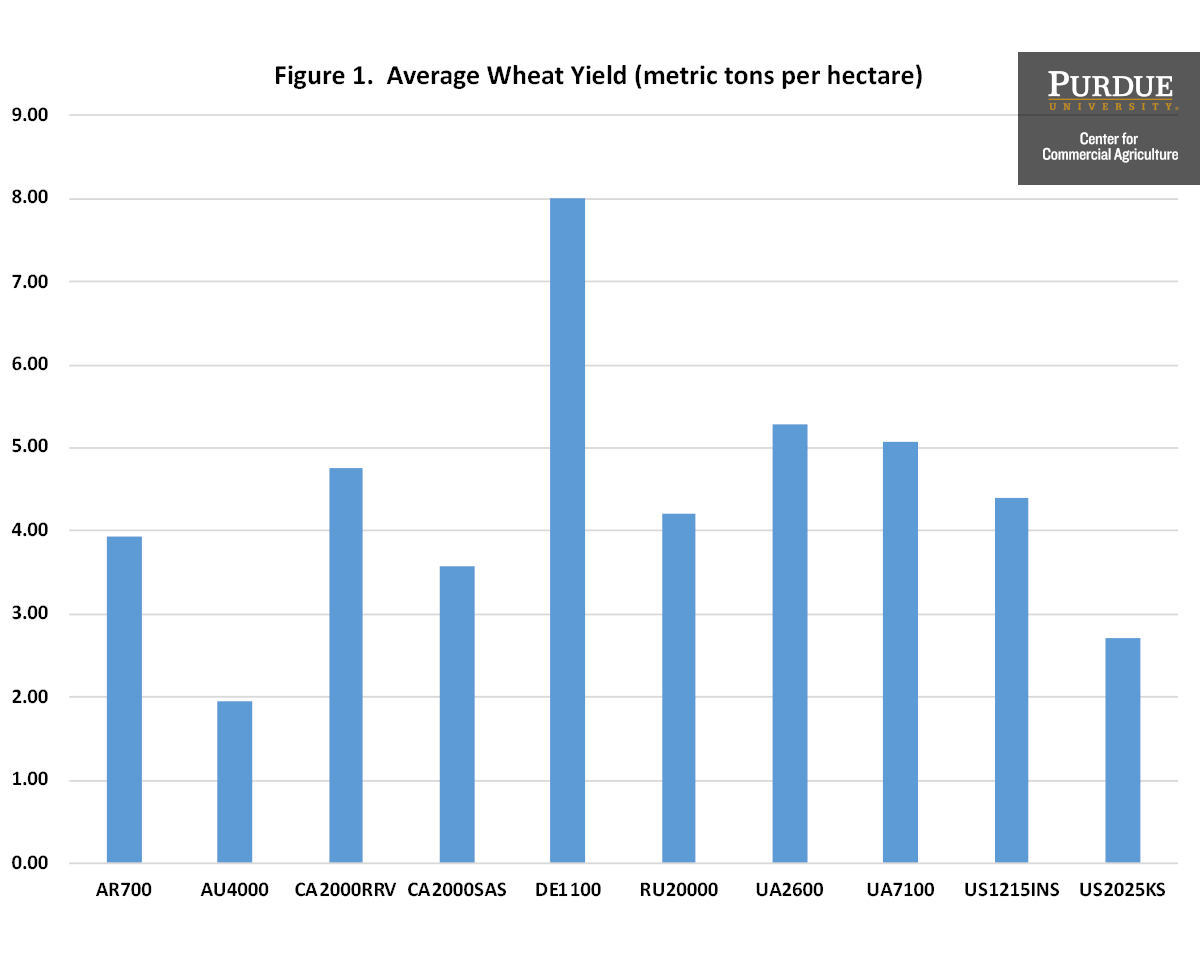
Figure 1. Average Wheat Yield (metric tons per hectare)
Input Cost Shares
Due to differences in technology adoption, input prices, fertility levels, efficiency of farm operators, trade policy restrictions, exchange rate effects, and labor and capital market constraints, input use varied widely across the typical wheat farms. Figure 2 presents the average input cost shares for each farm. Cost shares were broken down into three major categories: direct costs, operating costs, and overhead costs. Direct costs included seed, fertilizer, crop protection, crop insurance, and interest on these cost items. Operating cost included labor, machinery depreciation and interest, fuel, and repairs. Overhead cost included land, building depreciation and interest, property taxes, general insurance, and miscellaneous cost.
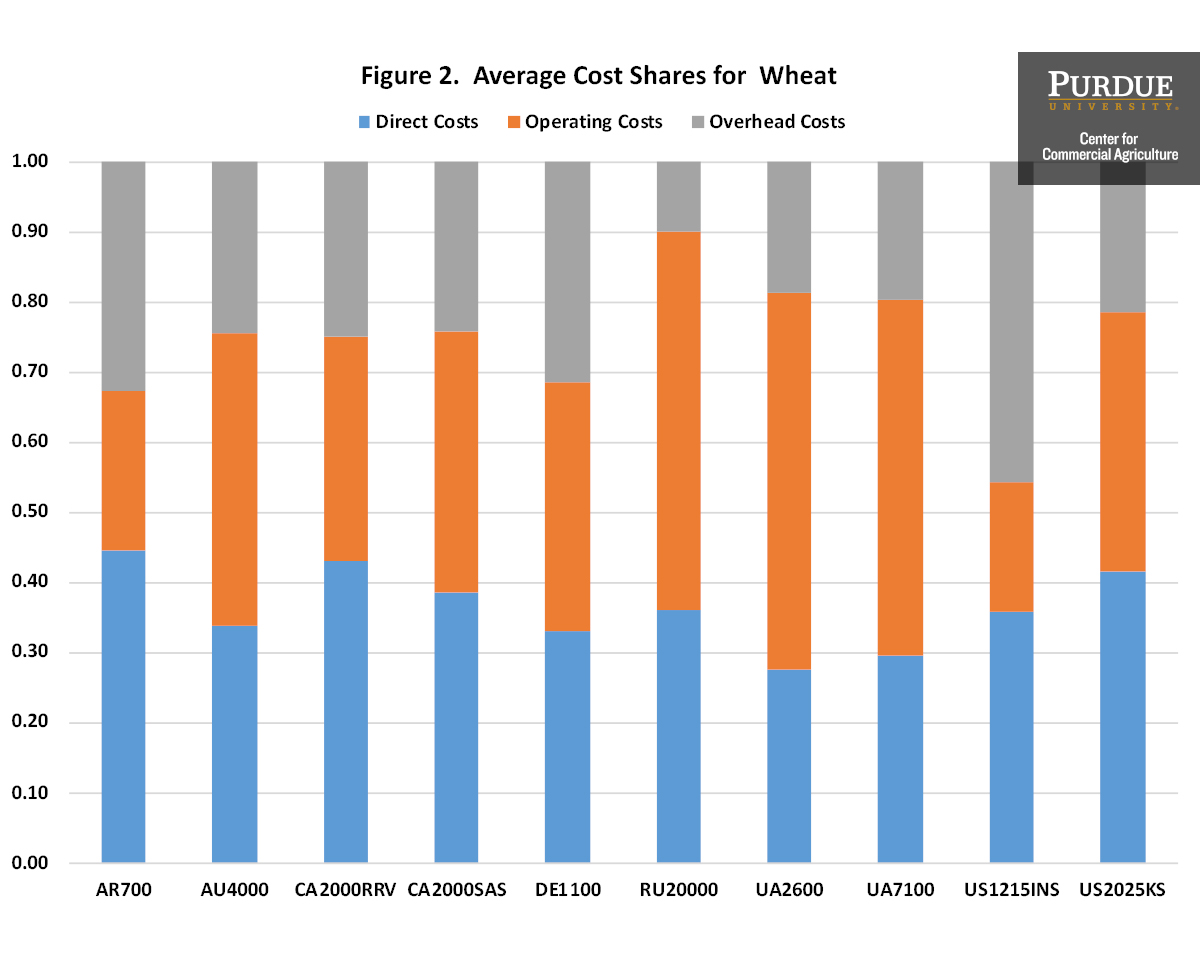
Figure 2. Average Cost Shares for Wheat
The average input cost shares were 36.5 percent for direct cost, 38.3 percent for operating cost, and 25.3 percent for overhead cost. The Kansas farm had an above average cost share for direct cost at 41.6 percent, and a below average cost share for operating cost and overhead cost. The Argentina farm had the highest average cost share for direct costs, at 44.7 percent. The Indiana farm had the highest average cost share for overhead cost at 45.7 percent, and the lowest average cost share for operating cost at 18.3 percent. The German farm also had a relatively high cost share for overhead cost, at 31.4 percent. The relatively large cost share for overhead cost in Indiana and Germany largely reflects relatively high land costs. The Russian farm had the lowest average cost share for overhead cost, at 10 percent.
Crop establishment costs are a large proportion of direct cost. Figures 3 and 4 present seed, fertilizer, and pesticide cost (i.e., crop establishment cost) per hectare and per ton for each of the typical farms. Compared to the other typical farms, seed and fertilizer costs per hectare are relatively low in Australia. As noted above, the German farm had, by far, the highest yield per hectare. However, its crop establishment cost ($523 per hectare) is more than double the average crop establishment cost of the other typical farms in the sample. Of the farms selected, the German farm had the highest fertilizer and pesticide costs per hectare. On a per hectare basis, the Indiana farm had the lowest pesticide cost, but this farm also had the highest seed cost. The Indiana farm’s seed costs were more than double the average seed cost. On a per ton basis, crop establishment costs were below average for the German, Russian, and Ukrainian farms.
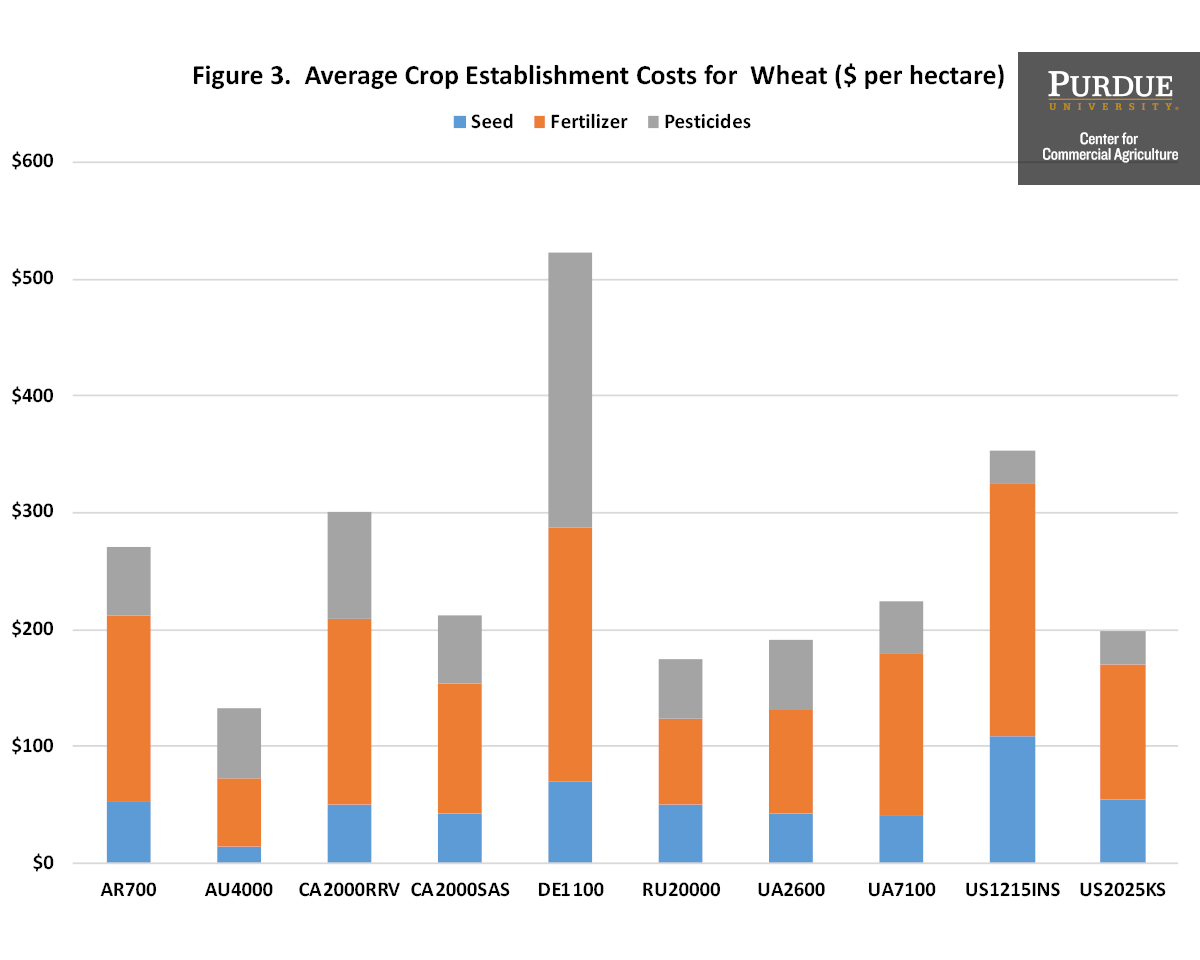
Figure 3. Average Crop Establishment Costs for Wheat ($ per hectare)

Figure 4. Average Crop Establishment Costs for Wheat ($ per ton)
Revenue and Cost
Figures 5 and 6 present average gross revenue and cost per hectare and per ton for each typical farm. Gross revenue and cost are reported as U.S. dollars per hectare and per ton. Wheat is a major enterprise on all of the typical farms presented in figures 5 and 6. It is obvious from figures 5 and 6 that gross revenue per hectare and per ton are relatively high for the German farm. However, cost is also high for this farm. In fact, the German farm had the highest direct cost, operating cost, and overhead cost per hectare ($535, $573, and $506 per hectare, respectively). However, on a per ton basis, the German farm had below average direct and operating costs, and above average overhead cost.
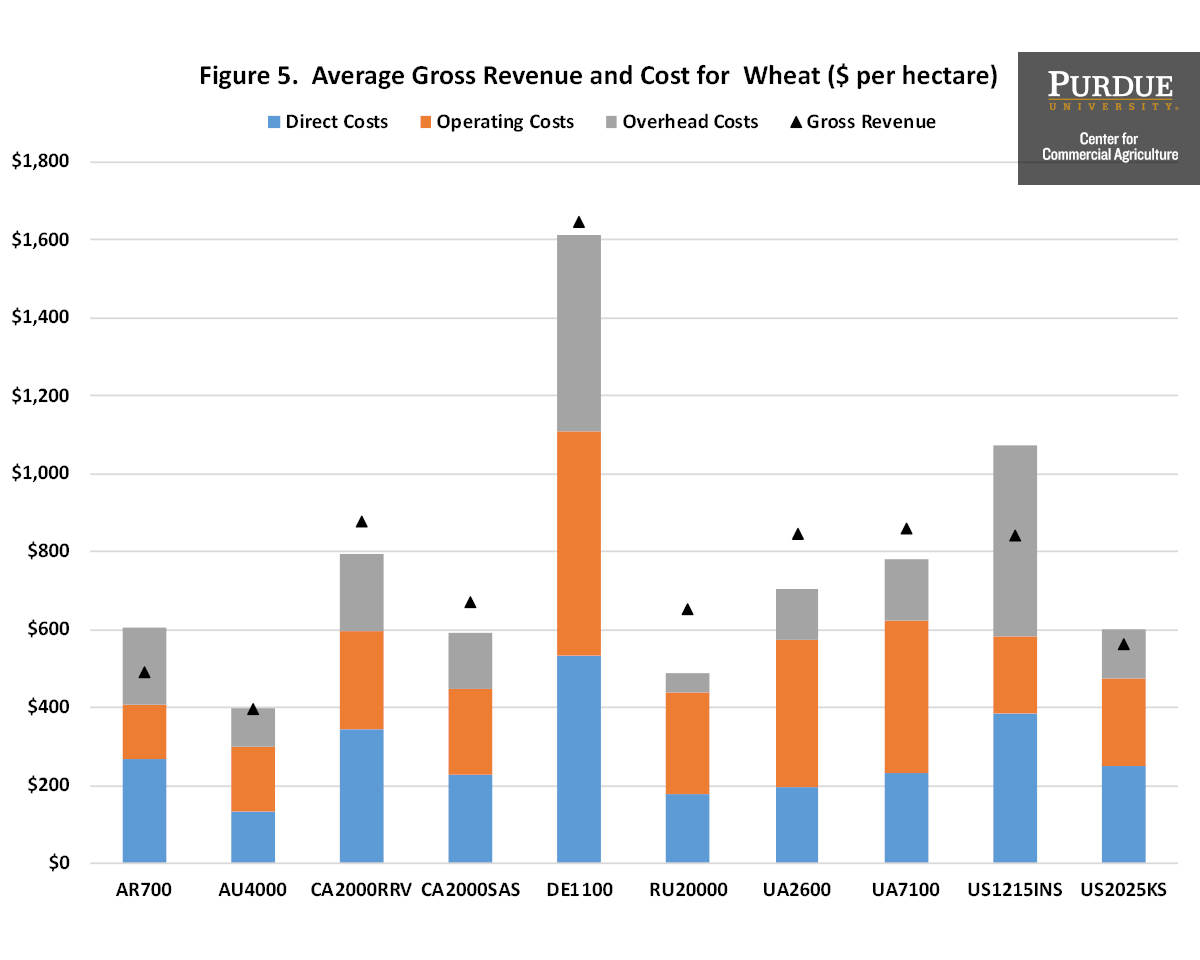
Figure 5. Average Gross Revenue and Cost for Wheat ($ per hectare)
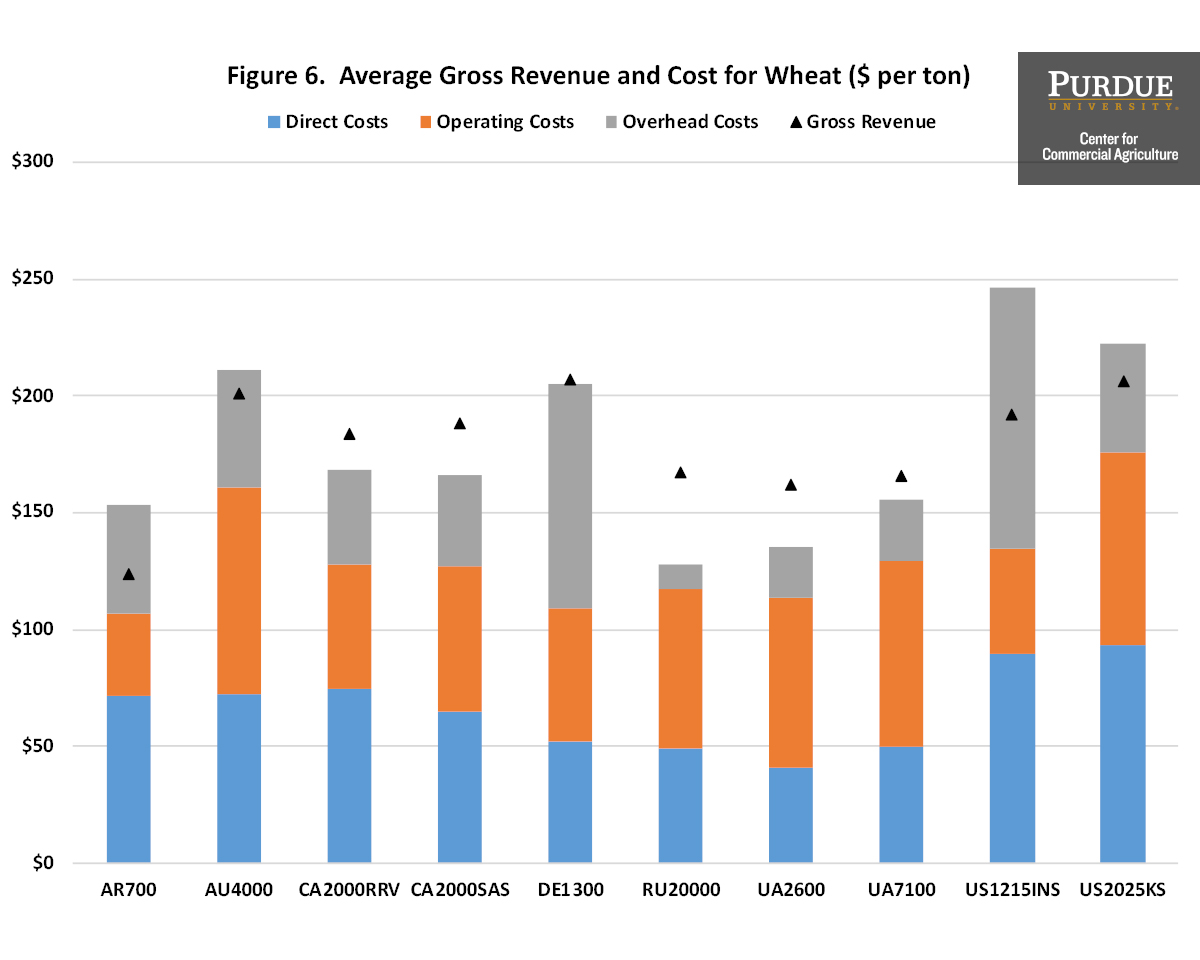
Figure 6. Average Gross Revenue and Cost for Wheat ($ per ton)
Four of the selected typical farms had a negative economic profit during the 2013 to 2017 time period. Average losses for the typical farms from Argentina, Australia, Indiana, and Kansas were $46, $1, $94 and $16 per acre, respectively during the five-year period ($114, $1, $231, and $39 per hectare, respectively). The highest economic profit earned was $68 per acre ($167 per hectare) for the typical Russia farm.
Conclusions
This paper examined yield, gross revenue, and cost for farms with a wheat enterprise in the agri benchmark network from Argentina, Australia, Canada, Germany, Russia, Ukraine, and United States. Using data from the 2017 to 2017, the average crop yield ranged from 29.0 to 119.1 bushels per acre and averaged 65.3 bushels per acre. The average economic profit was $8 per acre ($20 per hectare) for the typical farms. Economic profit ranged from a loss of $94 per acre ($231 per hectare) for the southern Indiana farm to $68 per acre ($167 per hectare) for the Russian farm. In addition to the two U.S. farms, economic loses were incurred for the farms in Argentina and Australia.
References
Agri benchmark. http://www.agribenchmark.org/home.html. Retrieved on 5/1/19.
Langemeier, M. and E. Yeager. “International Benchmarks for Wheat Production.” Center for Commercial Agriculture, Purdue University, September 2016.
Purdy, R. and M. Langemeier. “International Benchmarks for Wheat Production.” Center for Commercial Agriculture, Purdue University, July 2018.
![]()
![]()
![]()
![]()
![]()
TAGS:
TEAM LINKS:


RELATED RESOURCES
UPCOMING EVENTS
We are taking a short break, but please plan to join us at one of our future programs that is a little farther in the future.