September 3, 2019
International Differences in Labor Efficiency and Productivity
by Michael Langemeier and Rachel Purdy
![]()
![]()
![]()
![]()
![]()
Examining the competitiveness of crop production in different regions of the world is often difficult due to lack of comparable data and agreement regarding what needs to be measured. To be useful, international data needs to be expressed in common production units and converted to a common currency. Also, production and cost measures need to be consistently defined across production regions or farms.
This paper examines differences in labor efficiency and productivity using 2013 to 2017 data from the agri benchmark network. Discussion of key labor benchmarks used in production agriculture can be found in Langemeier (2017, 2018a, 2018b). Labor efficiency is computed by dividing total labor cost (hired labor plus family and operator labor) by gross revenue. Labor productivity is computed by dividing gross revenue by the number of workers. In this paper, labor productivity is expressed on a per hectare basis.
The agri benchmark network collects data on beef, cash crops, dairy, pigs and poultry, horticulture, and organic products. There are 40 countries represented in the cash crop network. The agri benchmark concept of typical farms was developed to understand and compare current farm production systems around the world. Participant countries follow a standard procedure to create typical farms that are representative of national farm output shares and categorized by production system or combination of enterprises and structural features.
Data from typical farms with corn and soybean enterprise data, and corn and wheat enterprise data are used in this paper. It is important to note that corn, soybean, and wheat enterprise data is collected from other countries besides those represented in this paper. For more information, visit the agri benchmark website (here).
The farm and country abbreviations used in this paper are listed in table 1. While the farms may produce a variety of crops, this paper only considers corn, soybean, and wheat production. Typical farms used in the agri benchmark network are defined using country initials and hectares on the farm. For example, the US1215INC farm is located in the central Indiana and has 1215 hectares.
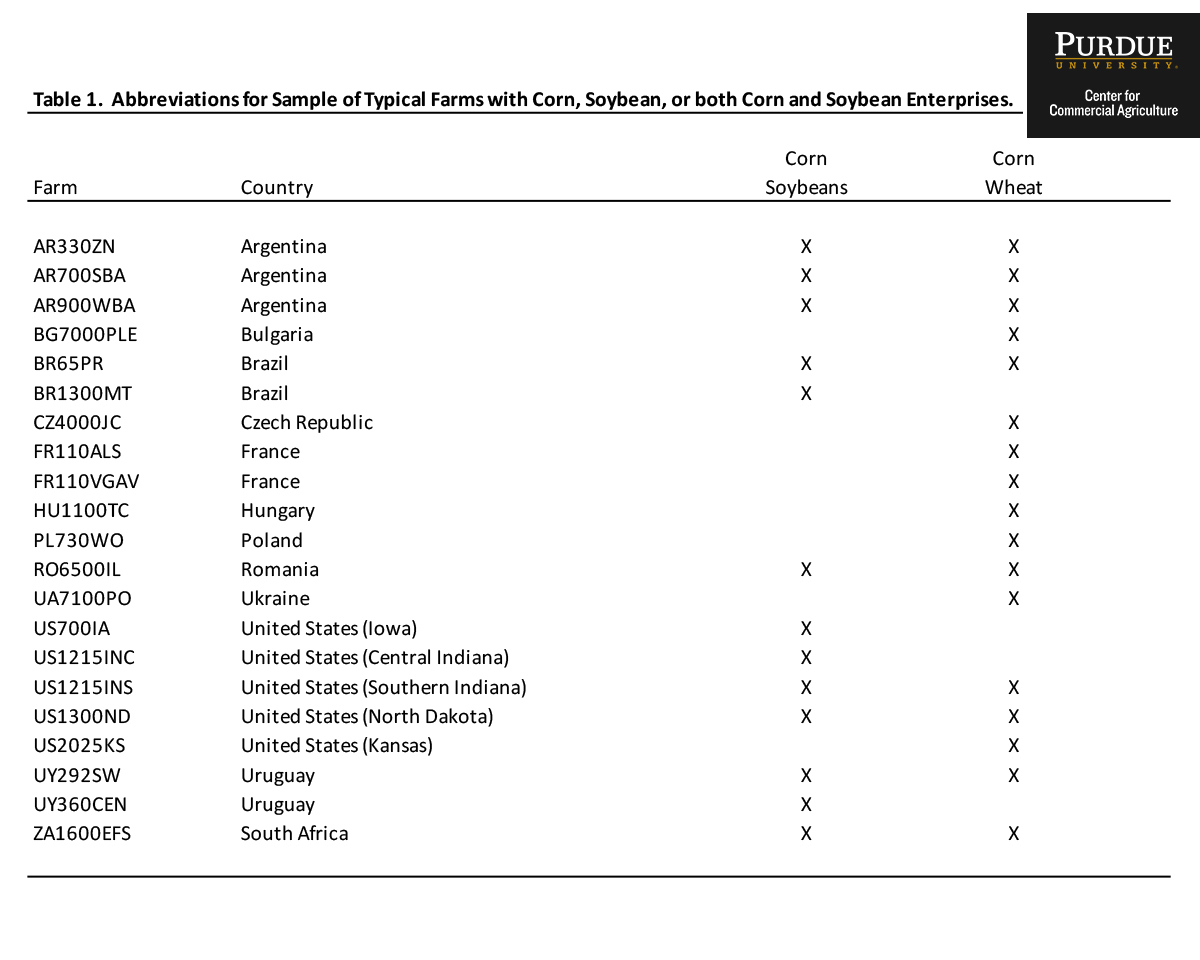
Table 1. Abbreviations for Sample of Typical Farms with Corn, Soybean, or both Corn and Soybean Enterprises.
Corn and Soybeans
Figure 1 presents labor efficiency for typical farms in the agri benchmark network that produced both corn and soybeans during the 2013 to 2017 period and figure 2 presents labor productivity for these same farms. The farms denoted with the green diamond were cost efficient which means that these farms produced the most output for a given level of inputs and utilized the optimal mix of inputs. Farms depicted with a blue triangle were cost inefficient and had relatively high per unit costs compared to the cost efficient farms.
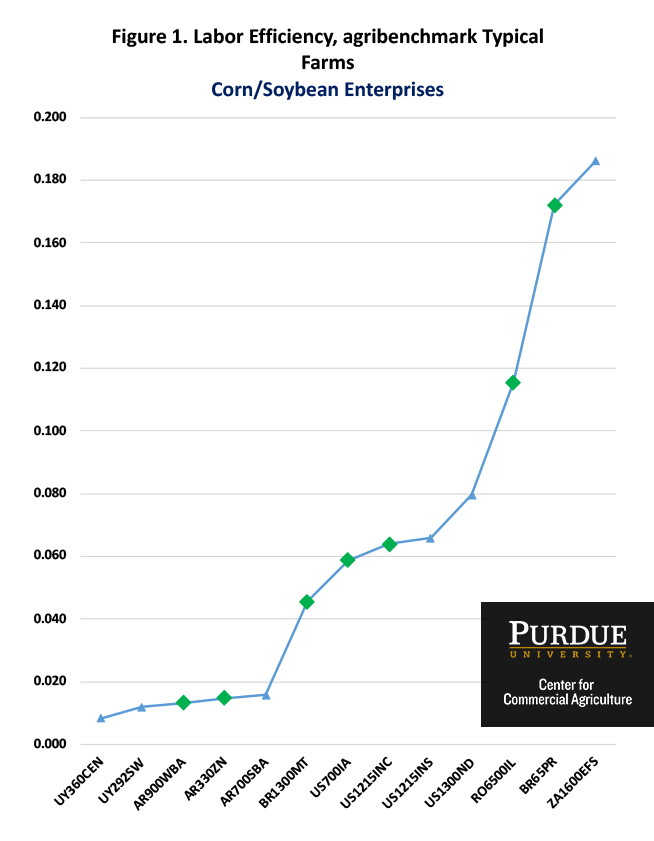
Figure 1. Labor Efficiency, agribenchmark Typical Farms, Corn/Soybean Enterprises
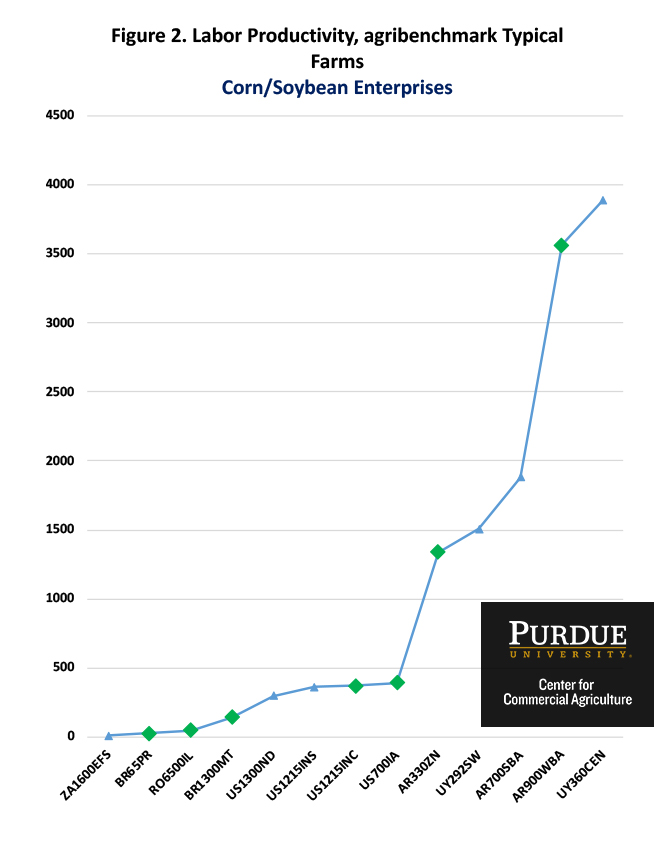
Figure 2. Labor Productivity, agribenchmark Typical Farms, Corn/Soybean Enterprises
Labor efficiency for the corn and soybean farms ranged from less than 2 percent for the farms in Argentina and Uruguay to over 18 percent for the South African farm, and averaged 6.5 percent. The low measures for the farms from Argentina and Uruguay partially result from the large use of custom operations on these farms. The average labor efficiency for the four U.S. farms was 6.7 percent.
Labor productivity for the corn and soybean farms averaged $1,065 per hectare, and ranged from $12 for the South African farm to over $3,500 for the largest farm in Argentina and the largest farm in Uruguay. The average measure for the four U.S. farms was $358 per hectare.
Farms that are cost efficient are producing the highest level of output for a given level of inputs, and using the optimal mix of inputs. Surprisingly, labor efficiency and productivity were not significantly correlated with cost efficiency. Perhaps this is due to the wide variability of these measures among the cost efficient farms.
Corn and Wheat
Figures 3 and 4 present labor efficiency and productivity for typical farms in the agri benchmark network that produced corn and wheat during the 2013 to 2017 period. The farms denoted with a green diamond were cost efficient while the farms denoted with a black triangle were cost inefficient.
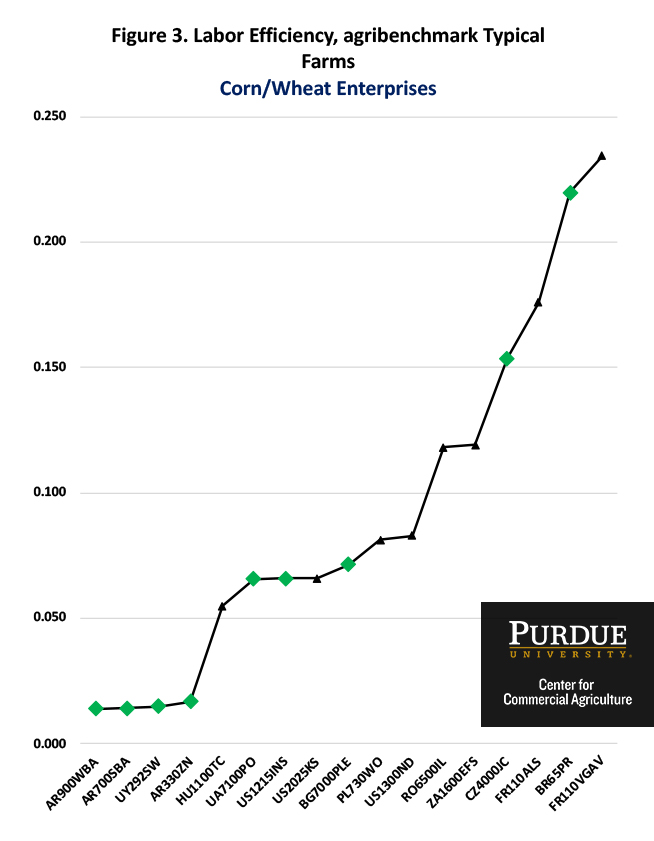
Figure 3. Labor Efficiency, agribenchmark Typical Farms, Corn/Wheat Enterprises
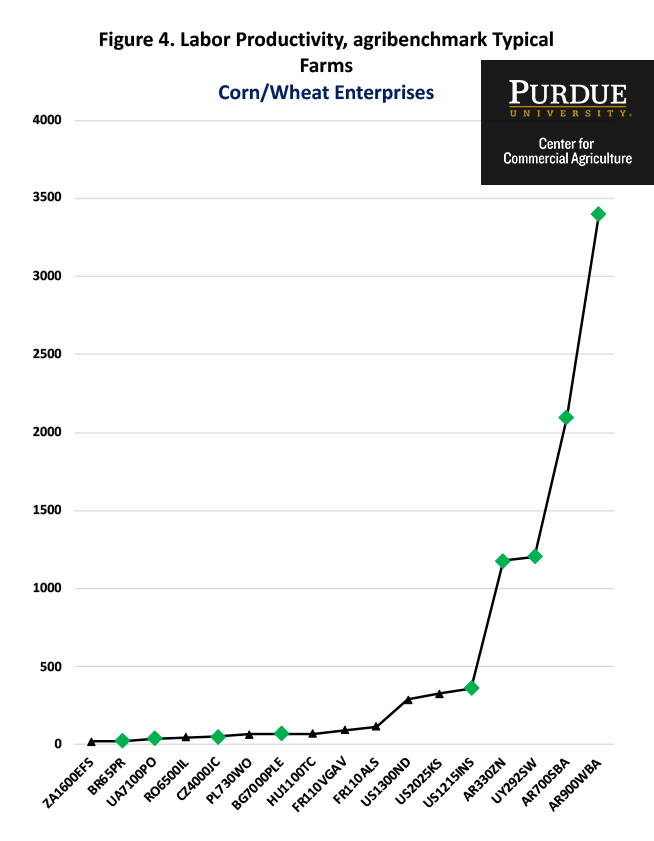
Figure 4. Labor Productivity, agribenchmark Typical Farms, Corn/Wheat Enterprises
Labor efficiency for the corn and wheat farms ranged from less than 2 percent for the farms in Argentina and Uruguay to over 23 percent for one of the French farms, and averaged 9.2 percent. The low measures for the farms from Argentina and Uruguay partially result from the large use of custom operations on these farms. The average labor efficiency for the three U.S. farms was 7.2 percent.
Labor productivity for the corn and wheat farms averaged $556 per hectare, and ranged from less than $25 for the South African farm and the smallest Brazilian farm to $3,400 for the largest farm in Argentina. The average measure for the three U.S. farms was $326 per hectare.
Labor efficiency was negatively correlated with cost efficiency and labor productivity was positively correlated with cost efficiency. This indicates that typical farms with relatively lower labor cost in relation to gross revenue and relatively higher gross revenue per worker tended to be more cost efficient.
Conclusions
This paper examined differences in labor efficiency and productivity for typical farms in in the agri benchmark network. Labor efficiency and productivity varied widely among the typical farms. Differences in these measures across farms that were cost efficient is particularly noteworthy, and suggest that typical farms in different countries adjust their use of labor in response to differences in wage rates and productivity.
The results for the U.S. farms are consistent with those reported in Langemeier (2018b). Average labor efficiency for these farms was 6.5 percent for corn and soybean production, and 6.8 percent for corn and wheat production. Labor productivity, measured by dividing gross revenue per hectare by the number of workers, averaged $358 for the U.S. corn and soybean farms and $326 for the U.S. corn and wheat farms.
References
Agri benchmark. http://www.agribenchmark.org/home.html. Retrieved on 8/20/19.
Langemeier, M. “Benchmarking Labor Efficiency and Productivity.” Center for Commercial Agriculture, Purdue University, September 2017.
Langemeier, M. “How Can I Improve Labor Productivity?” Center for Commercial Agriculture, Purdue University, September 2018a.
Langemeier, M. “Labor Efficiency and Productivity Benchmarks.” Journal of the American Society of Farm Managers and Rural Appraisers. 81(2018b):17-28.
![]()
![]()
![]()
![]()
![]()
TAGS:
TEAM LINKS:


RELATED RESOURCES
UPCOMING EVENTS
We are taking a short break, but please plan to join us at one of our future programs that is a little farther in the future.