February 6, 2020
Prospects for Swine Feed Costs in 2020
by Michael Langemeier
![]()
![]()
![]()
![]()
![]()
Principal crops planted in the United States declined from 319.3 million acres in 2018 to 302.6 million acres in 2019, a decline of 16.7 million acres. Assuming that we return to a more normal prevent plant year, planted acreage will likely be around 320 million acres in 2020. The crops planted on the additional 17 million acres will have an impact on corn and soybean prices. This article examines trends in feed costs as well as the impact of corn and soybean meal prices on feed costs for farrow-to-finish and swine finishing operations. It is important to note that the swine finishing enterprise represented in this article assumes the finishing of an early-weaned pig. The rations for the farrow-to-finish and swine finishing enterprises consist of corn, soybean meal, dry distillers’ grain, and supplements. Corn prices represent averages for Indiana as reported by USDA-NASS. Soybean meal and distillers’ grain prices are obtained from Feed Outlook, published monthly by USDA-ERS. Information from Agricultural Prices, a monthly USDA-NASS publication, was used to compute supplement prices. Early February futures prices for corn and soybean meal were used to project feed indices through 2020. Feed cost indices are reported on a closeout month rather than a placement month basis.
Corn and Soybean Meal Prices
Figures 1 and 2 report monthly corn and soybean meal prices from January 2000 to December 2019. A distinction is made for prices before and after 2007. The period starting in 2007 is often thought to be a new price regime. Corn price averaged $2.18 per bushel from 2000 to 2006, and $4.53 per bushel from 2007 to the current month. Soybean meal price averaged $187 per ton from 2000 to 2006, and $351 per ton from 2007 to the current month. Corn price was above $4.53 from February 2008 to September 2008, from November 2010 to September 2013, from March 2014 to June 2014, and in July of 2019. Soybean meal price was above $352 per ton from June to September 2008, from May 2009 to September 2009, in January and February of 2011, from March 2012 to March 2015, in July and August of 2015, from May to July in 2016, and from February 2018 to June 2018. Both corn and soybean meal prices are expected to remain below their averages since 2007 for the rest of this year.
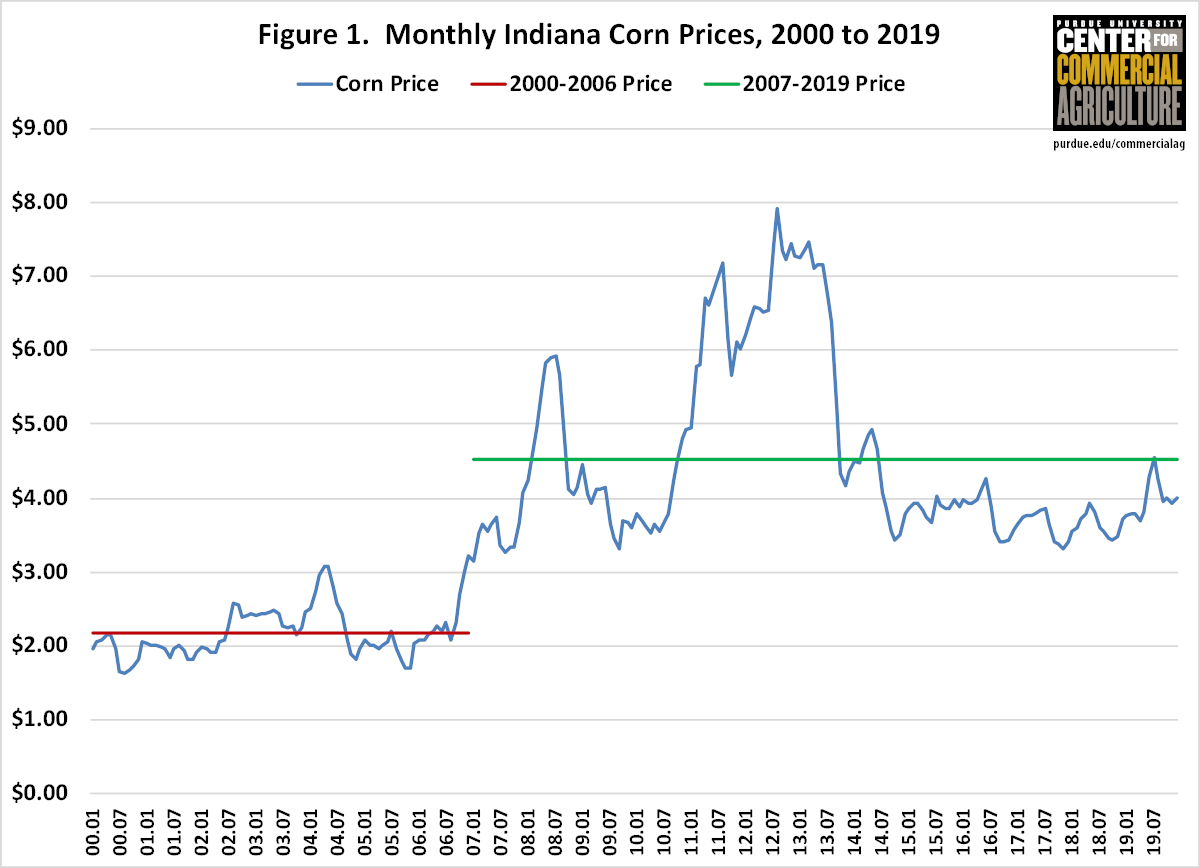
Figure 1. Monthly Indiana Corn Prices, 2000 to 2019
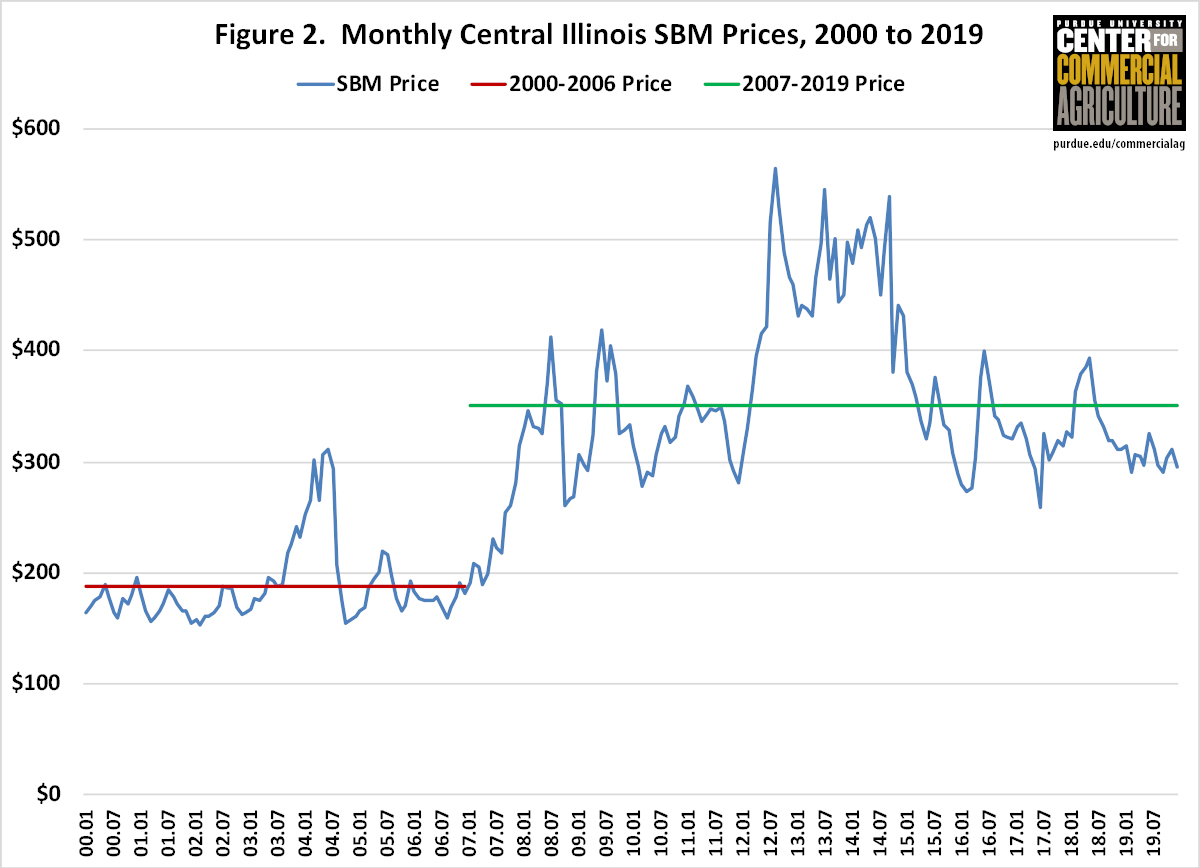
Figure 2. Monthly Central Illinois SBM Prices, 2000 to 2019
Farrow-to-Finish Enterprise
Figure 3 presents monthly farrow-to-finish feed cost indices from January 2000 to December 2019. The latest full year of indices, 2019, has an index of 100 so all indices outside of this year are expressed in relative terms. As with corn and soybean meal prices, a distinction is made for feed cost indices before and after 2007. The average index from 2000 to 2006 was approximately 57 while the average index since the beginning of 2007 was approximately 113. The index for January 2020 was 103.8, so current feed costs are 3.8 percent above the average for 2019. Projected monthly indices range from 100 to 102 for the rest of 2020.
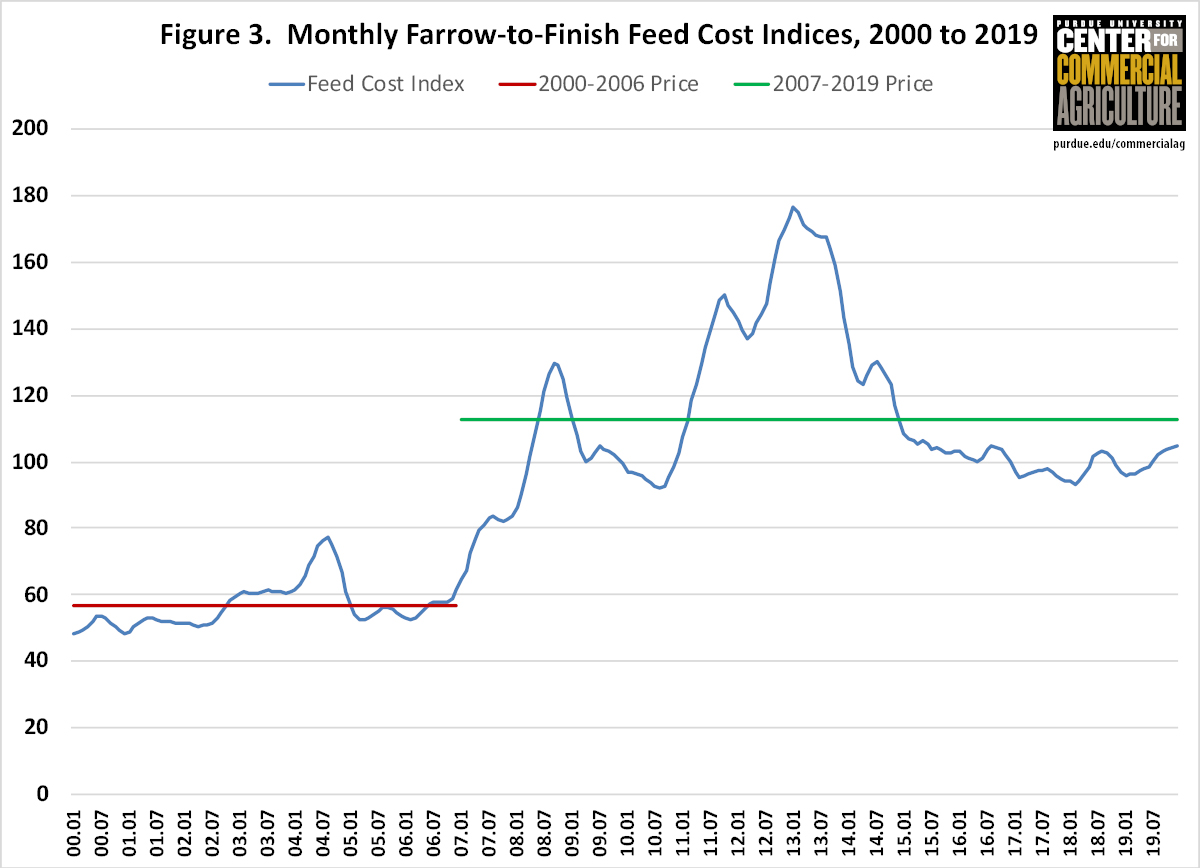
Figure 3. Monthly Farrow-to-Finish Feed Cost Indices, 2000 to 2019
Annual farrow-to-finish feed cost indices are presented in figure 4. The projection for 2020 (red bar) used corn and soybean meal futures prices in early February. The projected feed cost index for 2020 is 101.
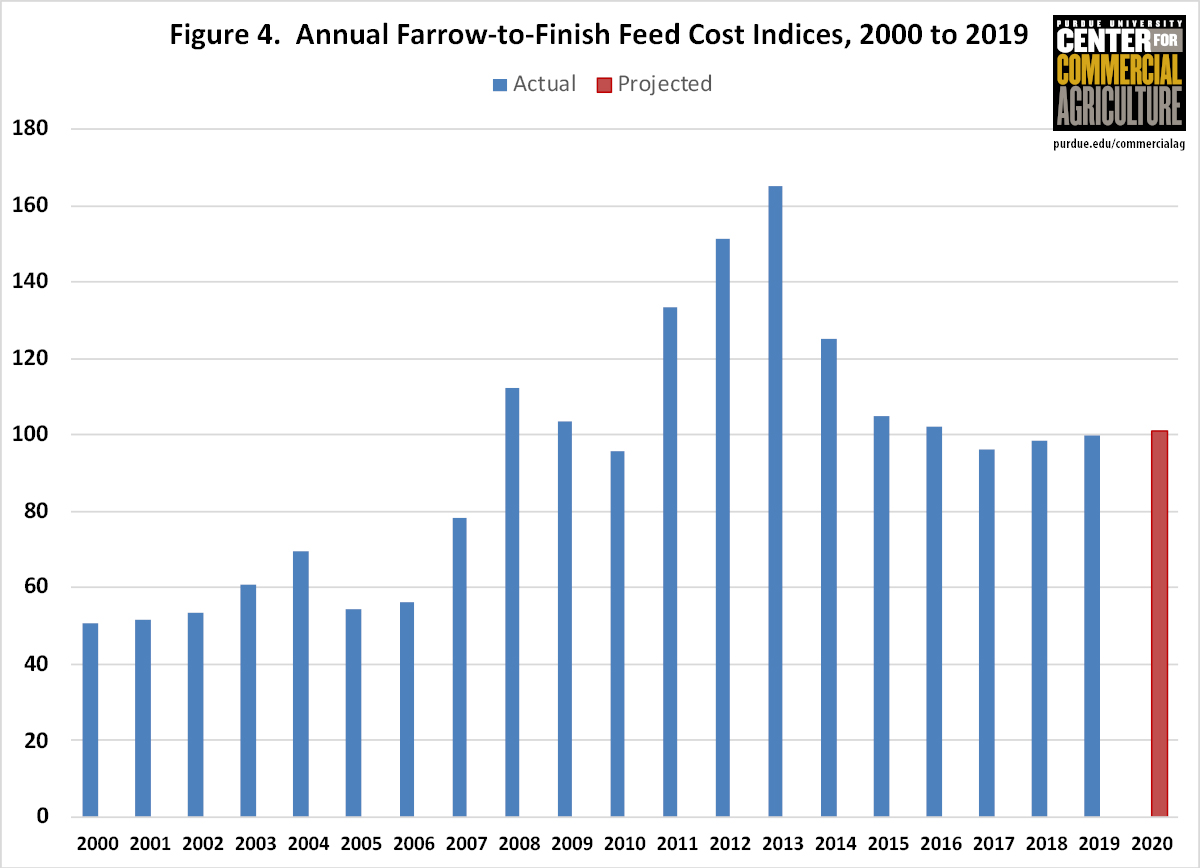
Figure 4. Annual Farrow-to-Finish Feed Cost Indices, 2000 to 2019
Swine Finishing Enterprise
Figure 5 illustrates monthly swine finishing feed cost indices for the January 2000 to December 2019 period. The latest full year of indices, 2019, has an index of 100 so all indices outside of this year are expressed in relative terms. The average index for the 2000 to 2006 period was 56 while the average index for the period beginning in 2007 was 111. The index for January 2020 was 101.4, so current feed costs are 1.4 percent above the average for 2019. Projected monthly indices range from 99 to 101 for the rest of 2020.
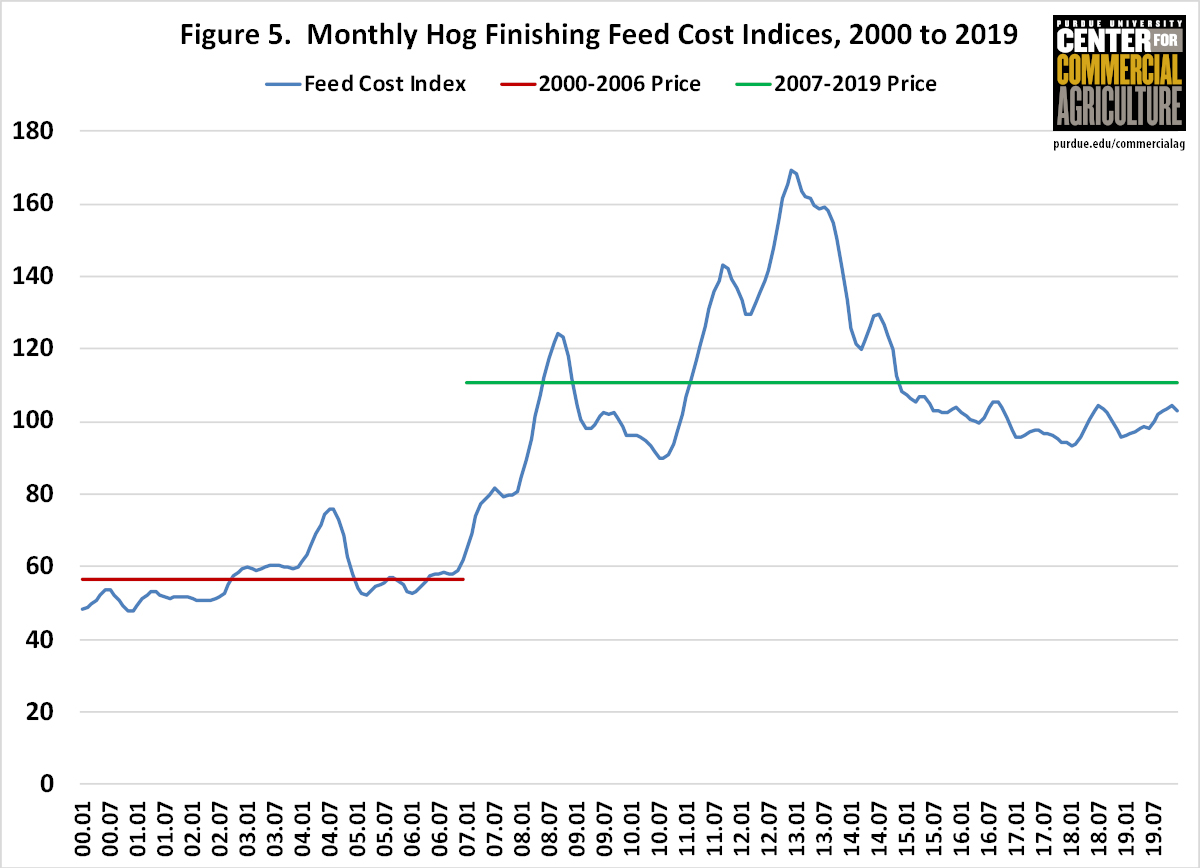
Figure 5. Monthly Hog Finishing Feed Cost Indices, 2000 to 2019
Annual swine finishing feed cost indices are presented in figure 6. The projection for 2020 (red bar) used corn and soybean meal futures prices in early February. The projected feed cost index is 100. Thus, swine finishing feed costs for 2020 are expected to be very similar to those experienced in 2019.
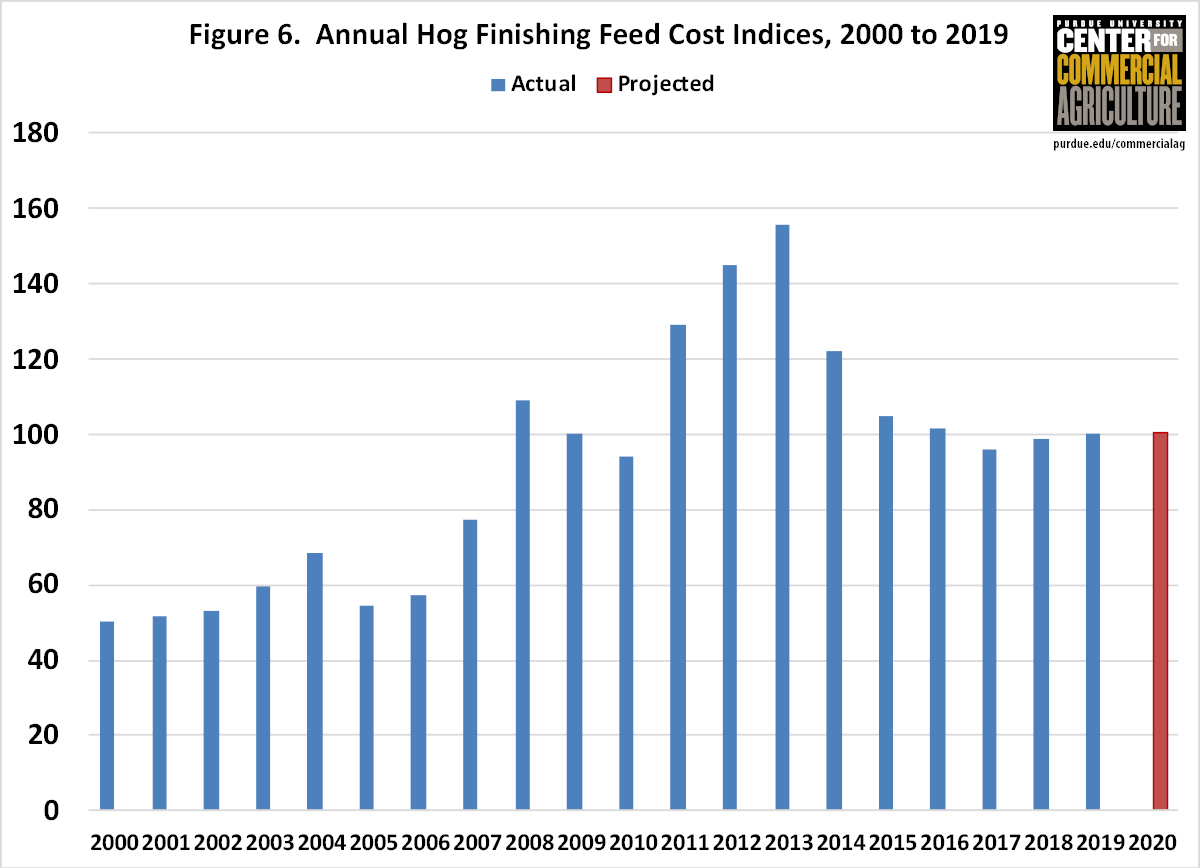
Figure 6. Annual Hog Finishing Feed Cost Indices, 2000 to 2019
Using the iFarm price distribution tool (here), the probability of the corn futures price for December 2020 being below (above) $3.43 ($4.30) was 25 percent on February 4. This represents a spread of almost $0.90 per bushel. Feed costs are very sensitive to changes in corn and soybean meal prices. Regression analysis was used to examine the relationship between swine finishing feed cost, and corn and soybean meal prices during the January 2007 to December 2019 time period. Results are as follows: each 0.10 increase in corn prices increases feed cost per cwt. by $0.44, and each $10 increase in soybean meal prices increases feed cost per cwt. by $0.32. Obviously, a $0.40 increase or decrease in corn price would have a large impact on feed cost per cwt.
Current feed cost is approximately $32.25 per cwt. Table 1 presents feed cost per cwt. for corn prices ranging from $3.25 to $4.25 per bushel, and soybean meal prices ranging from $250 to $350 per ton. At the lower range of prices, feed cost per cwt. would be approximately $26.25. At the higher range of prices, feed cost per cwt. would be approximately $34.00.
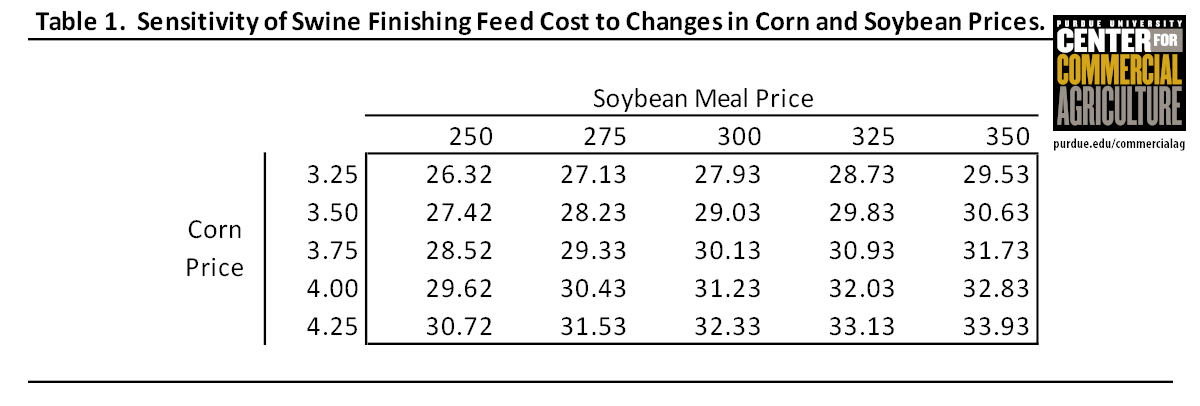
Table 1. Sensitivity of Swine Finishing Feed Cost to Changes in Corn and Soybean Prices
Conclusions
This article discussed recent trends in feed costs for farrow-to-finish and swine finishing enterprises, and provided projections for 2020. Feed costs are expected to be similar to that experienced in 2019. However, current projections have a wide band around them. Current projections use corn prices, depending on the month, ranging from $3.60 to $4.00. Corn prices will be determined by planted acreage as well as other supply and demand factors. Thus, corn prices could be as low as $3.20 to as high as $4.10. This article examined the impact of changes in corn and soybean meal prices on swine finishing feed cost. Each $0.10 per bushel change in corn price, changes feed cost by $0.44 per cwt. Similarly, each $10 per ton change in soybean meal price, changes feed cost by $0.32 per cwt.
Reference
2019 iFarm Price Distribution Tool, University of Illinois, accessed on February 4, 2020.
USDA-NASS. Quick Stats, accessed on January 31, 2020.
![]()
![]()
![]()
![]()
![]()
TAGS:
TEAM LINKS:

RELATED RESOURCES
UPCOMING EVENTS
We are taking a short break, but please plan to join us at one of our future programs that is a little farther in the future.