May 11, 2021
Trends in Corn Plant Populations
by Michael Langemeier
![]()
![]()
![]()
![]()
![]()
Trends in seed costs are driven by both changes in seed prices and changes in corn plant populations. This article examines trends in corn plant populations in Iowa, Illinois, and Indiana. In addition, this article examines the proportion of seed costs per acre that are explained by changes in seed prices and plant populations. FINBIN data was used to represent seed cost per acre. Seed price and corn plant population data were obtained from USDA-NASS.
Corn Plant Populations
Figure 1 presents corn plant populations in Iowa, Illinois, and Indiana from 1996 to 2020. The annual growth rate in plant populations ranged from 0.99 percent in Iowa to 1.09 percent in Illinois over the study period. Annual increases in plant populations ranged from 280 plants per acre in Iowa to 306 plants per acre in Illinois.
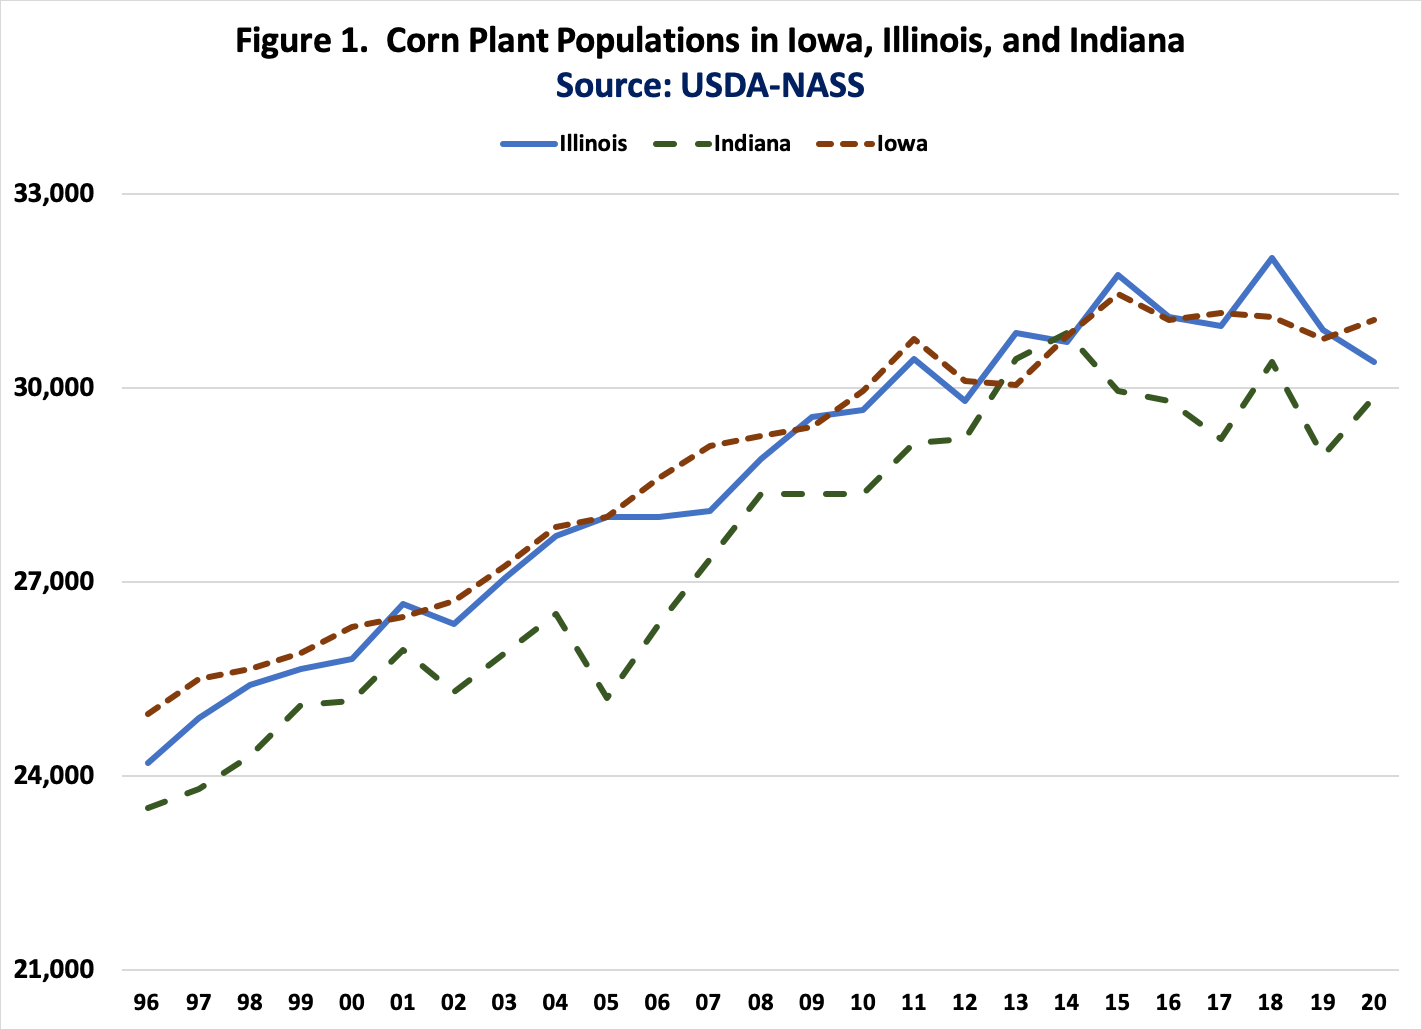
Figure 1. Corn Plant Populations in Iowa, Illinois, and Indiana
The three trends lines illustrated in figure 1 are highly correlated, but obviously are not identical. In 1996, the corn plant population in Iowa, Illinois, and Indiana were 24,950; 24,200; and 23,500 plants per acre; respectively. Projected plant populations in 2021 are 32,410 in Iowa, 32,570 in Illinois, and 31,287 in Indiana.
Relationship between Seed Cost, Seed Prices, and Plant Populations
To examine the relative importance of changes in seed price and plant population to changes in seed costs, we developed indices for all three of these measures. Figure 2 presents indices for seed cost, seed price, and plant population in the three states represented in figure 1 (i.e., Iowa, Illinois, and Indiana) from 1996 to 2020. The base year for each measure was 2011.
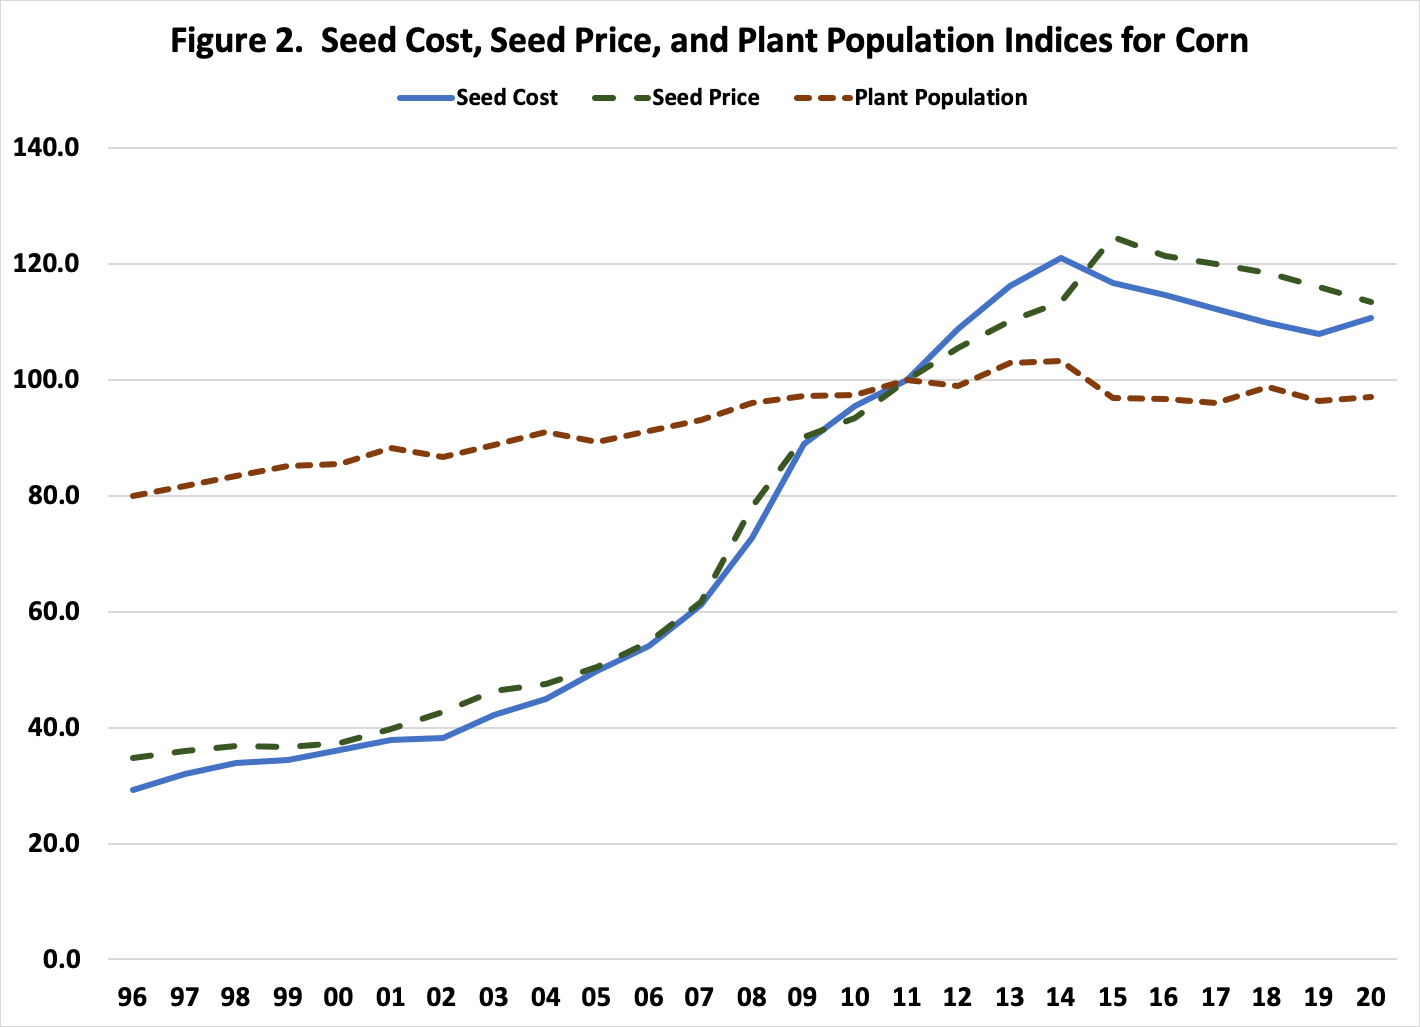
Figure 2. Seed Cost, Seed Price, and Plant Population Indices for Corn
It is obvious from figure 2 that there is a closer link between the seed cost and the seed price indices than there is between these two indices and the plant population index. To examine the relationship between the three measures, we regressed the seed price and plant population indices on the seed cost index. The regression coefficients for both the seed price index and the plant population index were significant. Results indicated that a 1 percent change in the seed price index resulted in a 0.86 percent change in the seed cost index, while a 1 percent change in the plant population resulted in a 1.41 percent change in the seed cost index. Though the seed cost index was more sensitive to changes in plant population, given the relatively larger change in the seed price index during the study period, as illustrated in figure 2, the seed price index had a larger impact on the seed cost index over the study period. To more fully understand the impact of the seed price index and the plant population index on seed costs, we computed coefficients of separate determination (Langemeier et al., 1992). These coefficients can be used to measure the influence of each independent variable upon the dependent variable. The sum of the coefficients of determination for each variable equal the R-square goodness of fit measure, which was 0.993 for the seed cost regression. Seed price explained approximately 81.6 percent of the variation in seed cost and plant population explained approximately 17.7 percent of the variation.
Concluding Comments
This article discussed trends in corn plant populations for three Corn Belt states, and examined the relationship between seed cost, seed price, and plant populations for corn. Plant populations for corn increased approximately 1 percent per year for Iowa, Illinois, and Indiana from 1996 to 2020. For Illinois, the state with highest projected plant population in 2021, corn plant population increased from 24,200 plants per acre in 1996 to 30,400 plants per acre in 2020. A vast majority of the change in seed costs since 1996 can be explained by changes in seed prices. However, approximately 18 percent of the variation in seed costs since 1996 was explained by changes in corn plant population. Thus, when developing crop budgets, it is important to account for current seed prices and trends in corn plant population in seed cost estimates.
Obviously, increases in corn plant populations have also impacted trends in corn yield since 1996. Though an important topic, it was beyond the scope of this short article to examine the relationship between corn plant population and corn yield. We will leave this topic for future article.
Citations
Center for Farm Financial Management, University of Minnesota, FINBIN web site, accessed on April 9, 2021. https://finbin.umn.edu/
Langemeier, M., T. Schroeder, and J. Mintert. “Determinants of Cattle Finishing Profitability.” Southern Journal of Agricultural Economics. 24(December 1993):41-47.
USDA-NASS. Quick Stats, accessed on April 9, 2021. https://quickstats.nass.usda.gov/
![]()
![]()
![]()
![]()
![]()
TAGS:
TEAM LINKS:

RELATED RESOURCES
UPCOMING EVENTS
We are taking a short break, but please plan to join us at one of our future programs that is a little farther in the future.