November 23, 2022
U.S. Corn Exports Off to A Weak Start
by: James Mintert
![]()
![]()
![]()
![]()
![]()
While the volume of corn exported is much smaller than that used for domestic livestock feeding or for ethanol production, exports remain an important usage category for U.S. corn. Over the last five years U.S. corn exports have accounted for an average of 16% of total U.S. corn usage, ranging from a high of 19% in the 2020 crop year to a low of 13% in the 2019 crop year. USDA’s most recent export forecast of 2.15 billion bushels for the 2022 marketing year is expected to equal about 15% of total usage.
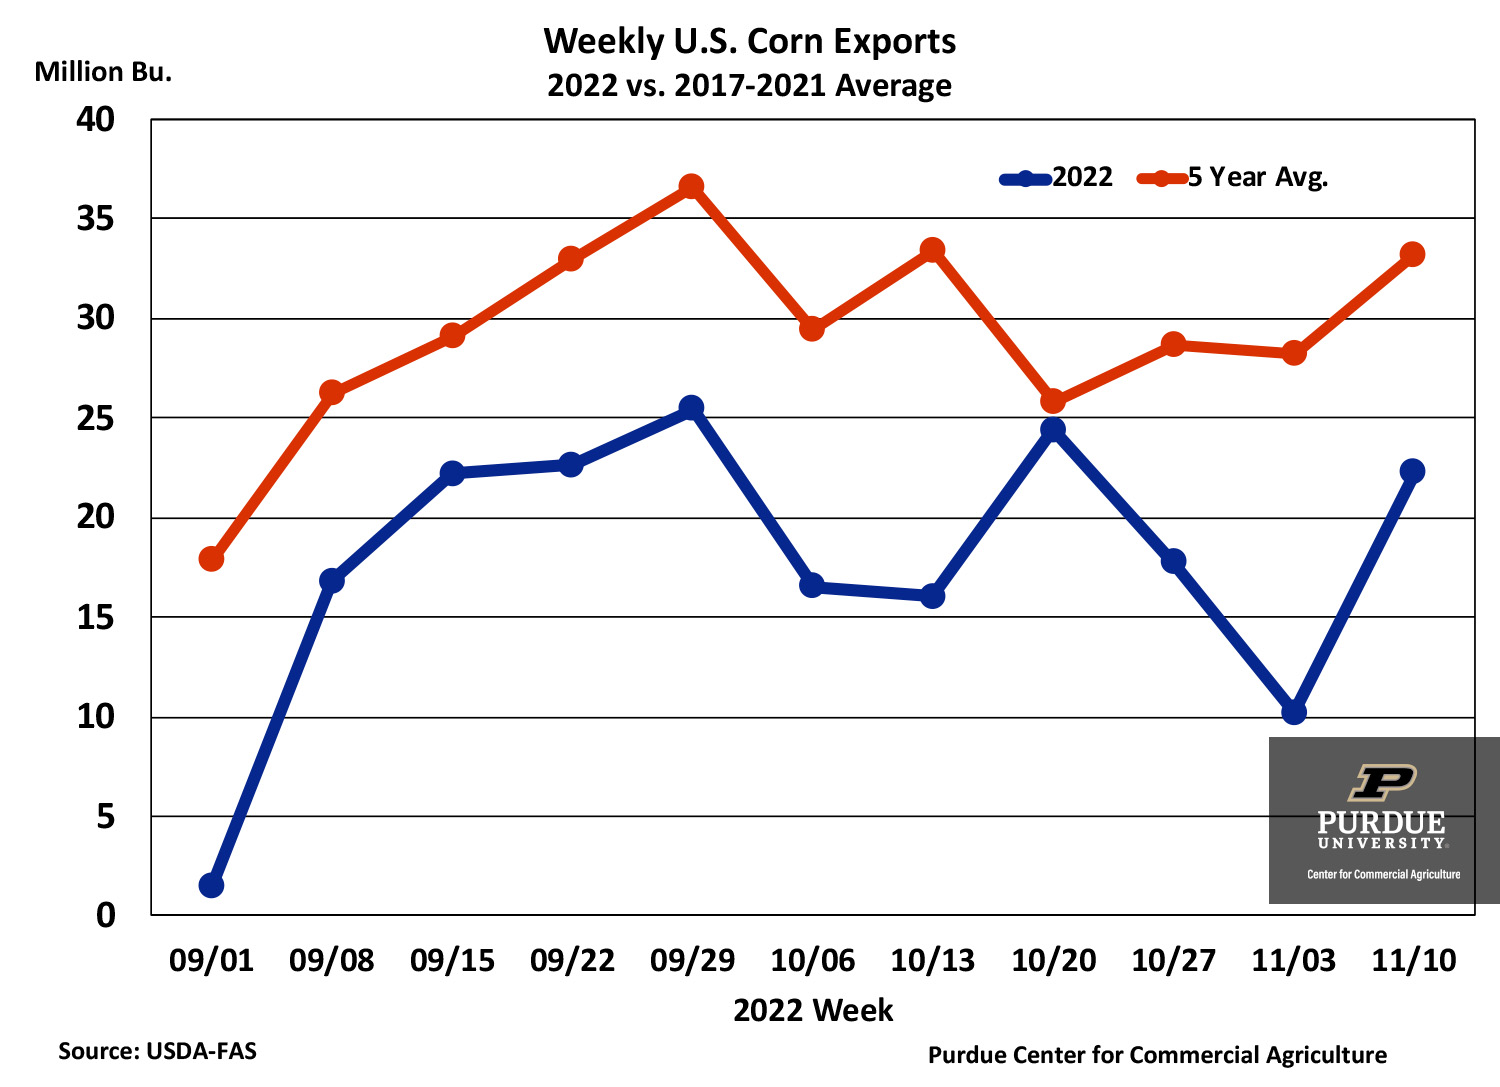
Exports have been under extra scrutiny this year in part because of Ukraine’s war with Russia. The war was expected to greatly reduce corn exports from Ukraine and possibly lead to a boost in U.S. corn exports. That has not been the case so far in the 2022 marketing year, which began on September 1. Weekly corn exports reported by USDA-FAS have consistently fallen below the 5-year average for each of the 11 weeks of the 2022 crop year. Through November 10th, 2022 crop U.S. corn exports totaled just 196 million bushels, 39% below the 5-year average and 36% below the comparable 2021 period. At this stage of the crop marketing year in both 2020 and 2021 the U.S. had already exported over 300 million bushels. To date, a change in shipments to China don’t appear to be a major driver of the weak export volume with reported year-to-date shipments to China actually up modestly compared to a year ago. In a related article, Thompson points out the difficulties in transporting grain this year via the Mississippi river basin, the nation’s primary corn export channel, as a result of low river levels. Transportation difficulties are clearly one reason for the weak start to U.S. corn exports this year.

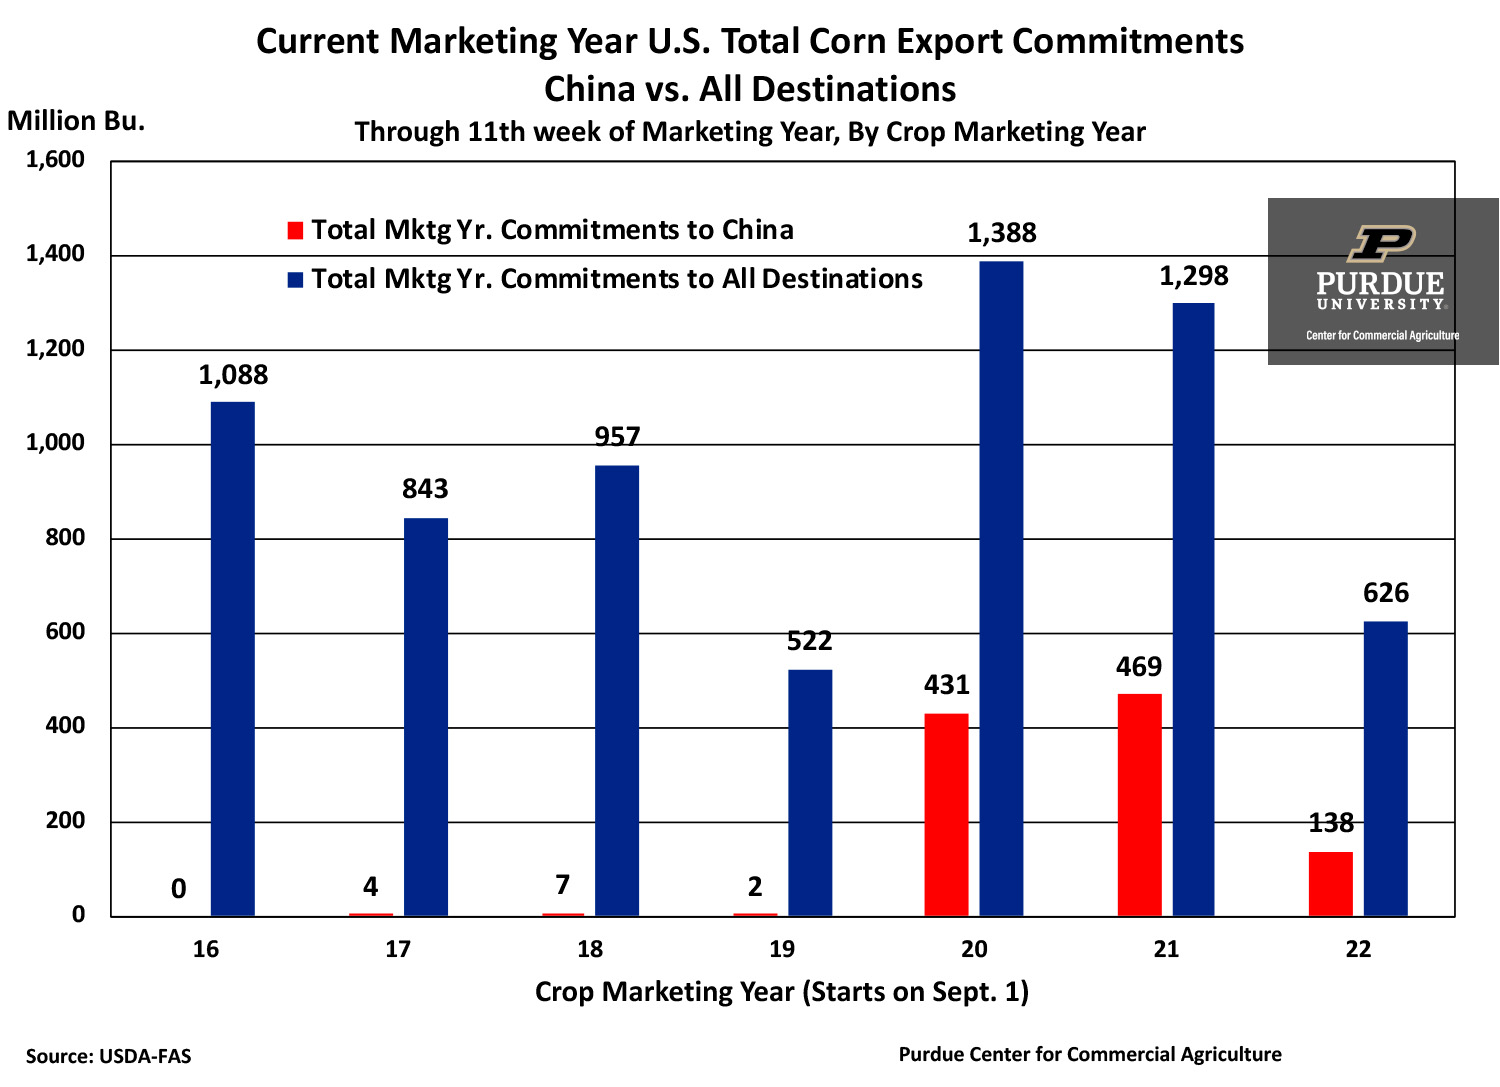
Perhaps more troubling than the weak year-to-date export shipments are the weak current marketing year corn export commitments. Through November 10th, 2022 crop marketing year export commitments were just 626 million bushels, a reduction of 52% (672 million bushels) compared to a year earlier. Smaller export commitments to China in 2022 vs 2021 do account for a significant portion of the change in commitments. Reported export commitments to China so far this crop year are down 71% (332 million bushels) compared to a year ago.
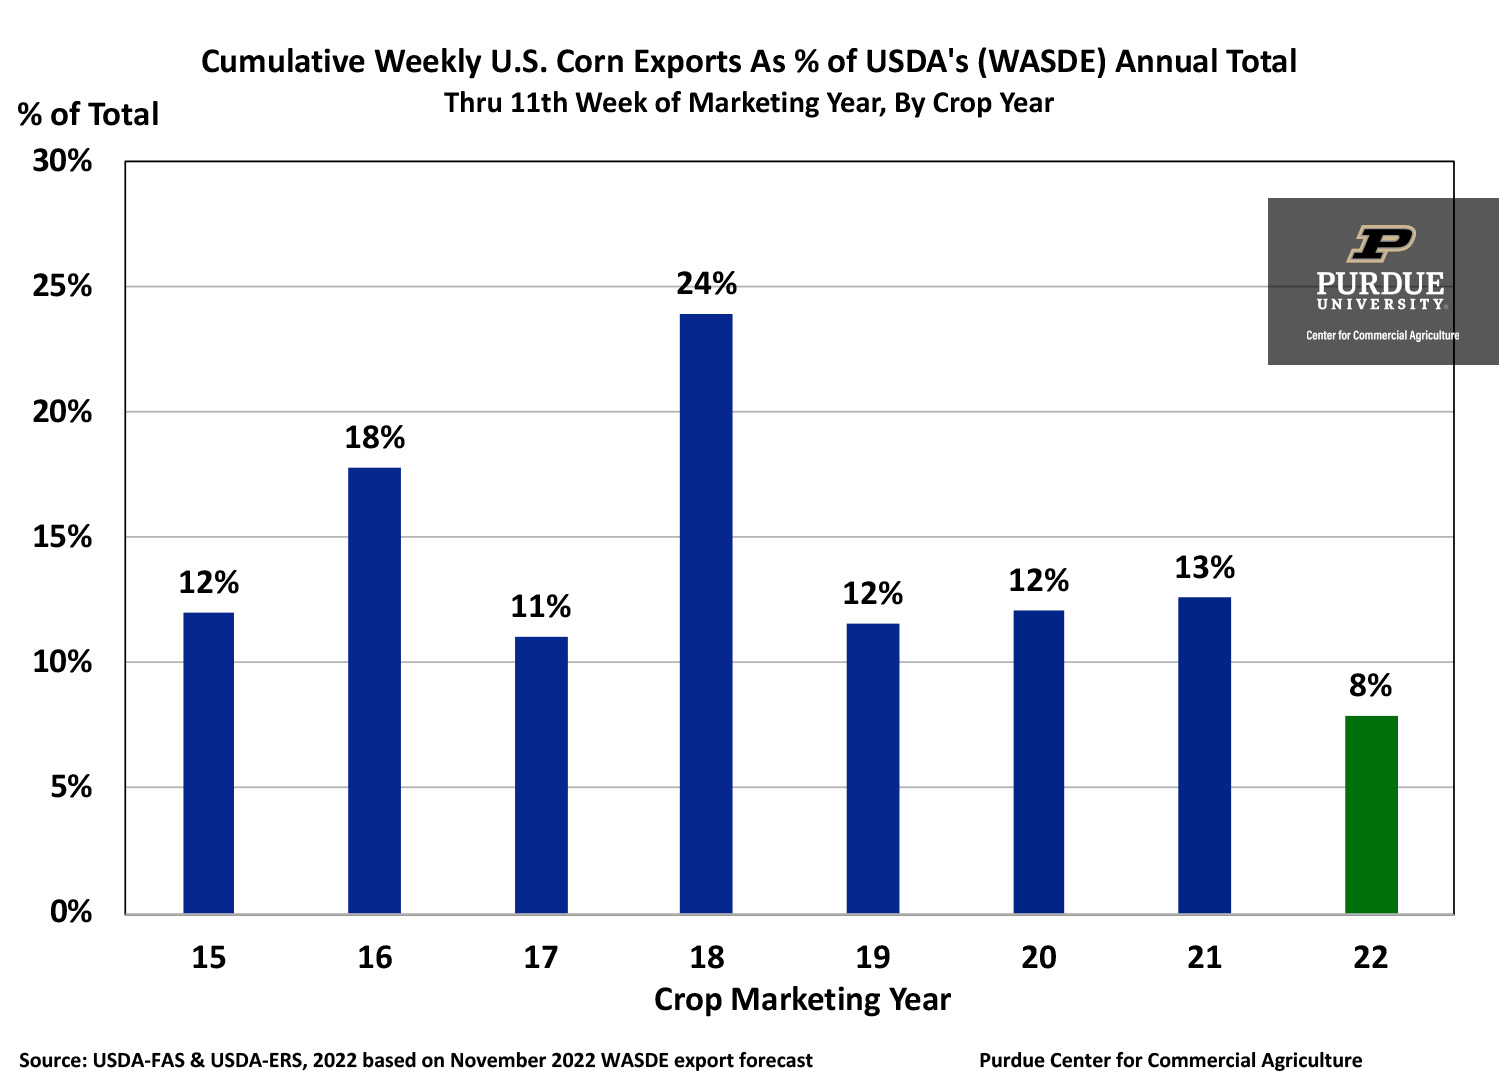
What’s to be made of the weak start to U.S. corn exports in 2022? One way to gauge it’s importance is to examine how year-to-date exports compare to USDA’s forecast for the 2022 crop year. Through the first 11 weeks of the 2022 crop marketing year, U.S. corn exports totaled just 8% of USDA’s annual forecast of 2.15 billion bushels published in the November WASDE report. The 11 week export total over the last 5 years averaged 14% of marketing year total corn exports reported by USDA, ranging from a low of 12% in 2019 and 2020 to a high of 24% in 2018.
U.S. corn exports are off to a dismal start in the 2022 marketing year and risk falling below USDA’s most recent forecast. The deeper into the marketing year we go, the more difficult it will be for U.S. corn exports to catch up. Moisture in the Mississippi river valley and rising river water levels are a necessary, but might not be a sufficient condition, for corn exports to get back on track.
![]()
![]()
![]()
![]()
![]()
TAGS:
TEAM LINKS:

RELATED RESOURCES
UPCOMING EVENTS
We are taking a short break, but please plan to join us at one of our future programs that is a little farther in the future.