April 20, 2023
Agility and Absorption Capacity
by Margaret Lippsmeyer and Michael Langemeier
![]()
![]()
![]()
![]()
![]()
Introduction
Agility and absorption capacity are often thought of as two distinct strategies through which farm managers build resilience. Agility is assumed to be critical for emerging businesses, still in their defining stages, whereas absorption capacity helps well established businesses navigate the ebbs and flows of the business cycle. While the importance of each may vary depending on the maturity of the business, any manager not focusing on the two as compliments to one another is flying blind with their management strategy. Together, agility and absorption capacity work to improve business performance in times of uncertainty. This article emphasizes the importance of building agility and absorption capacity in a farming operation by exploring the consequences associated with a lack of focus on these concepts.
Agility
Agility encompasses a farm’s ability to spot and exploit changes in the market in a timely fashion (Sull, 2009). In general, there are three major types of agility: operational, portfolio, and strategic. Operational agility includes improvements to current farm processes through reducing time spent on routine tasks, improving output quality by adjusting planting or harvesting schedules, and/or purchasing farm inputs at a lower price. Portfolio agility represents a farm’s ability to shift resources within the operation. For example, high portfolio agility may result from improved training practices that enable employees to cover other positions in the operation when necessary. As another example, how easy is it for your farm to change the enterprise mix? Strategic agility, which is arguably the most important for a farm manager to foster, focuses on a farm’s ability to spot and exploit opportunities in a timely fashion. Strategic agility is critical when expanding an operation, when diversifying enterprises, and when investing in new technologies.
Absorption Capacity
Absorption capacity is the ability to withstand shifts in the market (Sull, 2009). In production agriculture, absorption capacity is sustained by keeping excess cash reserves, storing crops to market when extra cash is needed, diversifying cash flows, decreasing fixed costs per unit of output, and any other strategy that buffers the business in times of uncertainty. In particular, absorption capacity is related to the strength of a farm’s balance sheet. To gauge balance sheet strength, evaluate both your liquidity position and solvency position. The following two questions are helpful. Is our current ratio large enough to both cover cash flow needs in a downturn and respond to investment opportunities? Would it be possible to fund an investment in a capital asset with both retained earnings and borrowed funds?
The Interaction of Slack, Agility, and Absorption Capacity
Management research has been conducted on absorption capacity and agility in the general business environment, indicating the two are strongly linked with slack resources, which are defined as resources possessed by firms in excess of their demands (Paeleman and Vanacker, 2015). Along these lines, consider the following question: does our farm have enough employees and tangible resources such as machinery and equipment to respond quickly to new opportunities? Lee and Wu (2015) conclude that maintaining high levels of slack may result in a competitive advantage, however high levels of unabsorbed slack may lead to business inefficiencies. Additional studies concur that maintaining slack facilitates expansion opportunities, innovation, and growth, but overaccumulation diminishes these benefits (Miller and Leiblain, 1996; Nohria and Gulati, 1996; Tan and Peng, 2003; Wang et al., 2016; Wang et al., 2017). These studies demonstrate that agility and absorption capacity are highly interdependent, with slack determining the level of agility a business can achieve and its absorption capacity.
In general, farms maintain slack via cash reserves, marketable commodities, and the ability to take on debt when opportunities arise or times get tough. However, constantly maintaining high slack does incur opportunity costs due to the fact that it may be possible to reinvest the funds used for slack resources and earn a higher rate of return. While farms attempt to achieve sustainable levels of slack that promote agility and absorption capacity, determining the level of slack to carry is tricky. Often times, managers get this balance wrong. The remainder of this article will provide a way to assess your farm’s positioning to determine if the balance of slack you carry is helping or harming your operation.
Assessing Your Farm
Table 1 provides a mechanism to assess a farm’s agility and absorption capacity. The questions are designed so that higher scores are preferable. Lower scores may indicate that the level of slack in your operation is not optimal. The three questions pertaining to agility focus on goals, objectives, and core values; the examination of new enterprises; and the assessment of competitive advantage. The three questions pertaining to absorption capacity focus on per unit fixed costs, enterprise mix, and the strength of a farm’s balance sheet. To obtain a score for agility and absorption capacity, add up your scores for the three individual questions posed for each. Unfortunately, average scores for the farm community are currently not available. Ongoing research, discussed in more detail below, is being designed to fill this gap in knowledge.
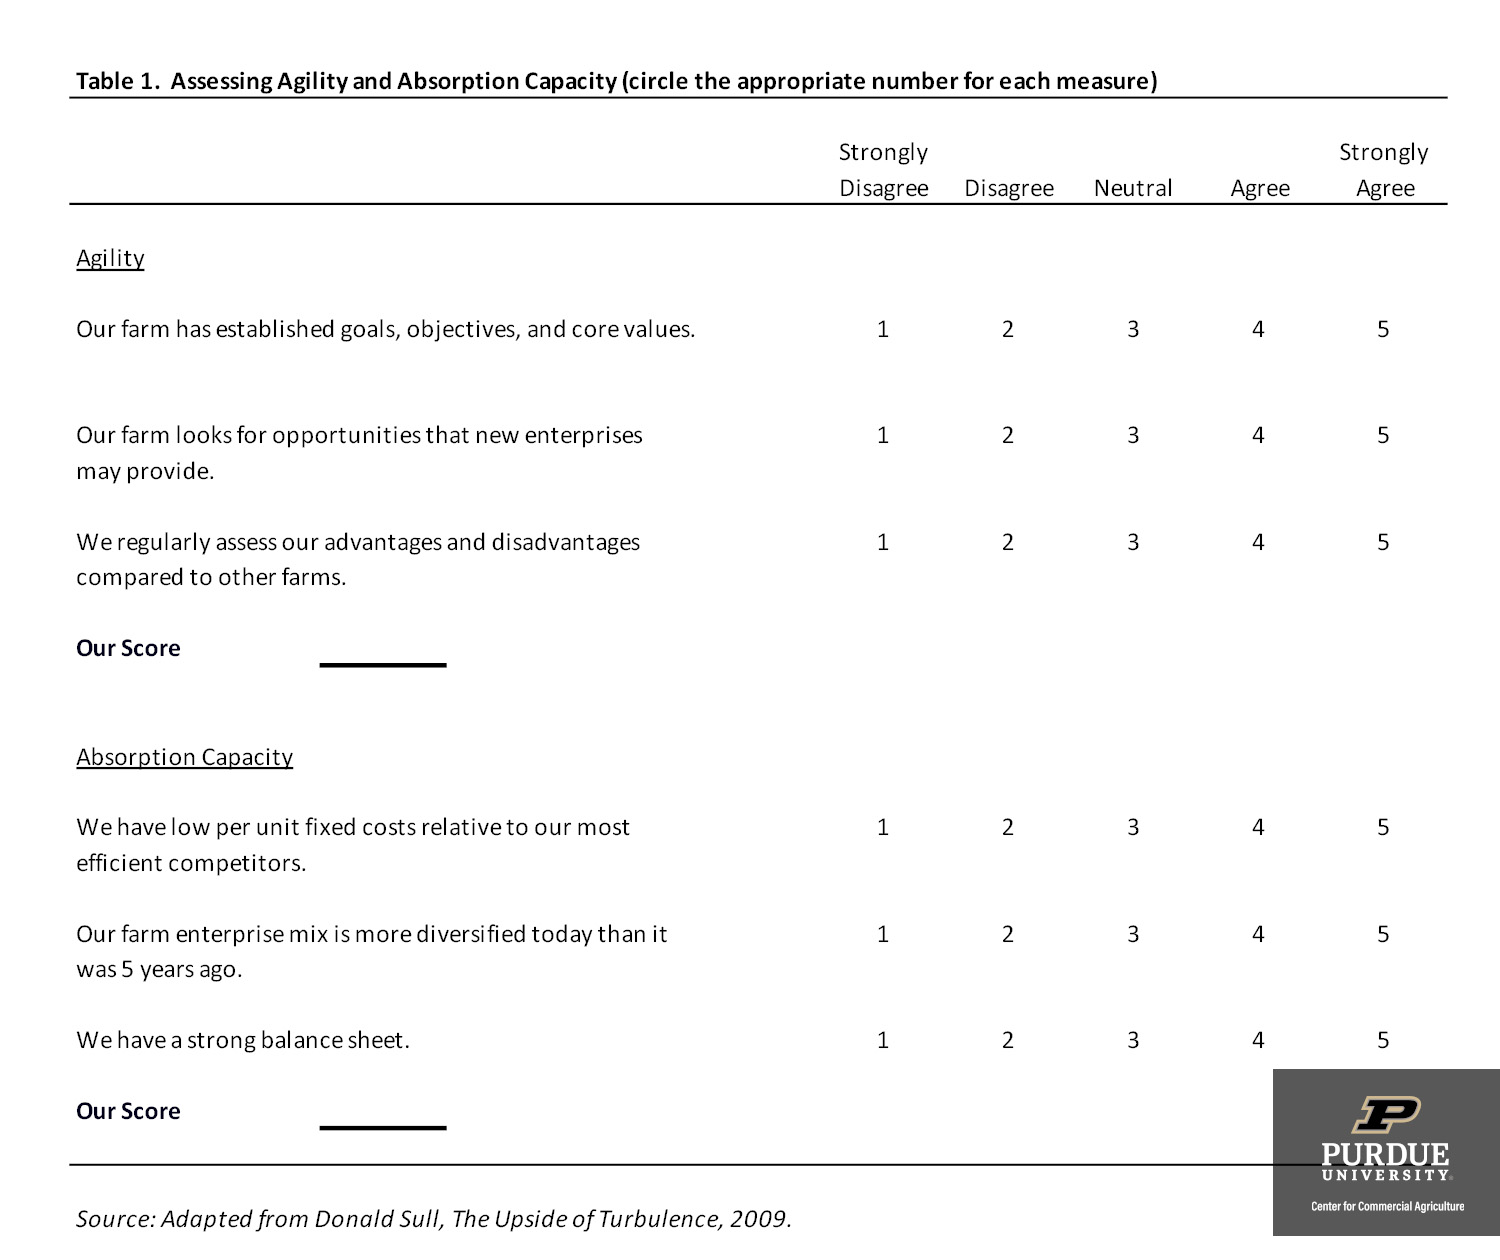
Table 1. Assessing Agility and Absorption Capacity (circle the appropriate number for each measure)
After evaluating a farm’s agility and absorption capacity, it is useful to compute and evaluate a farm’s liquidity position, which is often used as a proxy measure for slack (Daniel et al., 2004; Latham and Braun, 2008). Farms with lower scores on agility and absorption capacity, will likely have lower current ratios. Using a stoplight analogy, a current ratio above 2 is considered “green”. A ratio between 1 and 2 is “yellow” or concerning, and a ratio below 1 would be “red”. Though in general a current ratio above 2 is considered good, if the current ratio is relatively high (e.g., above 10), it is important to compare the benefits associated with a solid liquidity position with the returns that could be earned if some of the cash was invested in capital assets. These high current ratios may indicate excess slack and an inefficient business strategy.
Conclusions and Implications
Over the past several years, maintaining agility and absorption capacity has been a solid mechanism to deal with strategic risk. Absorption capacity has enabled farms to maintain some sense of stability with market turbulence caused by increases in input prices, Covid-19, trade restrictions, higher rental rates, fluctuations in labor availability, ongoing geopolitical conflict, and market downturns. As farms face these obstacles there is also a greater need for agility, including innovative techniques that can reduce business costs, enable workers to shift assignments to meet changing business needs, and diversify to reduce risk.
With rising input, machinery, and rental prices, alongside yield uncertainty from weather variation, many farmers may be unable to breakeven the next couple of years. These farms are left with two options, exit the industry, or take losses, relying on absorption capacity to carry them through the next year. Farms with low absorption capacity may not have the latter option. When these farms exit, expansion opportunities are then presented for other farms with higher absorption capacity and agility.
This article discusses the advantages associated with maintaining high levels of agility and absorption capacity. The concepts in this article are part of a continuing effort to improve understanding related to strategic risk. Using concepts in this article, we are conducting a survey of U.S. crop producers to assess their agility and absorption capacity. This article serves as the precursor to a subsequent article which will provide data analysis of the survey results.
References
Daniel, F., F.T. Lohrke, C.J. Fornaciari, and R.A. Turner Jr. (2004). “Slack Resources and Firm Performance: A Meta-Analysis.” Journal of Business Research, 57(6), 565-574. doi:https://doi.org/10.1016/S0148-2963(02)00439-3
Latham, S.F. and M.R. Braun. (2008). “The Performance Implications of Financial Slack during Economic Recession and Recovery: Observations from the Software Industry, 2001-2003.” Journal of Managerial Issues, 20(1), 30-50.
Lee, C. L. and H.C. Wu. (2016). “How do Slack Resources affect the Relationship between R&D Expenditures and Firm Performance?” R&D Management, 46(S3), 958-978. doi:https://doi.org/10.1111/radm.12141
Miller, K. D. and M.J. Leiblein. (1996). “Corporate Risk-Return Relations: Returns Variability versus Downside Risk.” Academy of Management Journal, 39(1), 91-122. doi:https://doi.org/10.5465/256632
Nohria, N. and R. Gulati. (1996). “Is Slack Good or Bad for Innovation?” Academy of Management Journal, 39(5), 1245-1264. doi:https://doi.org/10.5465/256998
Paeleman, I. and T. Vanacker. (2015). “Less is More, or Not? On the Interplay between Bundles of Slack Resources, Firm Performance and Firm Survival.” Journal of Management Studies, 52(6), 819-848. doi:https://doi.org/10.1111/joms.12135
Sull, D. (2009). How to Thrive in Turbulent Markets. Harvard Business Review, February 2009.
Tan, J. and M.W. Peng. (2003). “Organizational Slack and Firm Performance during Economic Transitions: Two Studies from an Emerging Economy.” Strategic Management Journal, 24(13), 1249-1263. doi:https://doi.org/10.1002/smj.351
Wang, H., J. Choi, J., G. Wan, G., and J.Q. Dong. (2016). “Slack Resources and the Rent-Generating Potential of Firm-Specific Knowledge.” Journal of Management, 42(2), 500-523.
Wang, Y., B. Guo, and Y. Yin. (2017). “Open Innovation Search in Manufacturing Firms: The Role of Organizational Slack and Absorptive Capacity. Journal of Knowledge Management, 21(3), 656-674.
![]()
![]()
![]()
![]()
![]()
TAGS:
TEAM LINKS:


RELATED RESOURCES
UPCOMING EVENTS
We are taking a short break, but please plan to join us at one of our future programs that is a little farther in the future.