May 4, 2023
Producer Sentiment and Farm Growth
by Michael Langemeier and James Mintert
![]()
![]()
![]()
![]()
![]()
There are numerous reasons why a farm may want to expand including the following: reduce costs, improve profit margins, improve asset utilization, bring in new family members, invest retained earnings, and more fully utilize the skills of key managers (Boehlje and Langemeier, 2018). The first three reasons are related to economies of size. In general, larger businesses have lower per-unit costs, higher profit margins, and are able to more fully utilize assets such as machinery and buildings, which improves the asset turnover ratio. Larger businesses also tend to retain more of their retained earnings (net farm income minus owner withdrawals), investing these retained earnings back into the business is a common strategy in family-owned businesses such as farms.
In addition to the factors noted above, it seems logical that producers that are more optimistic about the future are more likely to expand their businesses. This article explores the relationship between producer sentiment and farm growth.
Ag Economy Barometer
The Purdue University-CME Group Ag Economy Barometer index is computed each month to gauge producer sentiment for a group of U.S. agricultural producers (Mintert and Langemeier, 2023). The barometer’s index for February 2023 was 125 indicating that average sentiment was more positive than during the index’s base period (i.e., fourth quarter of 2015 and first quarter of 2016). The Ag Economy Barometer index is sub-divided into two sub-indices: the Index of Current Conditions and Index of Future Expectations. Index values for February 2023 for the two sub-indices were 134 for the Index of Current Conditions and 121 for the Index of Future Expectations.
In February 2023, the producer sentiment survey also posed a question pertaining to farm growth. Specifically, survey respondents were asked what annual growth rate they expected for their farm over the next five years. The results for this question can be found in figure 1. Approximately 50% of the survey respondents said their farm either had “no plans to grow” (33%) or “plan to exit or retire” (16%). Respondents who expect their farm to grow “less than 5% annually” or “from 5 to 10% annually” represented 19% and 22% of the total respondents, respectively. The percentage of respondents who expect their farm to grow 10% or more represented approximately 10% of the total respondents. To provide some context to these percentages a 5% (10%) annual growth rate would result in a doubling of farm size in 14 (7) years.
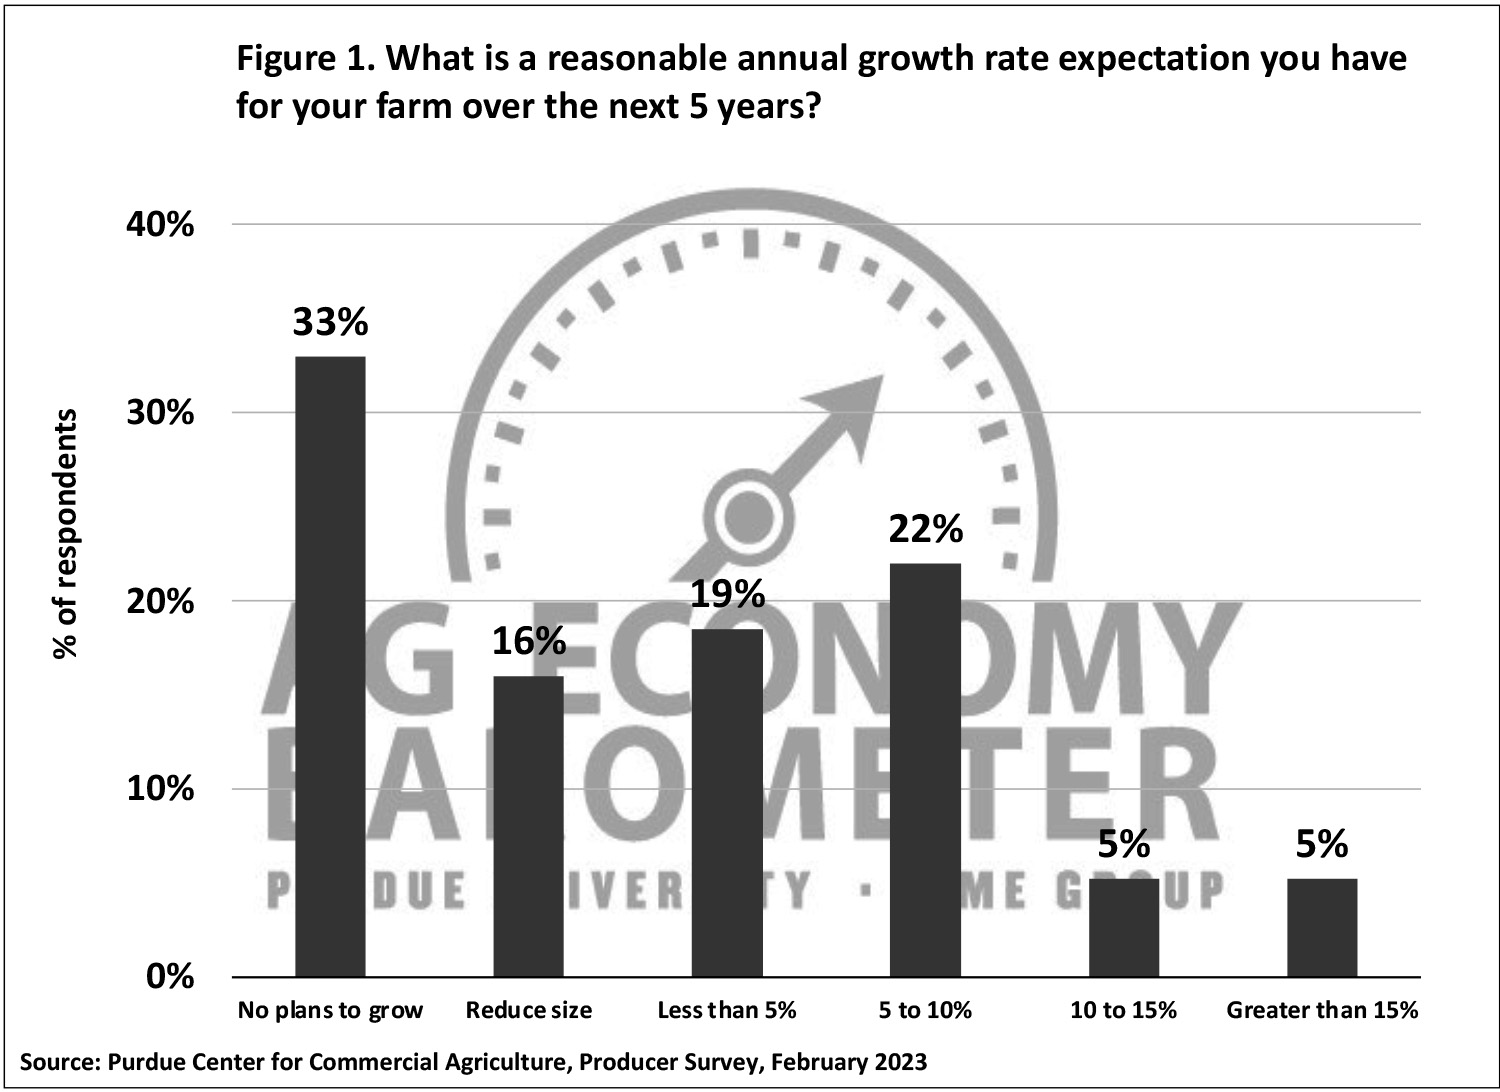
Figure 1. What is a reasonable annual growth rate expectation you have for your farm over the next 5 years?
Given that most of the survey respondents are full-time farmers, it may be surprising that approximately 50% of the respondents have no plans to expand their operations. It is important to remember, however, that at any given time, there are farms that do not have a successor identified. These farms are often starting to wind down their operations and have little or no interest in expansion. Barometer surveys have included the farm growth question annually starting in February 2016. Interestingly, the percentage of farms with no plans to expand has stayed relatively constant over the years. For example, in 2019, the year before COVID-19, 50% of the survey respondents expressed no plans to expand their farms (38% had no plans to grow and 12% planned to reduce their farm size).
Differences in Producer Sentiment among Farm Growth Categories
What explains the wide differences in farm growth prospects among respondents to the Ag Economy Barometer survey? We don’t have information pertaining to each survey respondent’s farm size or financial metrics. However, we can create a producer sentiment score for each individual farm. Table 1 contains the Ag Economy Barometer index calculations, as well as the two sub-indices, for respondents falling into three farm growth categories. The first category is composed of respondents who expect to reduce their farm’s size, the second category is composed of respondents who expect their farm’s size to remain unchanged, and the third category by respondents who expect to expand their operations in the next five years.
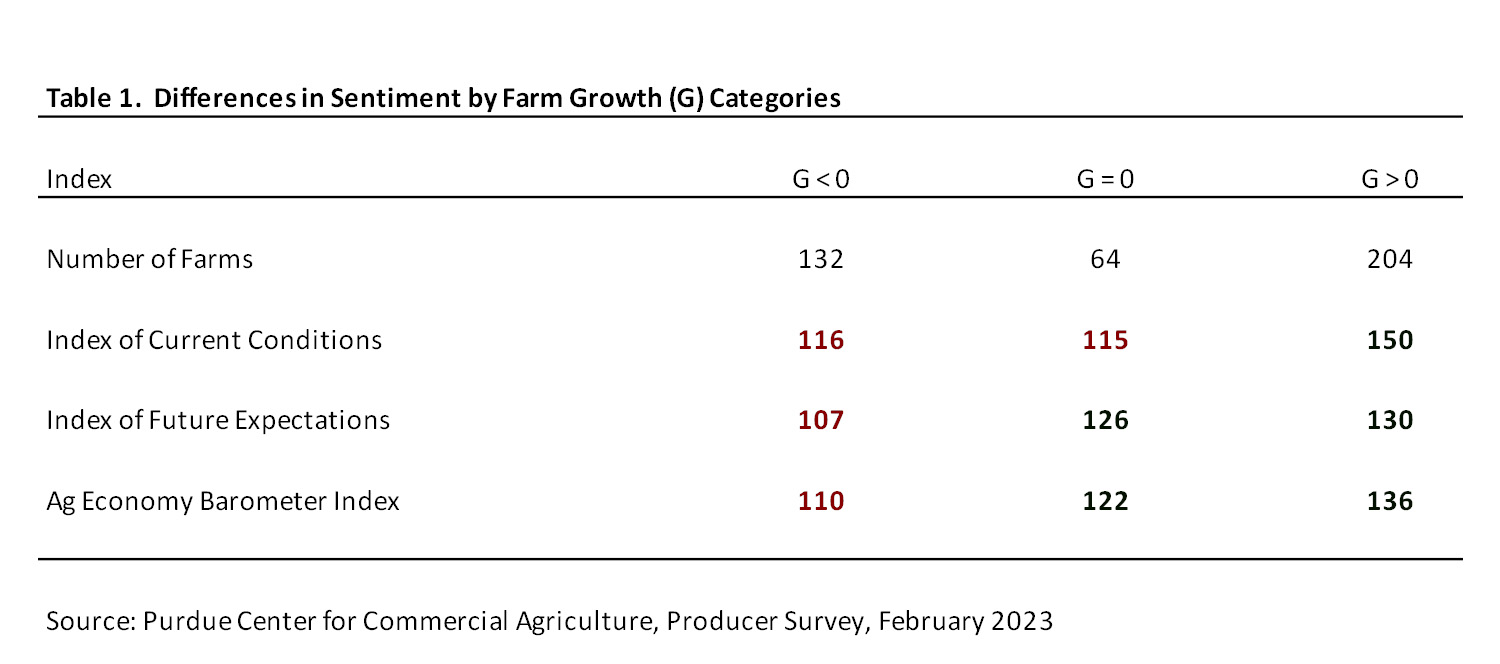
Table 1. Differences in Sentiment by Farm Growth (G) Categories
Examining table 1, it is clear that the farm operations who expect to expand are much more optimistic than operators who expect their farm’s size to hold steady or decline. The green numbers in table 1 indicate that the numbers in a specific row are statistically different that the red numbers in each line. Compared to an average index of 125, the Ag Economy Barometer index calculation for the group expecting to expand their operations was 136. This index was not statistically higher than the index computed for the group planning to stay the same size. The Index of Future Expectations calculation was similar for farms that expect to remain the same size and farms that plan on expanding. However, the Index of Current Conditions computed for farms that plan on expanding was substantially higher than indices computed for the other two farm groups. Why was this the case? We don’t have a clear-cut answer. One possibility is that, in addition to perhaps not having identified a successor, farm operations that plan on reducing or staying the same size may not be able to expand due to liquidity or solvency issues. Or perhaps they simply think that the next five years will not provide a good environment to expand their operations.
Final Comments
Growth enables farm businesses to increase revenue and earnings, take advantage of economies of size, and to more fully utilize the skills of current and future employees. Reasons why some farms plan to grow while others plan to hold farm size constant or even plan to reduce their operation’s size are varied. One possibility is that farm operators with plans to grow are more optimistic about the industry and their own farm’s prospects. This article briefly explored the relationship between producer sentiment and farm growth based on results from the Purdue University – CME Group Ag Economy Barometer February 2023 survey. Farm operators who expect to grow in the next five years are relatively more optimistic about both current and future prospects for production agriculture than operators who expect their farm’s size to remain unchanged or decline.
References
Boehlje, M. and M. Langemeier. “Farm Growth: Challenges and Opportunities.” Center for Commercial Agriculture, Purdue University, May 2018 (https://ag.purdue.edu/commercialag/home/resource/2018/05/farm-growth-challenges-and-opportunities/).
Mintert, J. and M. Langemeier. “Farmer Sentiment Dips in February.” Ag Economy Barometer, March 7, 2023 (https://ag.purdue.edu/commercialag/ageconomybarometer/).
![]()
![]()
![]()
![]()
![]()
TAGS:
TEAM LINKS:


RELATED RESOURCES
UPCOMING EVENTS
We are taking a short break, but please plan to join us at one of our future programs that is a little farther in the future.