


June 1, 2023
Contingency Planning with Cash Flow Shortages
by Michael Langemeier
![]()
![]()
![]()
![]()
![]()
A contingency plan is a course of action designed to help a business determine how to respond to possible future events. Contingency plans are often referred to as “Plan B”. One of the most common contingency plans used by a business, particularly a small business, relates to how to respond to the departure or absence of key personnel. Contingency plans related to how to respond to changes in projected cash flows are also important. Given the expected drop in crop prices this fall, it would be prudent for a farm to examine the sensitivity of their cash flow and repayment capacity to changes in crop prices. This article illustrates the use of contingency plans for a case farm in southwest Indiana.
Sources and Uses of Funds
In addition to providing a mechanism for reporting how a farm’s performance during an accounting period influenced and was influenced by major funding activities, a sources and uses of funds statement is useful when developing contingency plans. Specifically, this statement can be used to examine whether the farm has enough cash flow from the farm to repay debt and purchase assets. An example of a sources and uses of funds statement using historical data is illustrated and described by Langemeier (2020).
The five primary categories of a sources and uses of funds statement are beginning cash balances, cash flows from operating activities, cash flows from investing activities, cash flows from financing activities, and ending cash balances. Cash flows from operating activities are computed by subtracting cash farm expenses, owner withdrawals (e.g., family living withdrawals), and income and self-employment taxes from cash farm receipts. Cash flows from investing activities are computed by subtracting capital asset purchases from capital asset sales. If a farm is planning on purchasing assets, cash flows from investing activities will be negative. In other words, cash flows from operating activities or from financing activities will need to be used to help pay for the assets. Cash flows from financing activities are computed by subtracting principal payments from loans received during the year. If principal payments are higher than loan receipts, cash flows from financing activities are negative. Conversely, if principal payments are smaller than loan receipts, cash flows are positive.
Financial metrics and sources and uses of funds for a case farm in southwest Indiana will be examined below using a pro-forma spreadsheet that is available on the Center for Commercial Agriculture website. To use the pro-forma spreadsheet the following information is needed: current assets, current liabilities, crop acres, crop income (bushels in storage, crop prices, and crop yields), other income (e.g., beef income), crop and livestock expenses per acre or head, assets sales and purchases, and nonfarm income and expenses (e.g., family living expenses). When conducting a pro-forma analysis, it is common to use more than one scenario. In this article, we will use three crop price scenarios for sales this fall and ending inventories. The price scenarios were developed using historical basis and futures prices. For futures prices, the 25th percentile, the 50th percentile, and the 75th percentile for corn and soybeans were obtained in late May from the iFarm Price Distribution Tool. Cash prices were then computed by adding historical basis to futures prices.
Case Farm Example
Let’s use the cash flow definitions above to look at an example. The case farm is located in southwest Indiana and has crop acres and a small beef cowherd. Gross revenue and net farm income in 2022 were $856,737 and $225,148, respectively. The operating profit margin in 2022 for the case farm was 24.6 percent. The farm has solid liquidity and solvency positions. Relatively strong cash flows in 2022 enabled the farm to purchase approximately $150,000 worth of machinery. The farm is planning on purchasing at least some machinery and equipment in 2023 if the capital debt repayment margin is positive.
There are least four different sources of cash that can be used to purchase machinery and equipment. Having said that, it is likely that a combination of these sources would be utilized. First, the farm could draw down cash balances. This would reduce liquidity, which may not be prudent. Second, the farm could use cash flows from operating activities, assuming that this number is positive. Third, the farm could sell other assets to help make the purchase. Fourth, the farm could borrow money to help pay for the asset. Where does contingency plans come in? If cash flow becomes relatively tight as the year progresses, cash flows from operating activities may be relatively small. In this instance, the farm will likely not purchase additional machinery in 2023.
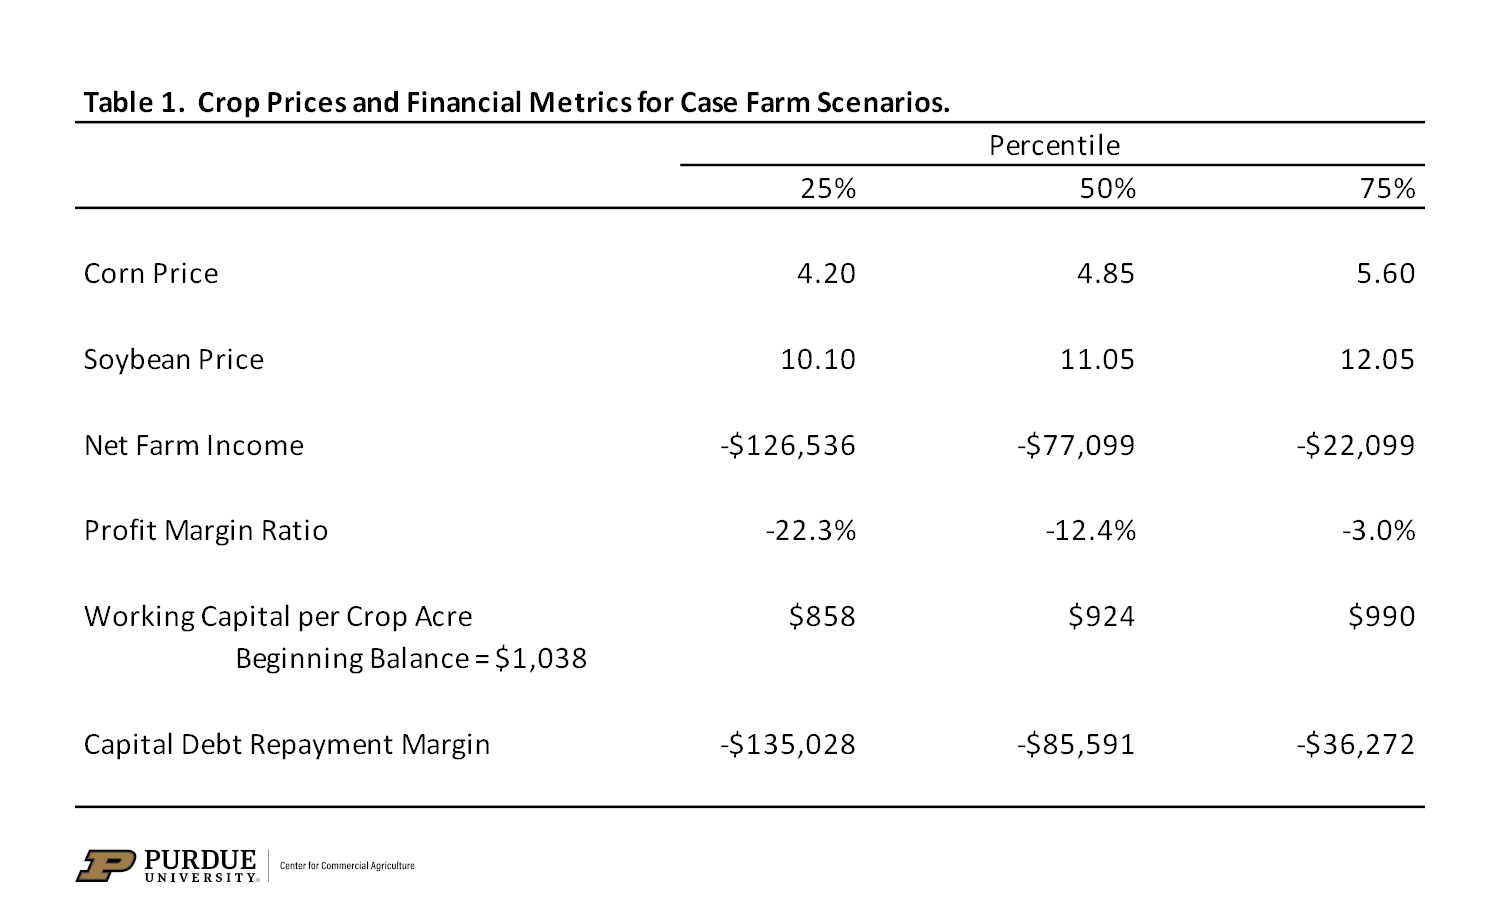
Table 1. Crop Prices and Financial Metrics for Case Farm Scenarios.
Table 1 presents crop prices and financial metrics for each crop price scenario. The only difference between the scenarios are the expected crop prices for fall sales and ending inventories. Net farm income, the operating profit margin ratio, and the capital debt repayment margin were negative for all three scenarios. The negative capital debt repayment margin indicates that this farm does not have enough cash flow from operating and financing activities to fully cover principal and interest payments on noncurrent debt. Working capital per crop acre declined $180 for the 25th percentile, $114 for the 50th percentile, and $48 for the 75th percentile. Simply put, crop prices under all three scenarios are not high enough for the farm to breakeven. Given the low net farm income under each crop price scenario, the case farm will likely defer machinery and equipment purchases to a later year. Depreciation for this farm is approximately $65,000. Thus, if the farm does not purchase any machinery in 2023, it will not be able to replace the value of machinery that was depreciated during the year. Long-term, it will need to do so.
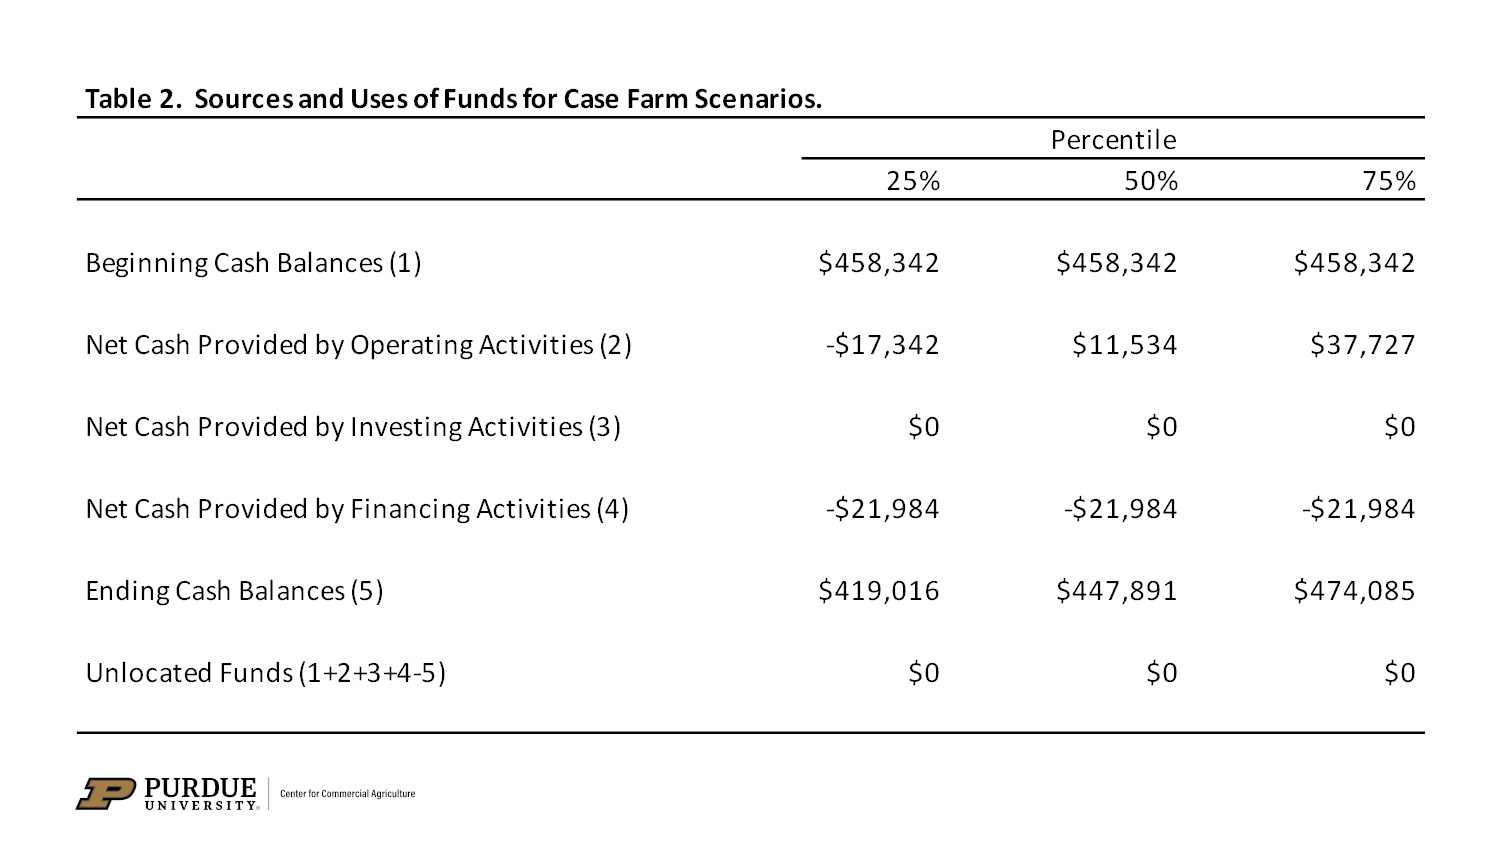
Table 2. Sources and Uses of Funds for Case Farm Scenarios.
The primary categories for projected sources and uses of funds are illustrated in table 2. The net cash provided by investing activities excludes potential asset sales and purchases. The net cash provided by financing activities was negative reflecting the payment of term debt during the year. Net cash from operating activities was negative for the low crop price scenario, and was $11,534 and $37,727 for the medium price and high crop price scenarios, respectively. Note that depreciation, because it is a non-cash expense, is not subtracted from cash farm receipts when computing net cash provided by operating activities. As noted above, depreciation is projected to be approximately $65,000 in 2023. Thus, to a large extent this farm will be living off of depreciation in 2023. Net cash provided by operating activities would have been much lower without the relatively strong crop prices experienced for the sale of the remaining crop inventories from the 2022 crop in early 2023. The ending cash balance was lower than the beginning cash balance for the low price and medium price scenarios. For the high price scenario, the ending cash balance was approximately $15,750 higher than the beginning cash balance.
Summary and Conclusions
This article briefly discussed the use of contingency planning to project cash flow and repayment capacity. As cash flows from the farm operation become tighter, it is necessary to find other funds to help pay for asset purchases or delay asset purchases, and to repay debt. A case farm was used to illustrate how contingency plans could be used. Unless crop price prospects improve it would be difficult for the case farm to purchase assets, such as machinery and equipment, later this year. Working capital will be drawn to meet term debt obligations under each of the three crop price scenarios examined even if the farm does not purchase machinery and equipment in 2023. Given the potential volatility of crop prices this summer, it would be prudent to periodically update cash flow projections.
References
Langemeier, M. “Sources and Uses of Funds Statement.” Center for Commercial Agriculture, Purdue University, August 26, 2020.
![]()
![]()
![]()
![]()
![]()
TAGS:
TEAM LINKS:

RELATED RESOURCES
UPCOMING EVENTS
We are taking a short break, but please plan to join us at one of our future programs that is a little farther in the future.