May 9, 2024
Corn & Soybean Basis Continue to Strengthen Despite Being Significantly Weaker than Historical Basis Levels
by Nathanael Thompson
![]()
![]()
![]()
![]()
![]()
In recent weeks, corn basis has continued to strengthen steadily at many locations across the eastern Corn Belt. For example, corn basis in central Indiana for the second week of May was $0.22/bu. under July ’24 corn futures (Figure 1). This is $0.13/bu. stronger than the first week of March. Despite steady strengthening, corn basis remains significantly weaker than the historical 3-year average corn basis for the region. For example, current corn basis in central Indiana is $0.35/bu. weaker than the average corn basis level for the second week of May for the most recent three years (2020-2021, 2021-2022, and 2022-2023).
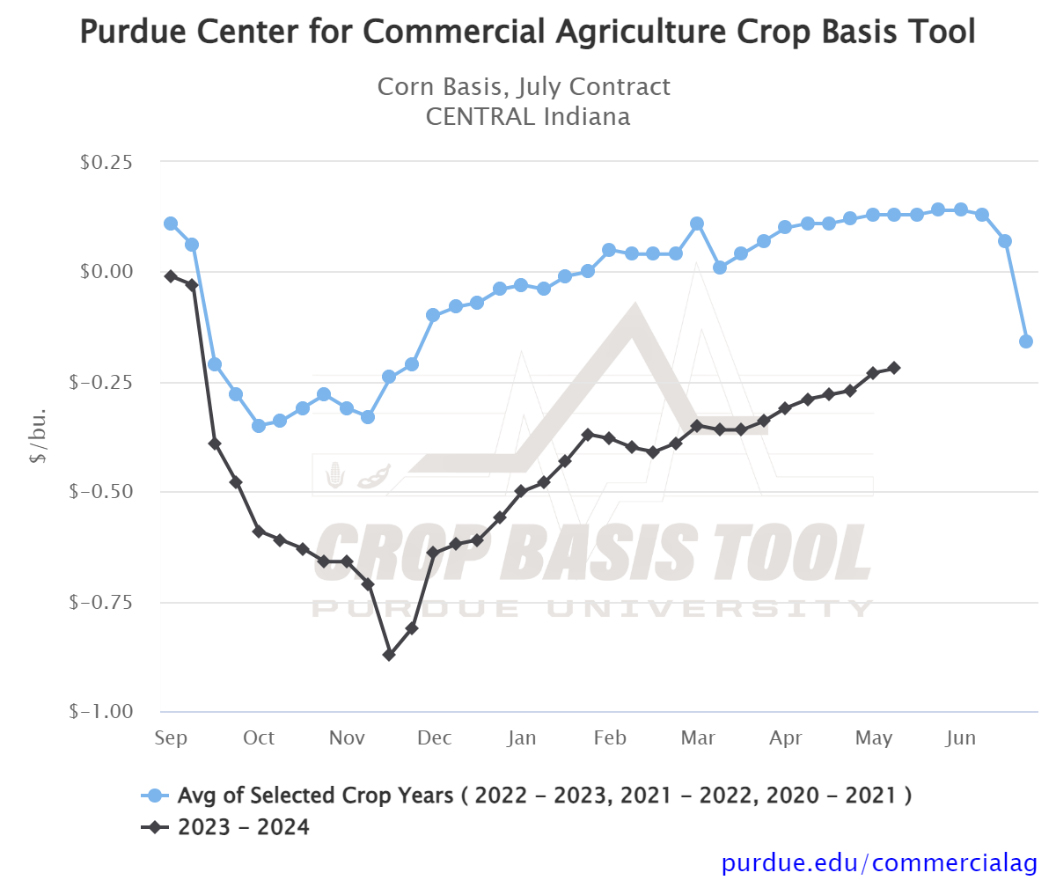
Figure 1. Corn Basis, July Contract for Central Indiana
Soybean basis has also been steadily strengthening in recent weeks. For example, soybean basis in central Indiana for the second week of May was $0.26/bu. under July ’24 soybean futures (Figure 2). This is $0.09/bu. stronger than the first week of March but is $0.35/bu. weaker than the historical 2-year average soybean basis for the region.
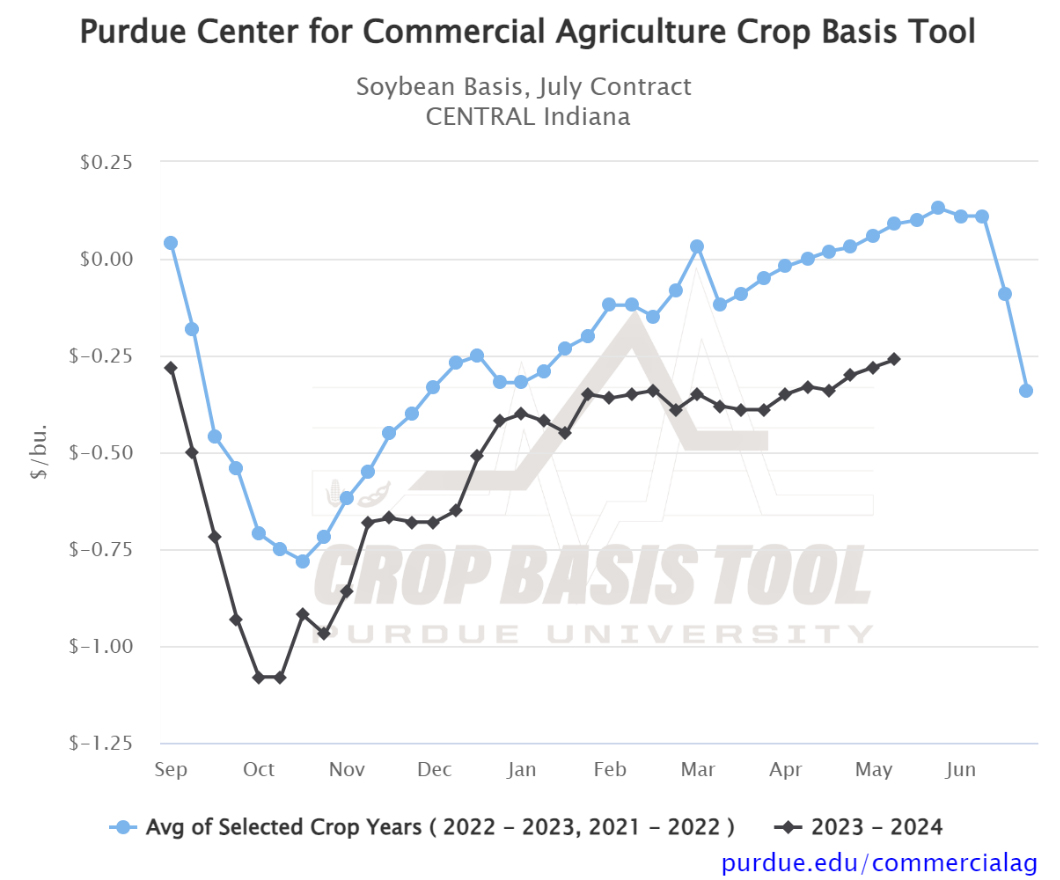
Figure 2. Soybean Basis, July Contract for Central Indiana
According to USDA’s May 6, 2024 Crop Progress Report, about 20% of Indiana corn and 20% of Indiana soybeans have been planted. Therefore, attention on planting progress and new crop conditions for the ’24 crop will continue to weigh heavily on old crop basis levels in the coming weeks. As a result, our research has shown that predicting basis levels during May, June, and even July is very difficult. Those still owning ’23 crop will want to be cognizant of this risk and pay close attention to basis levels if they plan to continue owning grain into the summer months. As always, be sure to visit the Purdue Center for Commercial Agriculture Crop Basis Tool to check current corn and soybean basis levels and historical basis trends in your local area.
![]()
![]()
![]()
![]()
![]()
TAGS:
TEAM LINKS:

RELATED RESOURCES
UPCOMING EVENTS
We are taking a short break, but please plan to join us at one of our future programs that is a little farther in the future.