January 17, 2025
Indiana crop basis to nearby contracts are stable through the first half of January
by Josh Strine
![]()
![]()
![]()
![]()
![]()
Through the first three weeks of January, corn and soybean basis have been stable or weakened slightly. This is a continuation of the stabilization and slight weakening that started in December and follows statewide strengthening throughout November. Before November, the 2024-2025 crop basis levels were well below the three-year average. The aggressive strengthening in November moved the current year’s basis more in line with the historical average. The 2024-2025 basis has followed the historical trend closely ever since.
Figure 1 depicts the nearby corn basis for Northwest Indiana. The patterns discussed in the previous paragraph are very evident. Through November, corn basis to December futures strengthened by $0.19/bu. Since the first week of December, corn basis to March futures stayed within a $0.03/bu. range and was -$0.32 as of January 15th. Based on the three-year average, continued stability or slight strengthening may be forecasted over the next five weeks. Similar patterns in corn and soybean basis have been observed across the state with differing levels of variability.
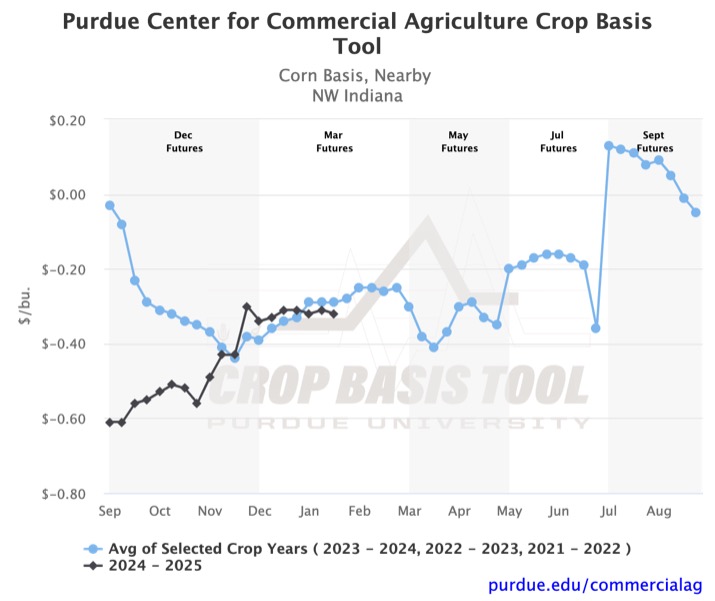
Figure 1. Corn Basis, Nearby Contract for Northwest Indiana
Figures 2 and 3 show the corn basis in Northwest Indiana for March and September futures, respectively. While both basis are calculated on the same regional cash prices, the disparity in the movement of futures contracts results in very different patterns. Over the past six weeks, the basis to March contracts strengthened by $0.02/bu. The basis to September contracts has strengthened by $0.16/bu. during the same period. It is important to understand how movement in cash or futures prices can affect your local basis. The historical trends also project different levels of strengthening over the next five weeks. As always, you can visit the Purdue Center for Commercial Agriculture Crop Basis Tool to see your local basis and what the historical trends suggest future movement may be.
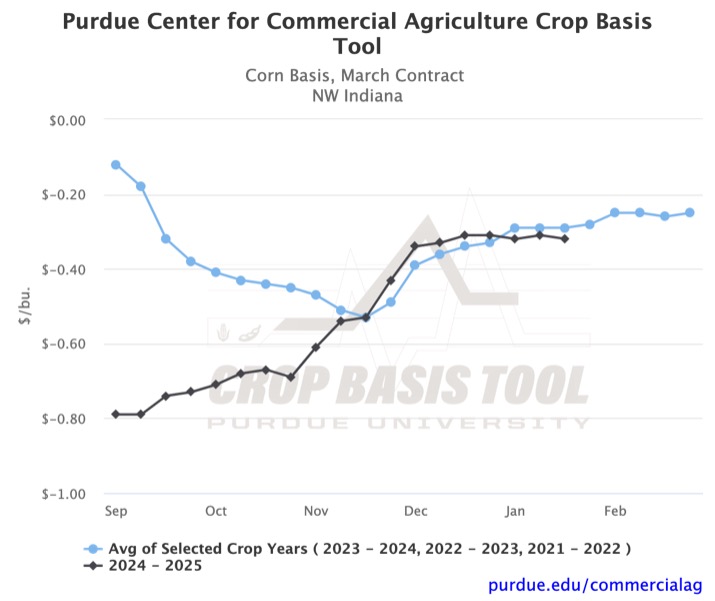
Figure 2. Corn Basis, March Contract for Northwest Indiana
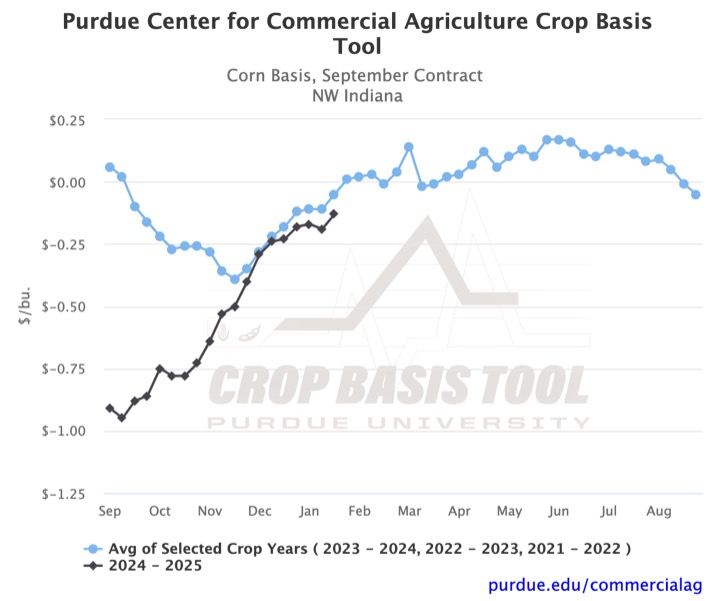
Figure 3. Corn Basis, September Contract for Northwest Indiana
![]()
![]()
![]()
![]()
![]()
TAGS:
TEAM LINKS:

RELATED RESOURCES
UPCOMING EVENTS
We are taking a short break, but please plan to join us at one of our future programs that is a little farther in the future.