February 14, 2025
February Indiana Crop Basis Update & Using the Crop Basis Tool to Plan Storage Hedges
by Josh Strine
![]()
![]()
![]()
![]()
![]()
Since the beginning of December, corn and soybean basis across Indiana have generally been stable. Table 1 shows the current, minimum, and maximum basis relative to March futures since the first week of December for each crop reporting district in Indiana. Over the 10 weeks, most basis levels stayed within a $0.10/bu. range. Basis levels for Southern Indiana regions are in bold to draw attention to the increased volatility in the region. While there is a wide range in Southern Indiana corn basis, the basis levels are very close to the basis at the beginning of December.
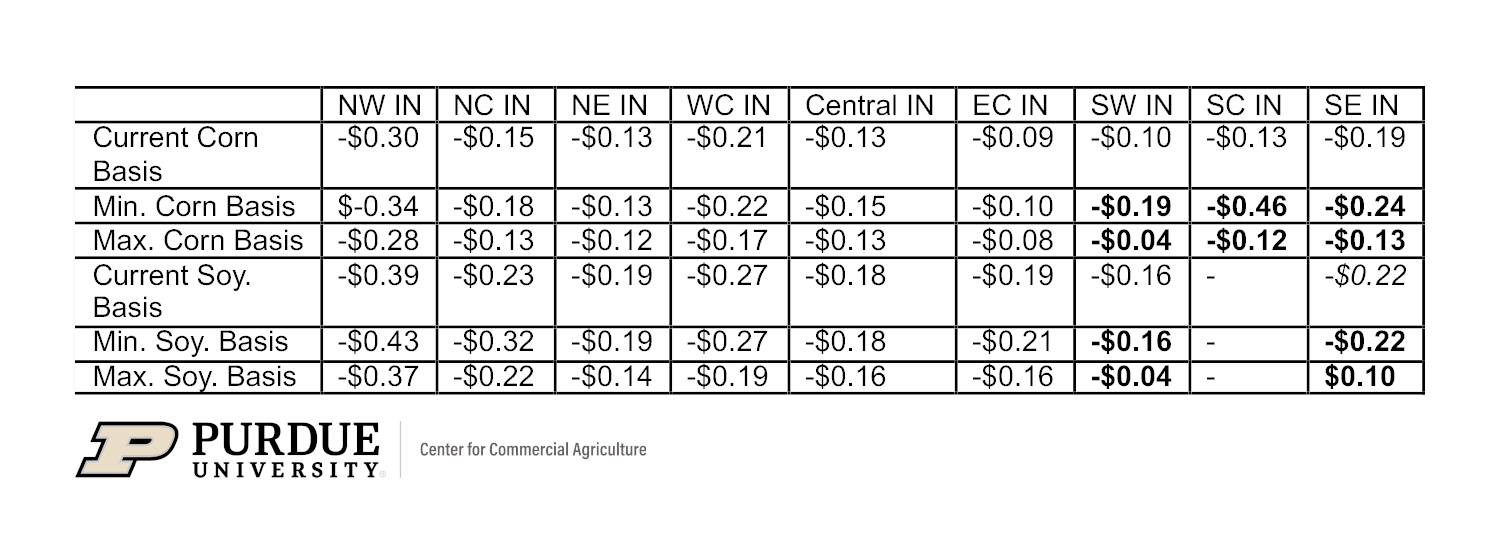
Table 1. Indiana Current, Minimum, and Maximum Basis Relative to March Futures Since the First Week of December.
The volatility of soybean basis in SE Indiana has led to a significantly weaker basis in the region than at the beginning of December. The weakening of the SE Indiana soybean basis can be seen in Figure 1. Historically, the basis had strengthened in the region between December and February. The inverted trend in 2025 has led to a basis below the historical average in the district. While the three-year average would suggest an increase over the next few weeks, recent divergence from the trend would advise caution.
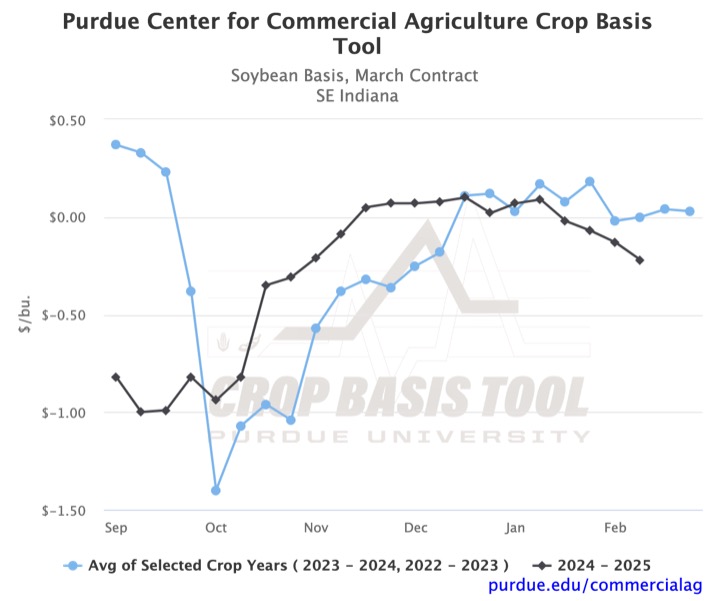
Figure 1. Soybean Basis, March Contract for Southeast Indiana
In addition to SE Indiana, soybean processors basis and Ohio River soybean basis have also weakened over the past two months. Figure 2 and Figure 3 show the respective basis levels relative to March futures. Over the past ten weeks, soybean processor basis in Indiana has weakened by $0.16/bu. The soybean basis at the Ohio River has weakened by $0.15/bu. Both basis levels are still higher than any regional basis, indicating a price premium compared to regional delivery points.
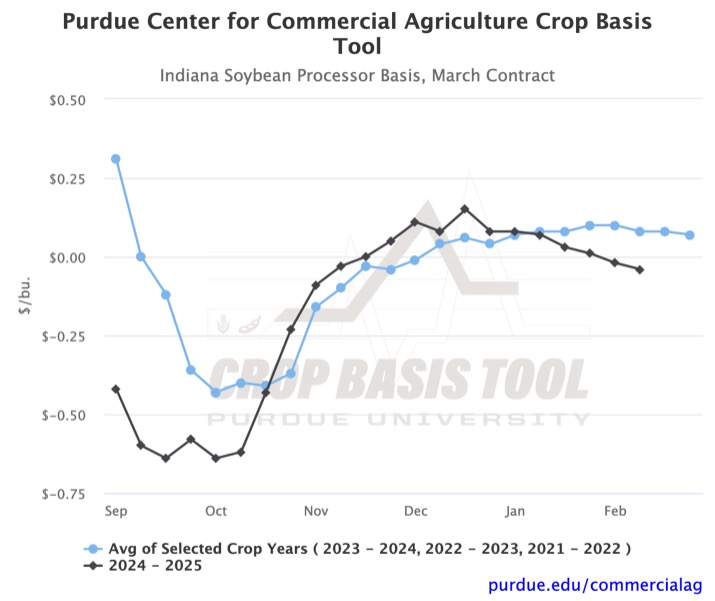
Figure 2. Indiana Soybean Processor Basis, March Contract
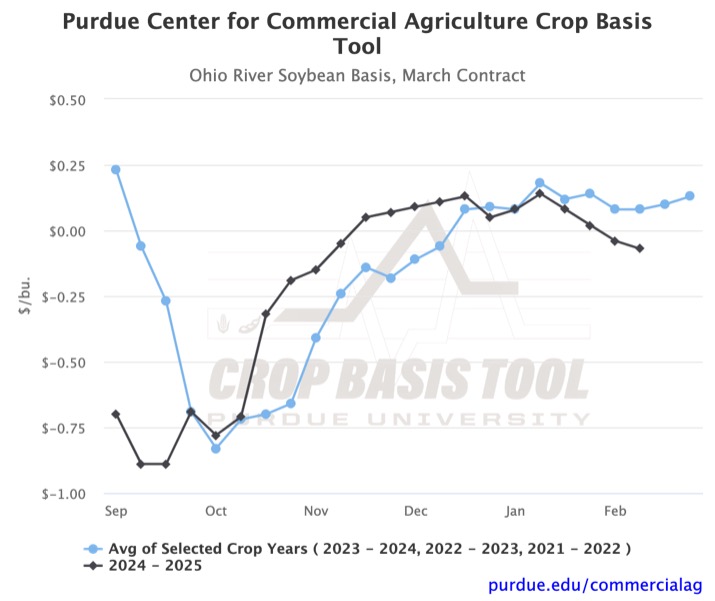
Figure 3. Ohio River Soybean Basis, March Contract
For a farmer considering using a storage hedge, all three figures show how much timing can affect the profitability of the hedge. A storage hedge consists of three actions. First, a futures contract is sold to lock in a price. At a later date, before the future contract expires, the farmer buys back a futures contract to offset the sale and delivers their grain to a local delivery point. If a storage hedge on March futures had been initiated in early October, the stronger February basis would have generated increased profit. If the hedge had been initiated in late November, the relatively weaker basis in February would have resulted in a slight loss from the hedge. While there has been some variance between this year and the historical average, the figures show that the best time to take hedging actions still coincides with the three-year average. To see how your local basis has moved or consider your storage hedge opportunities, check out the Purdue Center for Commercial Agriculture Crop Basis Tool.
![]()
![]()
![]()
![]()
![]()
TAGS:
TEAM LINKS:

RELATED RESOURCES
UPCOMING EVENTS
We are taking a short break, but please plan to join us at one of our future programs that is a little farther in the future.