March 14, 2025
Corn and Soybean Basis Strengthen Across the Midwest Amidst Decreasing Prices
by Josh Strine
![]()
![]()
![]()
![]()
![]()
Between February 12th and March 12th, the markets for corn and soybeans significantly changed. On February 12th, May futures for corn and soybeans were $5.04/bu. and $10.46/bu., respectively. As of the market close on March 12th, May futures for corn and soybeans were $4.61/bu. and $10.00/bu., respectively. As market prices have dropped, corn and soybean basis across the Midwest have strengthened. The basis strengthening is a welcomed change following over 2 months of weakening or unchanging basis. The falling market prices have decreased the value of uncontracted stored grain. Stored grain hedged through futures markets has increased in value over the last month as the basis has strengthened.
In general, the basis strengthening has been greater in soybeans than corn over the past four weeks. Additionally, states and agricultural statistical districts have variable basis movement. Figure 1 shows the soybean basis to May futures in Northwest Illinois. Between February 12th and March 12th, the soybean basis strengthened by $0.26/bu. in the district. The strengthening moved the district’s basis closer to the market year high of -$0.40/bu. As shown in Figure 2, soybean basis strengthening to May futures was more muted in Central Indiana. Over the past four weeks, the basis increased by $0.16/bu. to reach a marketing year high of -$0.20/bu. In both regions, the basis is at or below the two-year average. Historical trends suggest a slight strengthening of basis as May futures reach expiration.
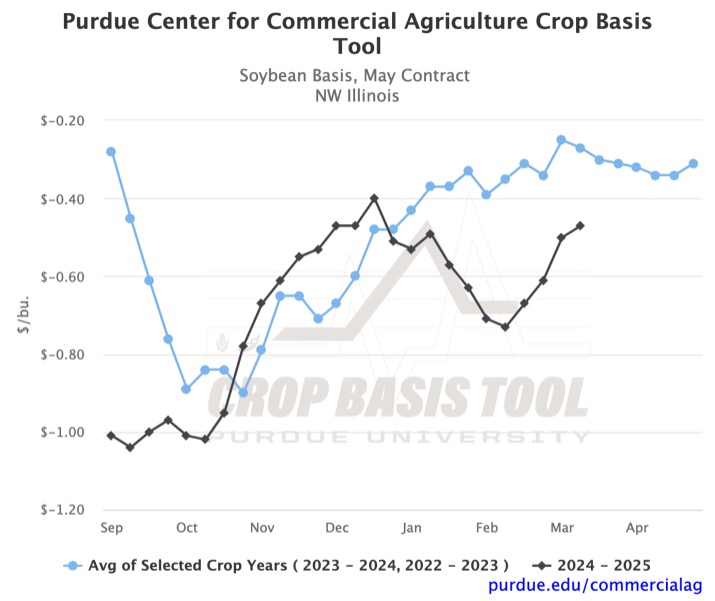
Figure 1. Soybean Basis, May Contract for Northwest Illinois
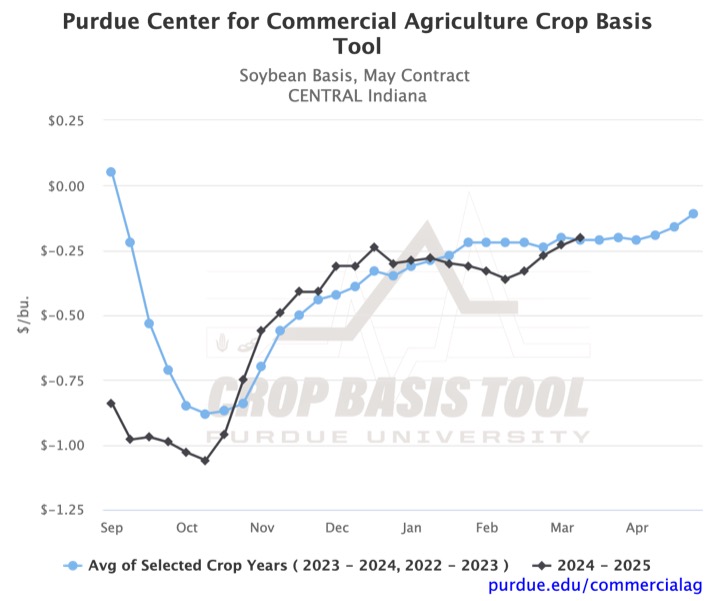
Figure 2. Soybean Basis, May Contract for Central Indiana
While Corn basis has also strengthened over the past month, the change has been less pronounced across the Midwest. Figure 3 shows Central Indiana’s corn basis to May futures. Similarly, Figure 4 shows the corn basis to May futures in Southwest Michigan. Since February 12th, the basis in Central Indiana has increased by $0.09/bu. to a marketing year high of -$0.18/bu. It strengthened by $0.21/bu. in Southwest Michigan to a marketing year high of -$0.41/bu. Once again, the basis movement was milder in Indiana. In both regions, historical trends suggest further strengthening over the next couple of weeks before declining as May futures expire.
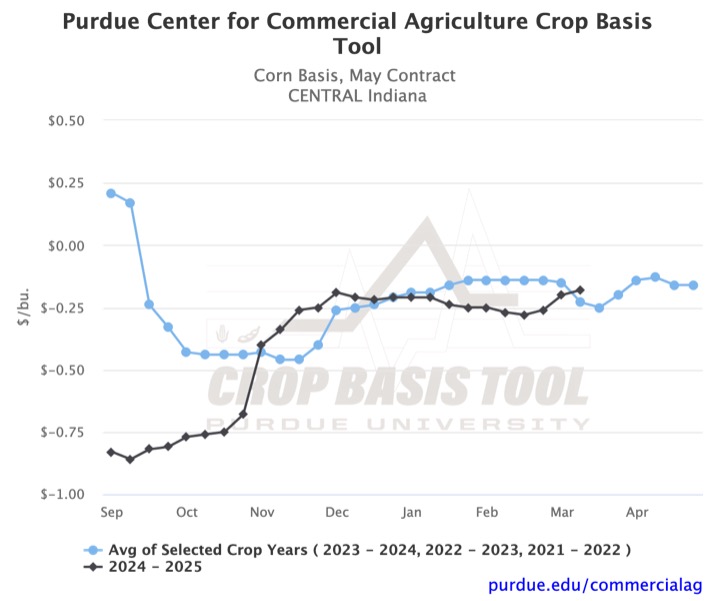
Figure 3. Corn Basis, May Contract for Central Indiana
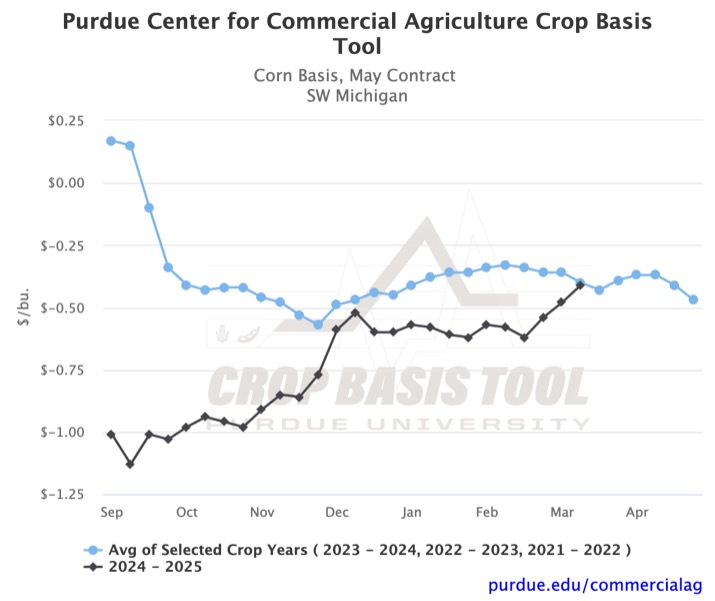
Figure 4. Corn Basis, May Contract for Southwest Michigan
Basis at specialty delivery points, which include ethanol plants, soybean processors, and Ohio River delivery, had basis movement that followed the district-level changes. All of the state-level specialty delivery points had varying levels of basis strengthening over the past month. Changes at soybean processors were generally greater than changes at ethanol plants. Additionally, the soybean basis at the Ohio River increased more than the corn basis at the Ohio River.
Looking at the four plots, evidence of the potential basis strengthening was observable on February 12th. First, all four basis levels were below the historical average. In retrospect, we saw the largest strengthening where the basis was weaker relative to the historical trend. Second, both historical trends in soybean basis suggested a slight strengthening in February and March. Even if the basis had not converged to the historical averages, a slight increase would have been expected for soybeans. Based on the evidence, the current basis relative to the historical average and the movement of the historical average in the coming months should be considered when forecasting future basis movement. To forecast your local crop basis or view the specialty delivery point basis in your state, check out the Purdue Center for Commercial Agriculture Crop Basis Tool.
![]()
![]()
![]()
![]()
![]()
TAGS:
TEAM LINKS:

RELATED RESOURCES
UPCOMING EVENTS
We are taking a short break, but please plan to join us at one of our future programs that is a little farther in the future.