May 27, 2025
Cost Efficiency Comparisons of U.S. and Canadian Farms
by Michael Langemeier and Yike Li
![]()
![]()
![]()
![]()
![]()
Introduction
The rapid development of agricultural science and technology, intelligent management systems, and efficient production processes allows for a higher output with limited resources. However, taking full advantages of these developments requires the assessment of relative performance of individual or typical farms. Thus, it is important to understand the cost efficiency of production (Walters, 2016). The more efficient a farm is, the more competitive advantage this farm will have. Competitive advantage may be derived from technological progress and/or innovation in the management system. Technological and management innovations help farms optimize resource allocation and subsequently improve production efficiency.
The objective of this paper is to measure the cost efficiency of corn and soybean production for six typical farms in North America (three in Canada and three in the United States). All these farms produce both corn and soybeans. Cost efficiency is measured using data envelope analysis. In addition to comparing efficiency indices, cost shares of the most efficient farm is compared to cost shares for the other five farms.
Literature Review
Case farms or typical farms are commonly used to analyze and compare alternative production systems (Feuz and Skold, 1992). When developing case farms or typical farms it is important to ensure that the resource base and technological constraints are typical, which is different than simply using averages for a group of farms. Typical farm comparisons among countries can be used to examine competitiveness, which is an indicator of the ability to supply goods and services sought by buyers at prices that are as good as or better than those of other potential suppliers, while earning at least the opportunity cost of returns on resources employed (Frohberg and Hartmann, 1997).
Cost efficiency can be used to measure the performance of individual businesses, and is useful when trying to understand bottlenecks to performance and when trying to improve managerial decisions (Abiri et al., 2023). Assessing cost efficiency can reveal problems in the production process, and provide support for reallocating resources.
Several studies, including Lunik (2015), Purdy and Langemeier (2020), Wang and Hu (2021), and Langemeier (2024a, 2024b) have used data from the agri benchmark network to examine the relative efficiency of typical farms around the world. The agri benchmark network collects data on beef, cash crops, dairy, pigs and poultry, horticulture, and organic production. The network of typical farms was developed to understand and compare current farm production systems around the world. Participant countries follow a standard procedure to create typical farms that are representative of national farm output shares, and categorized by production system or combination of enterprises and structural features. Costs and revenues are converted to U.S. dollars so that comparisons can be readily made.
Lunik (2015) used data from the agri benchmark network for the 2008 to 2013 period to compare production costs and input use for typical farms with corn and/or soybeans located in 16 countries. Results indicated that some farms maintained high-cost efficiencies over time. These farms have successfully reduced production costs per unit and have become industry benchmarks. Factors such as farm size and crop intensity were shown to have a significant impact on cost efficiency. Specifically, large farms had high efficiency when it comes to corn production and crop intensity was closely related to the efficiency of soybean production.
Purdy and Langemeier (2020) examined the cost efficiency of corn and soybean production for typical farms involved in the agri benchmark network using data for the 2013 to 2017 period. Comparisons included 24 farms with corn data representing 13 countries, 15 farms with soybean data representing 8 countries, and 13 farms with both corn and soybean data representing 6 countries. Average cost efficiency for typical farms that produced corn, soybeans, and both corn and soybeans was 0.749, 0.774, and 0.939, respectively. Inefficient farms tended to over-utilize direct, operating, and overhead costs. The economic profit for soybeans was substantially higher than the economic profit for soybeans. As a result, cost efficiency was significant and positively related to the percentage acres planted to soybeans, and the revenue share for soybeans.
Wang and Hu (2001) examined the technical efficiency of corn production using data for the 2012 to 2019 period for 18 typical farms across 12 countries participating in the agri benchmark network. Average technical efficiency was 86.3 percent. Both intensive tillage and conservation tillage systems exhibited high technical efficiency.
Recently, Langemeier (2024a, 2024b) examined the competitiveness of corn and soybean production for important international regions using 2018 to 2022 data from the agri benchmark network. Analysis included data for six typical farms from five countries. Yield, gross revenue, and costs for corn and soybeans were relatively higher for the U.S. farms. In general, the 2018 to 2022 period was a profitable period for corn and soybean production with most of the typical farms earning an economic profit for both corn and soybeans.
Data and Methods
Data from six typical farms with corn and soybean enterprise data from Canada and the United States were used in this paper. It is important to note that enterprise data is collected from other countries involved in the agri benchmark network. Data were selected to provide a deeper dive into the comparisons made in Langemeier (2024a, 2024b) for Canada and the United States.
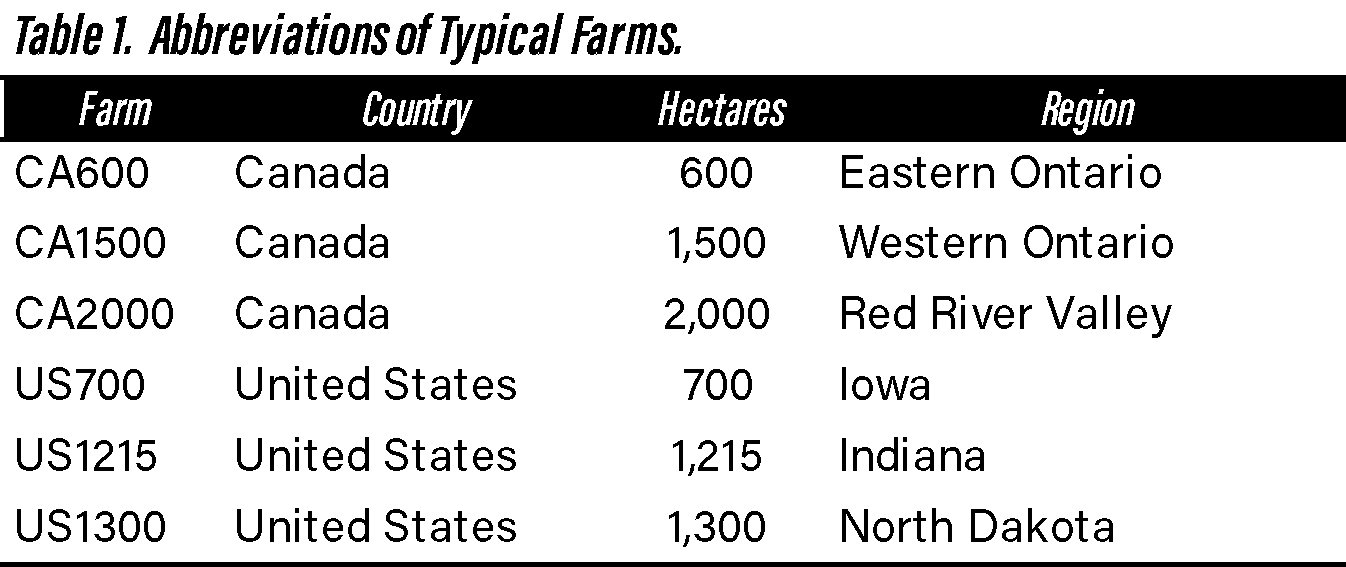
Table 1. Abbreviations of Typical Farms.
The farm and country abbreviations used in this paper are listed in table 1. While the farms may produce a variety of crops, this paper only considers corn and soybean production. Typical farms in the agri benchmark network are defined using country initials and hectares on the farm. To fully understand the relative importance of the corn and soybean enterprises on each typical farm, it is useful to note all the crops produced. The Eastern Ontario, Iowa, and Indiana farms produced corn and soybeans in rotation. In addition to corn and soybeans, the Western Ontario farm also produced winter wheat. The Red River Valley farm produced corn, soybeans, summer rapeseed, and summer wheat. The North Dakota farm produced corn, soybeans, and summer wheat.
Costs are aggregated into the following categories: direct costs, operating costs, and overhead costs. Direct costs include seed, fertilizer, pesticides, drying, crop insurance, and interest on direct costs. Operating costs include labor, contract services, machinery depreciation and interest, and diesel and other energy costs. Overhead costs include building depreciation and interest, land, farm insurance, and farm advising and accounting costs.
The research methodology used in this study is data envelope analysis, which is used to calculate the cost efficiency for each typical farm. Cost efficiency is achieved when a farm operates on the cost frontier (i.e., produces output for the lowest possible cost. Efficient farms have an efficiency index of 1.00. As an efficiency index decreases, inefficiency increases. In addition to generating a cost efficiency index, data envelope analysis generates optimal cost shares. The ratio of actual to optimal input cost shares is analyzed to determine whether resources are being underutilized or overutilized. A utilization ratio below 1 indicates that a farm is underutilizing an input, while a ratio above 1 indicates that the farm is overutilizing an input (Purdy and Langemeier, 2020). Cost-efficient farms have an input utilization ratio of 1.
Results
After analyzing the actual and optimal cost for corn and soybean farms, we found it was more difficult for a farm with soybeans to be cost efficient than it was for a farm with corn in North America. From a regional perspective, the cost efficiency of U.S. farms was superior to that of Canadian farms in terms of both corn and soybean production.
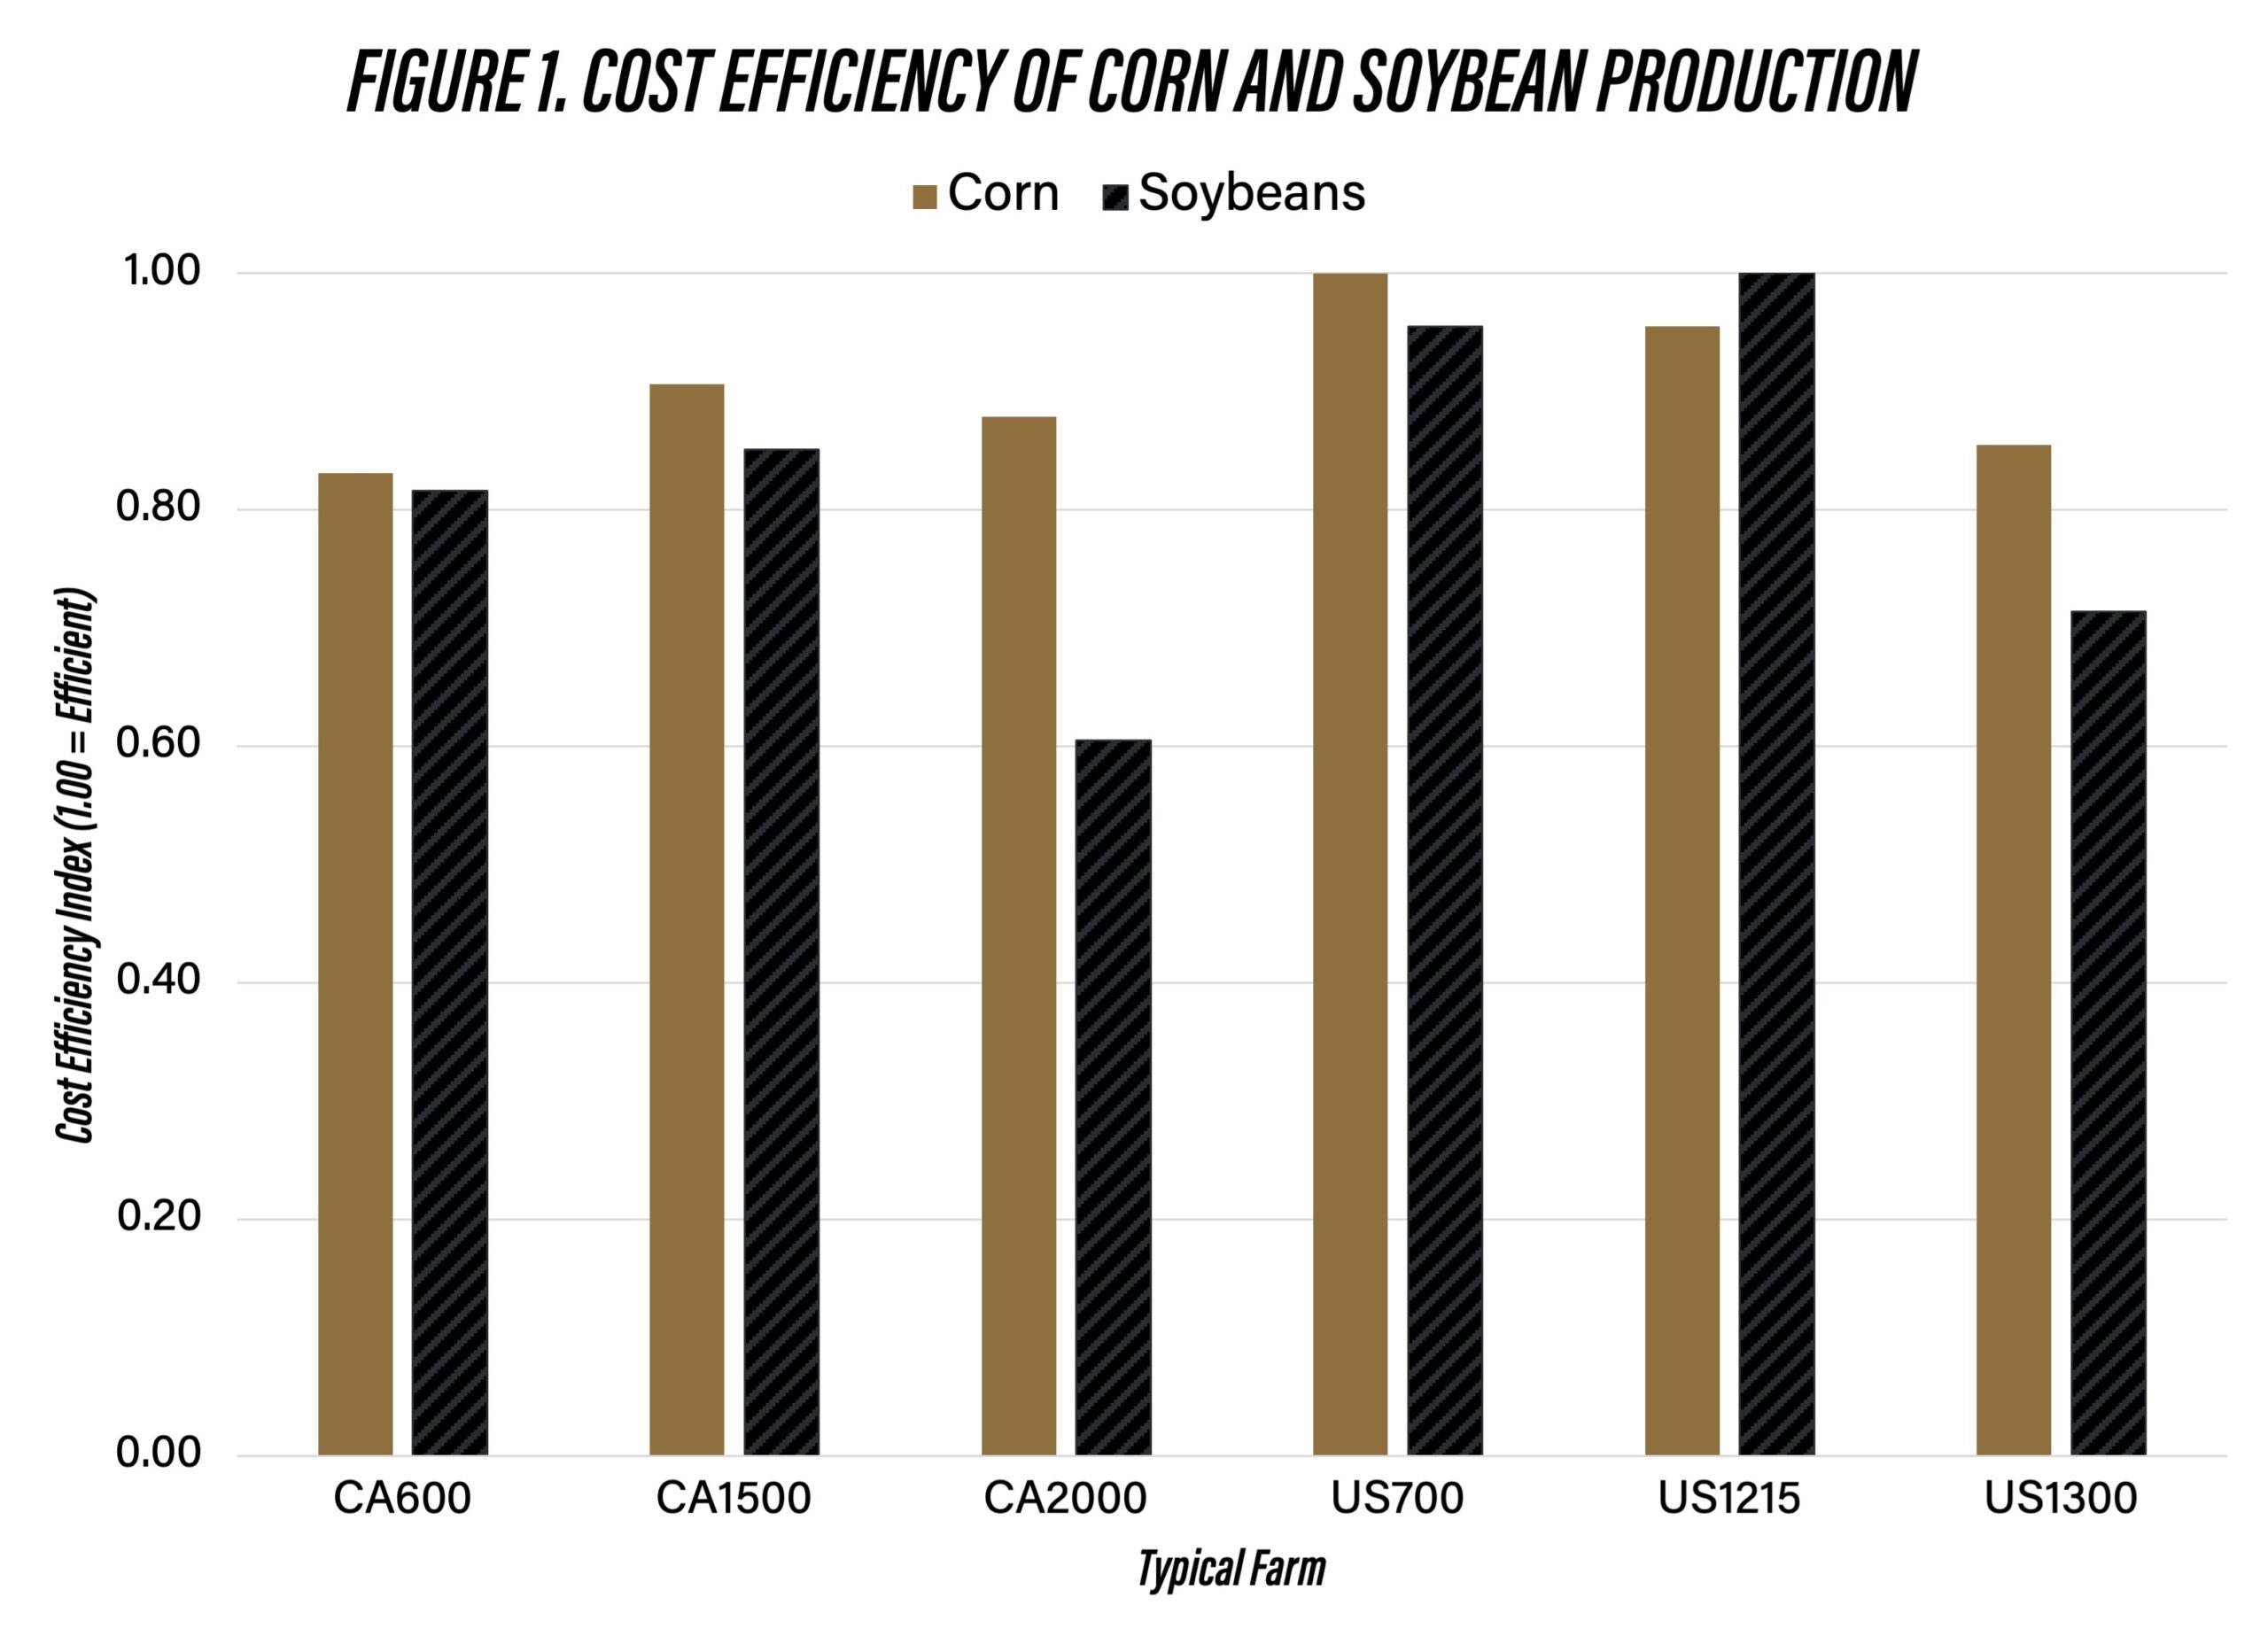
Figure 1. Cost Efficiency of Corn and Soybean Production
The average cost efficiency index for corn was 0.904 (figure 1). Only the US700 farm (i.e., Iowa farm) was cost efficient. However, the other five farms also performed relatively well, with their cost efficiency indices all above 0.830. Inefficient farms tended to under-utilize direct and overhead costs and over-utilize operating costs. The average direct cost and overhead cost utilization ratios were 0.83 and 0.75, respectively. The average operating cost utilization ratio was 1.21. Operating cost included machinery and equipment, so this cost would be worth looking into in future analyses.
For soybeans, the average cost efficiency index was 0.823 (figure 1). Only the US1215 farm (i.e., Indiana farm) was cost efficient. The US700 farm (i.e., Iowa farm) also performed well, with an efficiency index of 0.955. The variability in the cost efficiency indices for the six typical farms was significantly larger for soybeans than for corn. The Canadian farm in the Red River Valley (i.e., CA2000) had an efficiency index of only 0.605. The average direct cost utilization ratio for soybean production was 0.99. However, the Canadian farm, CA2000, had a ratio of only 0.76. The average utilization ratios for operating and overhead costs were 0.87 and 0.67, respectively. The Canadian farm, CA2000, had an operating cost utilization ratio of 0.55 and an overhead cost utilization ratio of 0.46.
Concluding Comments
The objective of this paper is to measure to the cost efficiency of corn and soybean production for six typical farms in North America, three in Canada and three in the United States. The average cost efficiency indices for corn and soybeans were 0.904 and 0.823, respectively. In general, the U.S. farms were more cost efficient than the Canadian farms. With the exception of operating costs for corn production, inefficient farms tended to under-utilize rather than over-utilize inputs.
The inefficient use of inputs found in this study suggests that future research is warranted. In particular, it would be interesting to examine the utilization of inputs such as seed, fertilizer, pesticides, machinery and equipment, and land.
Citations
Abiri, R., N. Rizan, S.K. Balasundram, A.B. Shahbazi, and H. Abdul-Hamid. “Application of Digital Technologies for Ensuring Agricultural Productivity.” Heliyon. 9(12, December 2023):1-21.
Feuz, D. and K. Skold. “Typical Farm Theory in Agricultural Research.” Journal of Sustainable Agriculture. 2(Number 2, 1992):43-58.
Frohberg, K. and M. Hartmann. “Comparing Measures of Competitiveness.” Discussion Paper, Number 2, Institute of Agricultural Development in Central and Eastern Europe, 1997.
Langemeier, M. “International Benchmarks for Corn Production.” Center for Commercial Agriculture, Purdue University, January 8, 2024a.
Langemeier, M. “International Benchmarks for Soybean Production.” Center for Commercial Agriculture, Purdue University, March 1, 2024b.
Lunik, E. International Comparison of Cost Efficiency of Corn and Soybean Production. Unpublished M.S. Thesis, May 2015.
Purdy, R. and M. Langemeier. “Cost Efficiency of International Corn and Soybean Production.” Journal of the Applied Farm Economics. 3(Fall 2020):21-29.
Walters, J.P., D.W. Archer, G.F. Sassenrach, J.R. Hendrickson, J.D. Hanson, J.M. Halloran, P. Vadas, and V.J. Alarcon. “Exploring Agricultural Production Systems and Their Fundamental Components with System Dynamics Modeling.” Ecological Modeling. 333(August 2016):51-65.
Wang, J. and X. Hu. “Research on Corn Production Efficiency and Influencing Factors of Typical Farms.” PLOS ONE. 16(7, 2021):1-17.
![]()
![]()
![]()
![]()
![]()
TAGS:
TEAM LINKS:

RELATED RESOURCES
UPCOMING EVENTS
We are taking a short break, but please plan to join us at one of our future programs that is a little farther in the future.