February 23, 2026
U.S. and Brazil Soybean Competitiveness: Farm-Level Costs and Returns
by Joana Colussi and Michael Langemeier
![]()
![]()
![]()
![]()
![]()
Brazil’s rise as a dominant force in global soybean markets has become a central concern for U.S. producers. In the January 2026 Purdue University Ag Economy Barometer survey, 44% of U.S. farmers indicated they were “very concerned” and 36% reported being “concerned” about the competitiveness of U.S. soybean exports relative to Brazil (Langemeier & Colussi, 2026). Since surpassing the United States as the world’s largest soybean producer in 2018, Brazil has continued to expand its presence in global export markets. This article compares the U.S. and Brazilian soybean sectors using farm-level production cost data from 2020 to 2024. Standardized economic data from the agribenchmark network is used to identify key differences in costs and competitiveness between the two countries.
Methods and Data
Soybean competitiveness is analyzed using data from one typical farm in Iowa, United States, and one in Mato Grosso, Brazil – major agricultural regions in their respective countries. Together, Brazil and the United States produce nearly 70% of the world’s soybeans (USDA-FAS, 2025). The study period, from 2020 to 2024, includes two major market shocks: the COVID-19 pandemic and the Russia–Ukraine war. The average soybean area planted over these years was 5,900 acres on the Brazilian farm and 1,800 acres on the U.S. farm. Costs and revenues are expressed in U.S. dollars to enable direct cross-country comparisons.
The data were sourced from the agribenchmark network, which systematically compiles production and economic information on beef, cash crops, dairy, pigs, poultry, horticulture, and organic products across 35 countries in North America, South America, Europe, Asia, and Oceania. The agribenchmark concept of typical farms was developed to facilitate the analysis and comparison of prevailing farm production systems worldwide. Participants follow standardized procedures to construct typical farms that reflect national production shares and are classified by production systems, enterprise combinations, and structural characteristics (Langemeier, 2024).
Soybean Input Cost Shares
Differences in technology adoption, input prices, soil fertility, trade policy restrictions, exchange rate effects, and labor and capital market conditions lead to variation in input use across soybean farms in the United States and Brazil. Figure 1 presents the input cost shares for each farm, categorized into three major groups: direct costs, operating costs, and overhead costs. Direct costs include seeds, plant protection, fertilizers, irrigation, crop insurance, drying costs, and finance costs. Operation costs comprise machinery costs, labor costs (both hired labor and family labor), contractor costs, fuel, and other energy expenses. Overhead costs consist of land, building depreciation, repairs and interest, property taxes, insurance, and miscellaneous expenses.
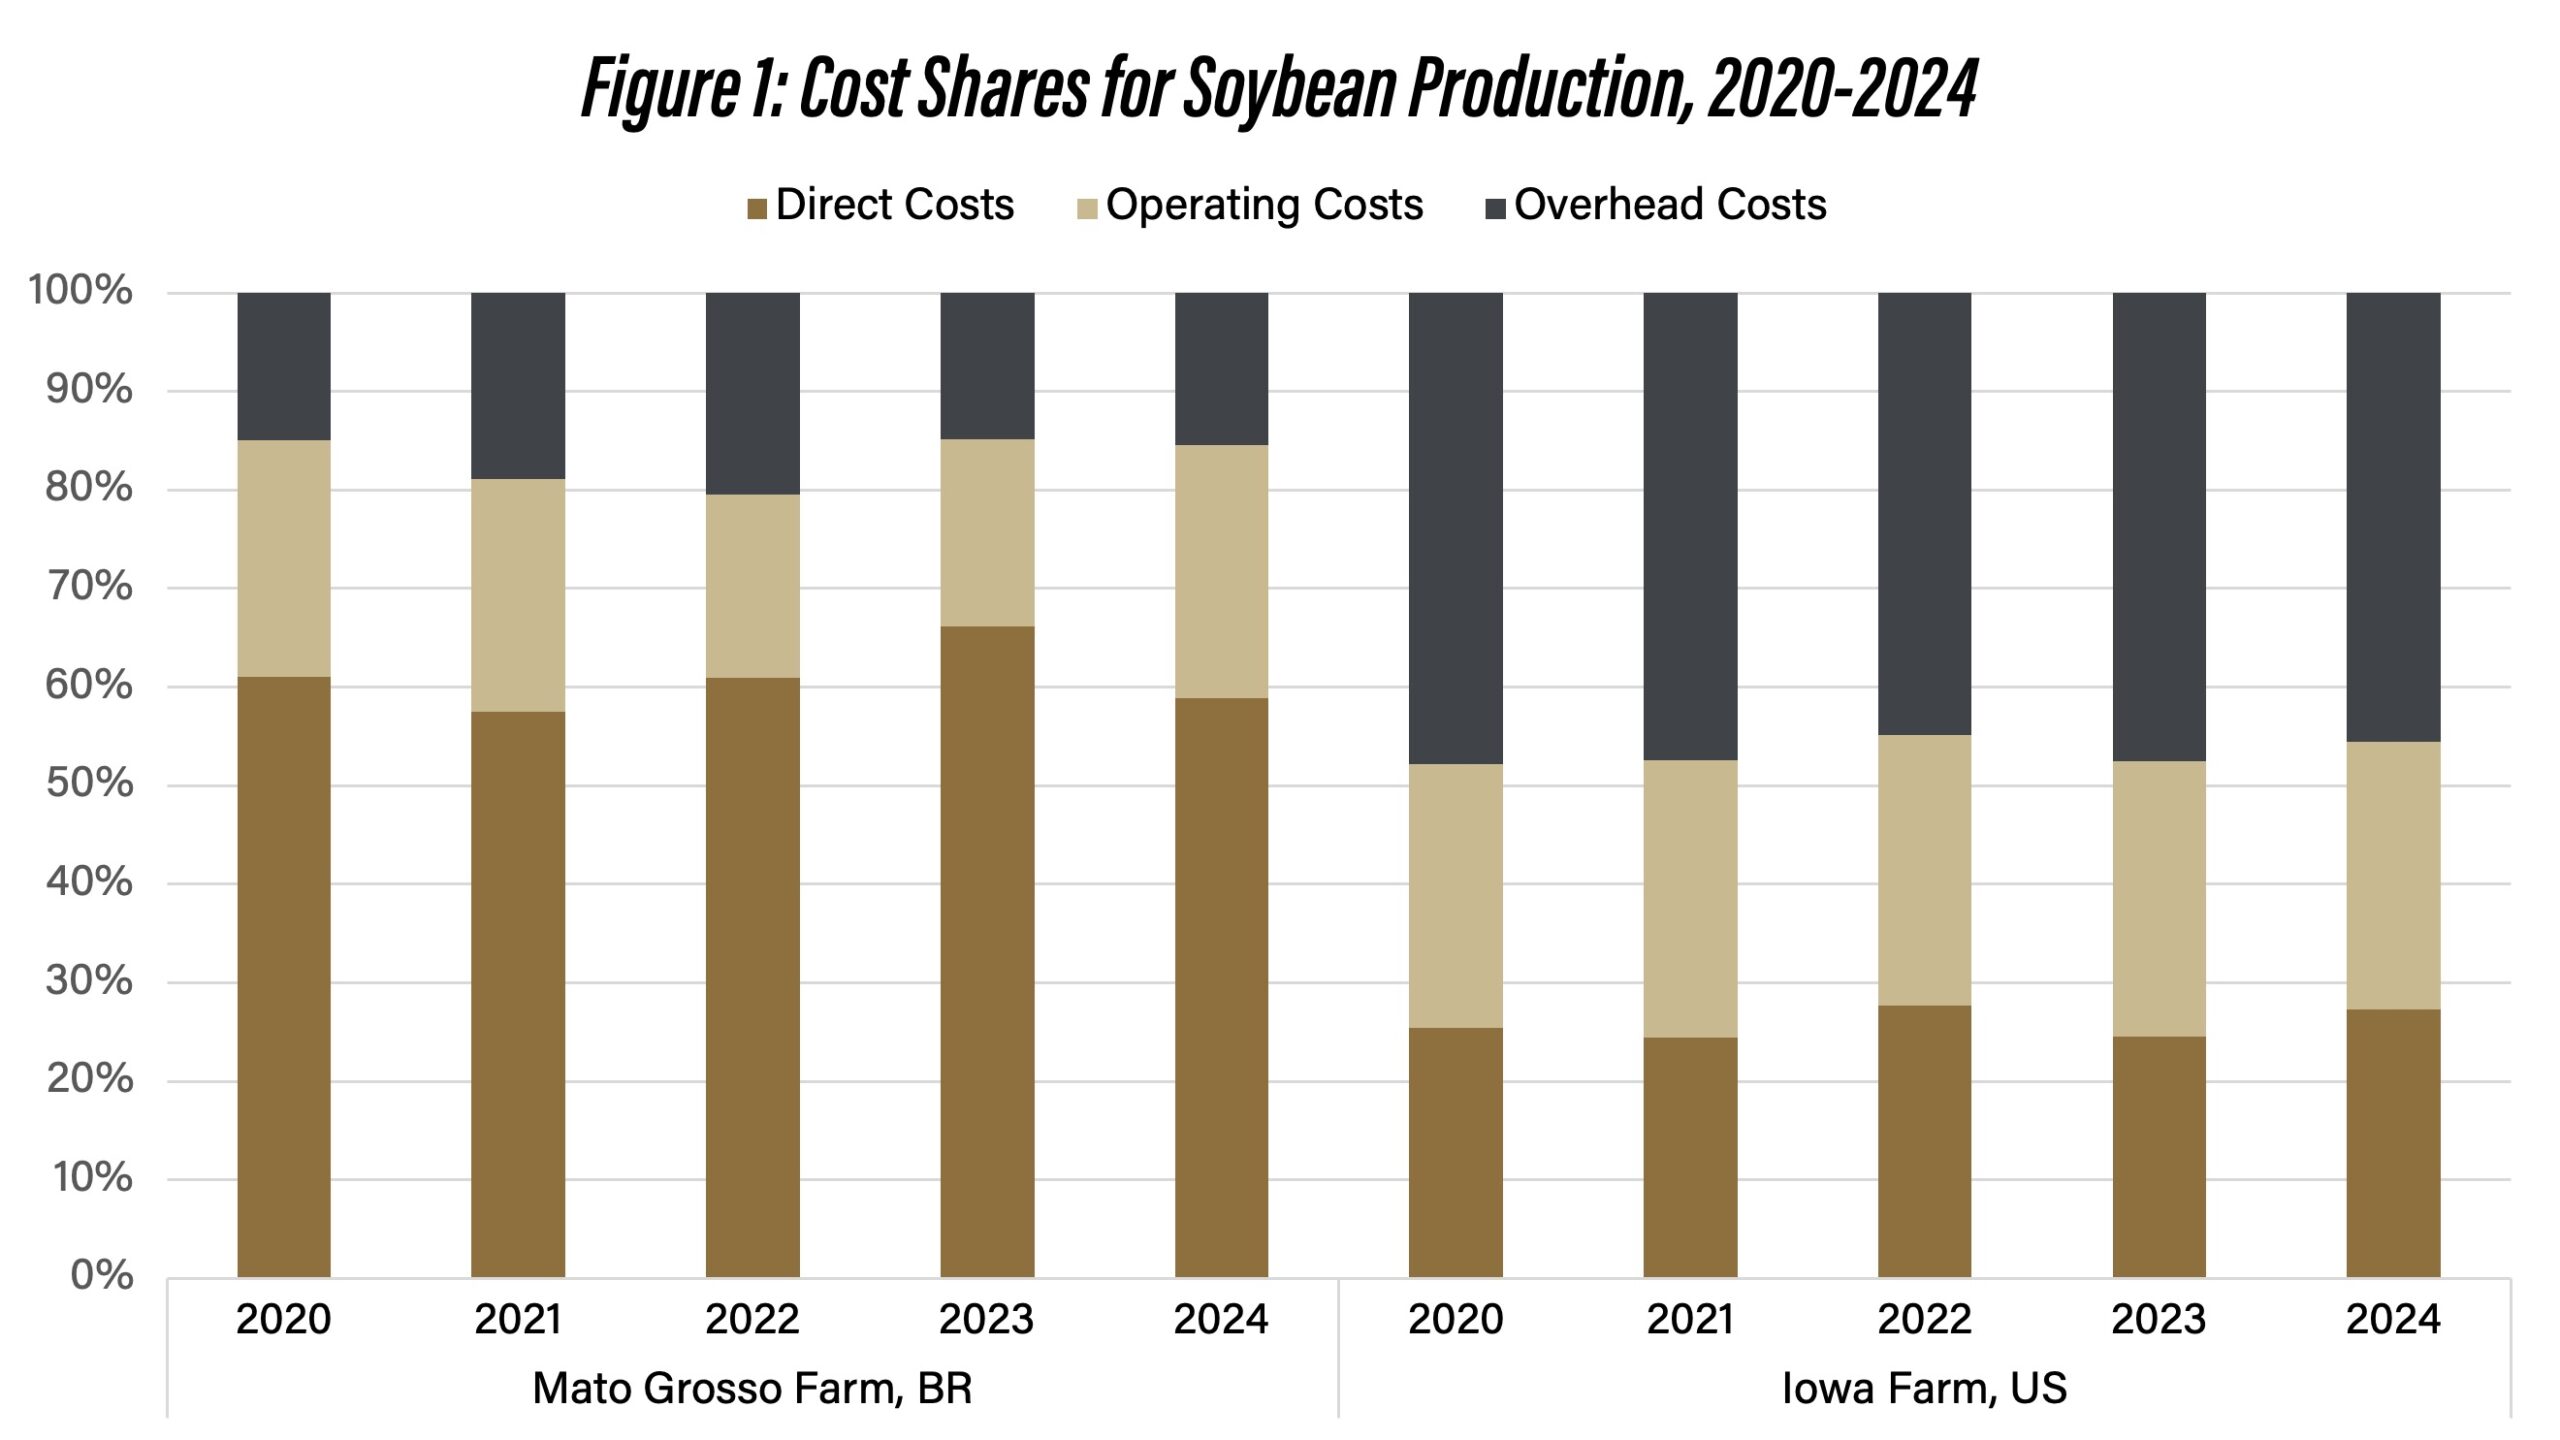
Figure 1. Cost Shares for Soybean Production, 2020-2024
Source: Computed by the authors using the Agri Benchmark Network database
In Brazil, direct costs consistently accounted for the largest share, exceeding 60% of total costs on average during the 2020-24 period. These numbers reflect the country’s high expenditure on inputs, such as fertilizers and crop protection. In Brazil, where tropical agriculture predominates and much of soybean production is concentrated in the Cerrado region (Brazilian savanna), the need for chemical pest control and fertilizers to correct soil deficiencies gives these inputs a particularly large share of total production costs.
By contrast, overhead costs represent the largest cost component on the U.S. farm, accounting for nearly one-half of total costs during the 2020-24 period. This large share primarily results from higher land costs, which experienced substantial appreciation over the last few years (Purdue University, 2025). The main drivers of this appreciation include profitable corn–soybean production, a limited supply of cropland, and strong investor demand capitalizing on rising land values. Meanwhile, overhead costs accounted for approximately 25% of total costs in the Brazilian farm, reflecting lower land ownership costs.
Soybean Production Costs, Gross Revenues, and Economic Profits
Figure 2 presents production costs and gross revenues for soybeans on typical farms in Iowa and Mato Grosso. Overall, total costs were consistently higher on the U.S. farm than on the Brazilian farm during the 2020–24 period, even with the substantial cost increases recorded in Brazil beginning in 2022. From 2020 to 2024, total production costs on the Brazilian farm nearly doubled, rising from $172 per ton to $337 per ton (see Figure 2). The sharp increase was largely attributable to rising direct costs, as higher international prices for imported inputs, especially fertilizers, substantially increased production expenses.
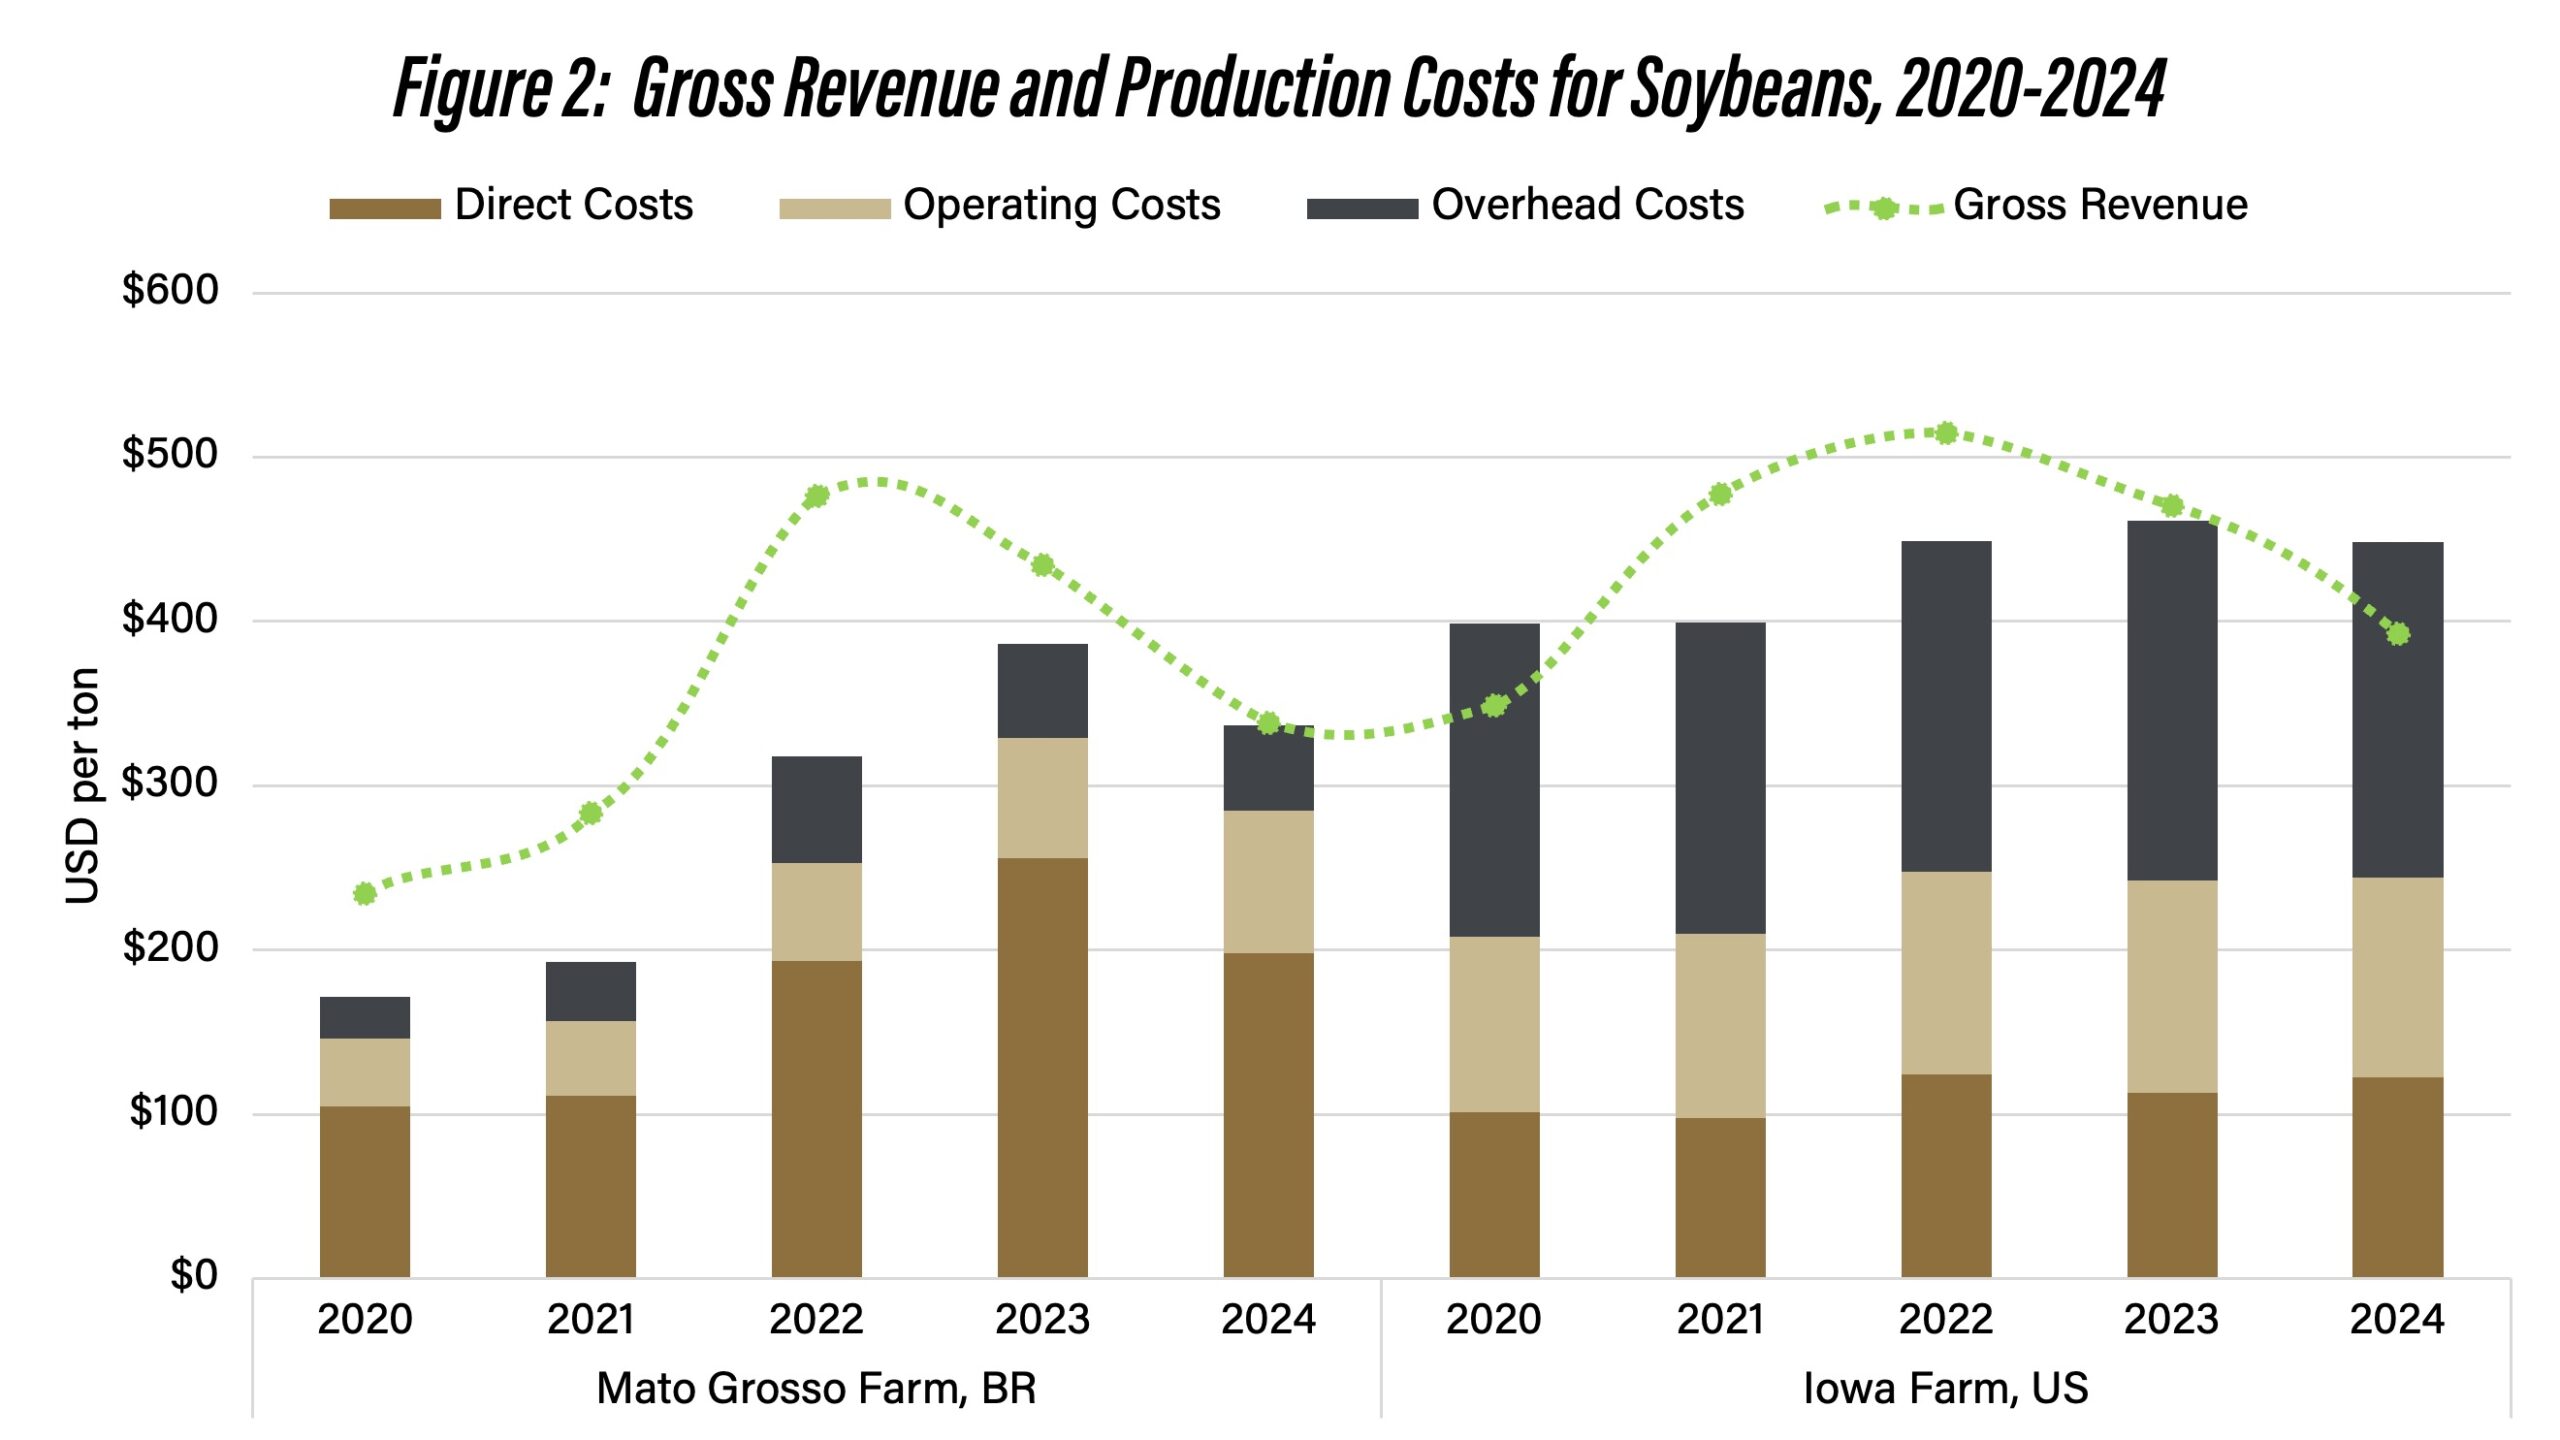
Figure 2. Gross Revenue and Production Costs for Soybeans, 2020-2024
Source: Computed by the authors using the Agri Benchmark Network database
Higher fertilizer prices and supply shortages from late 2021 through the second quarter of 2022, primarily due to the Russia–Ukraine conflict, resulted in record fertilizer expenditures per acre in many countries. The impact of fertilizer prices was particularly severe in places like Brazil, which typically imports nearly 85% of its fertilizer needs. Because these inputs are priced in U.S. dollars, the depreciation of the Brazilian real against the dollar further amplified domestic costs in that period.
Soybean production costs also increased on the American side, but at a slower pace than in Brazil. From 2020 to 2024, total production costs on the U.S. farm rose by 13%, from $399 per ton to $448 per ton (see Figure 2). In addition to farmland value appreciation, operating costs on the typical U.S. farm increased by 14% during the period. Since 2021, all major components of operating costs in the United States – hired labor, family labor, contractors, machinery, and diesel – have risen substantially due to supply chain disruptions following the pandemic and inflationary pressures (USDA-ERS, 2024).
Despite rising production costs, soybean gross revenue generally outpaced or kept pace with costs after 2020 on the Brazilian typical farm analyzed, supported by higher soybean prices. The same did not occur on the U.S. farm. Based on the difference between revenues and total production costs (direct, operating, and overhead), Figure 3 presents economic profits for soybean production on representative farms in Mato Grosso and Iowa from 2020 to 2024.
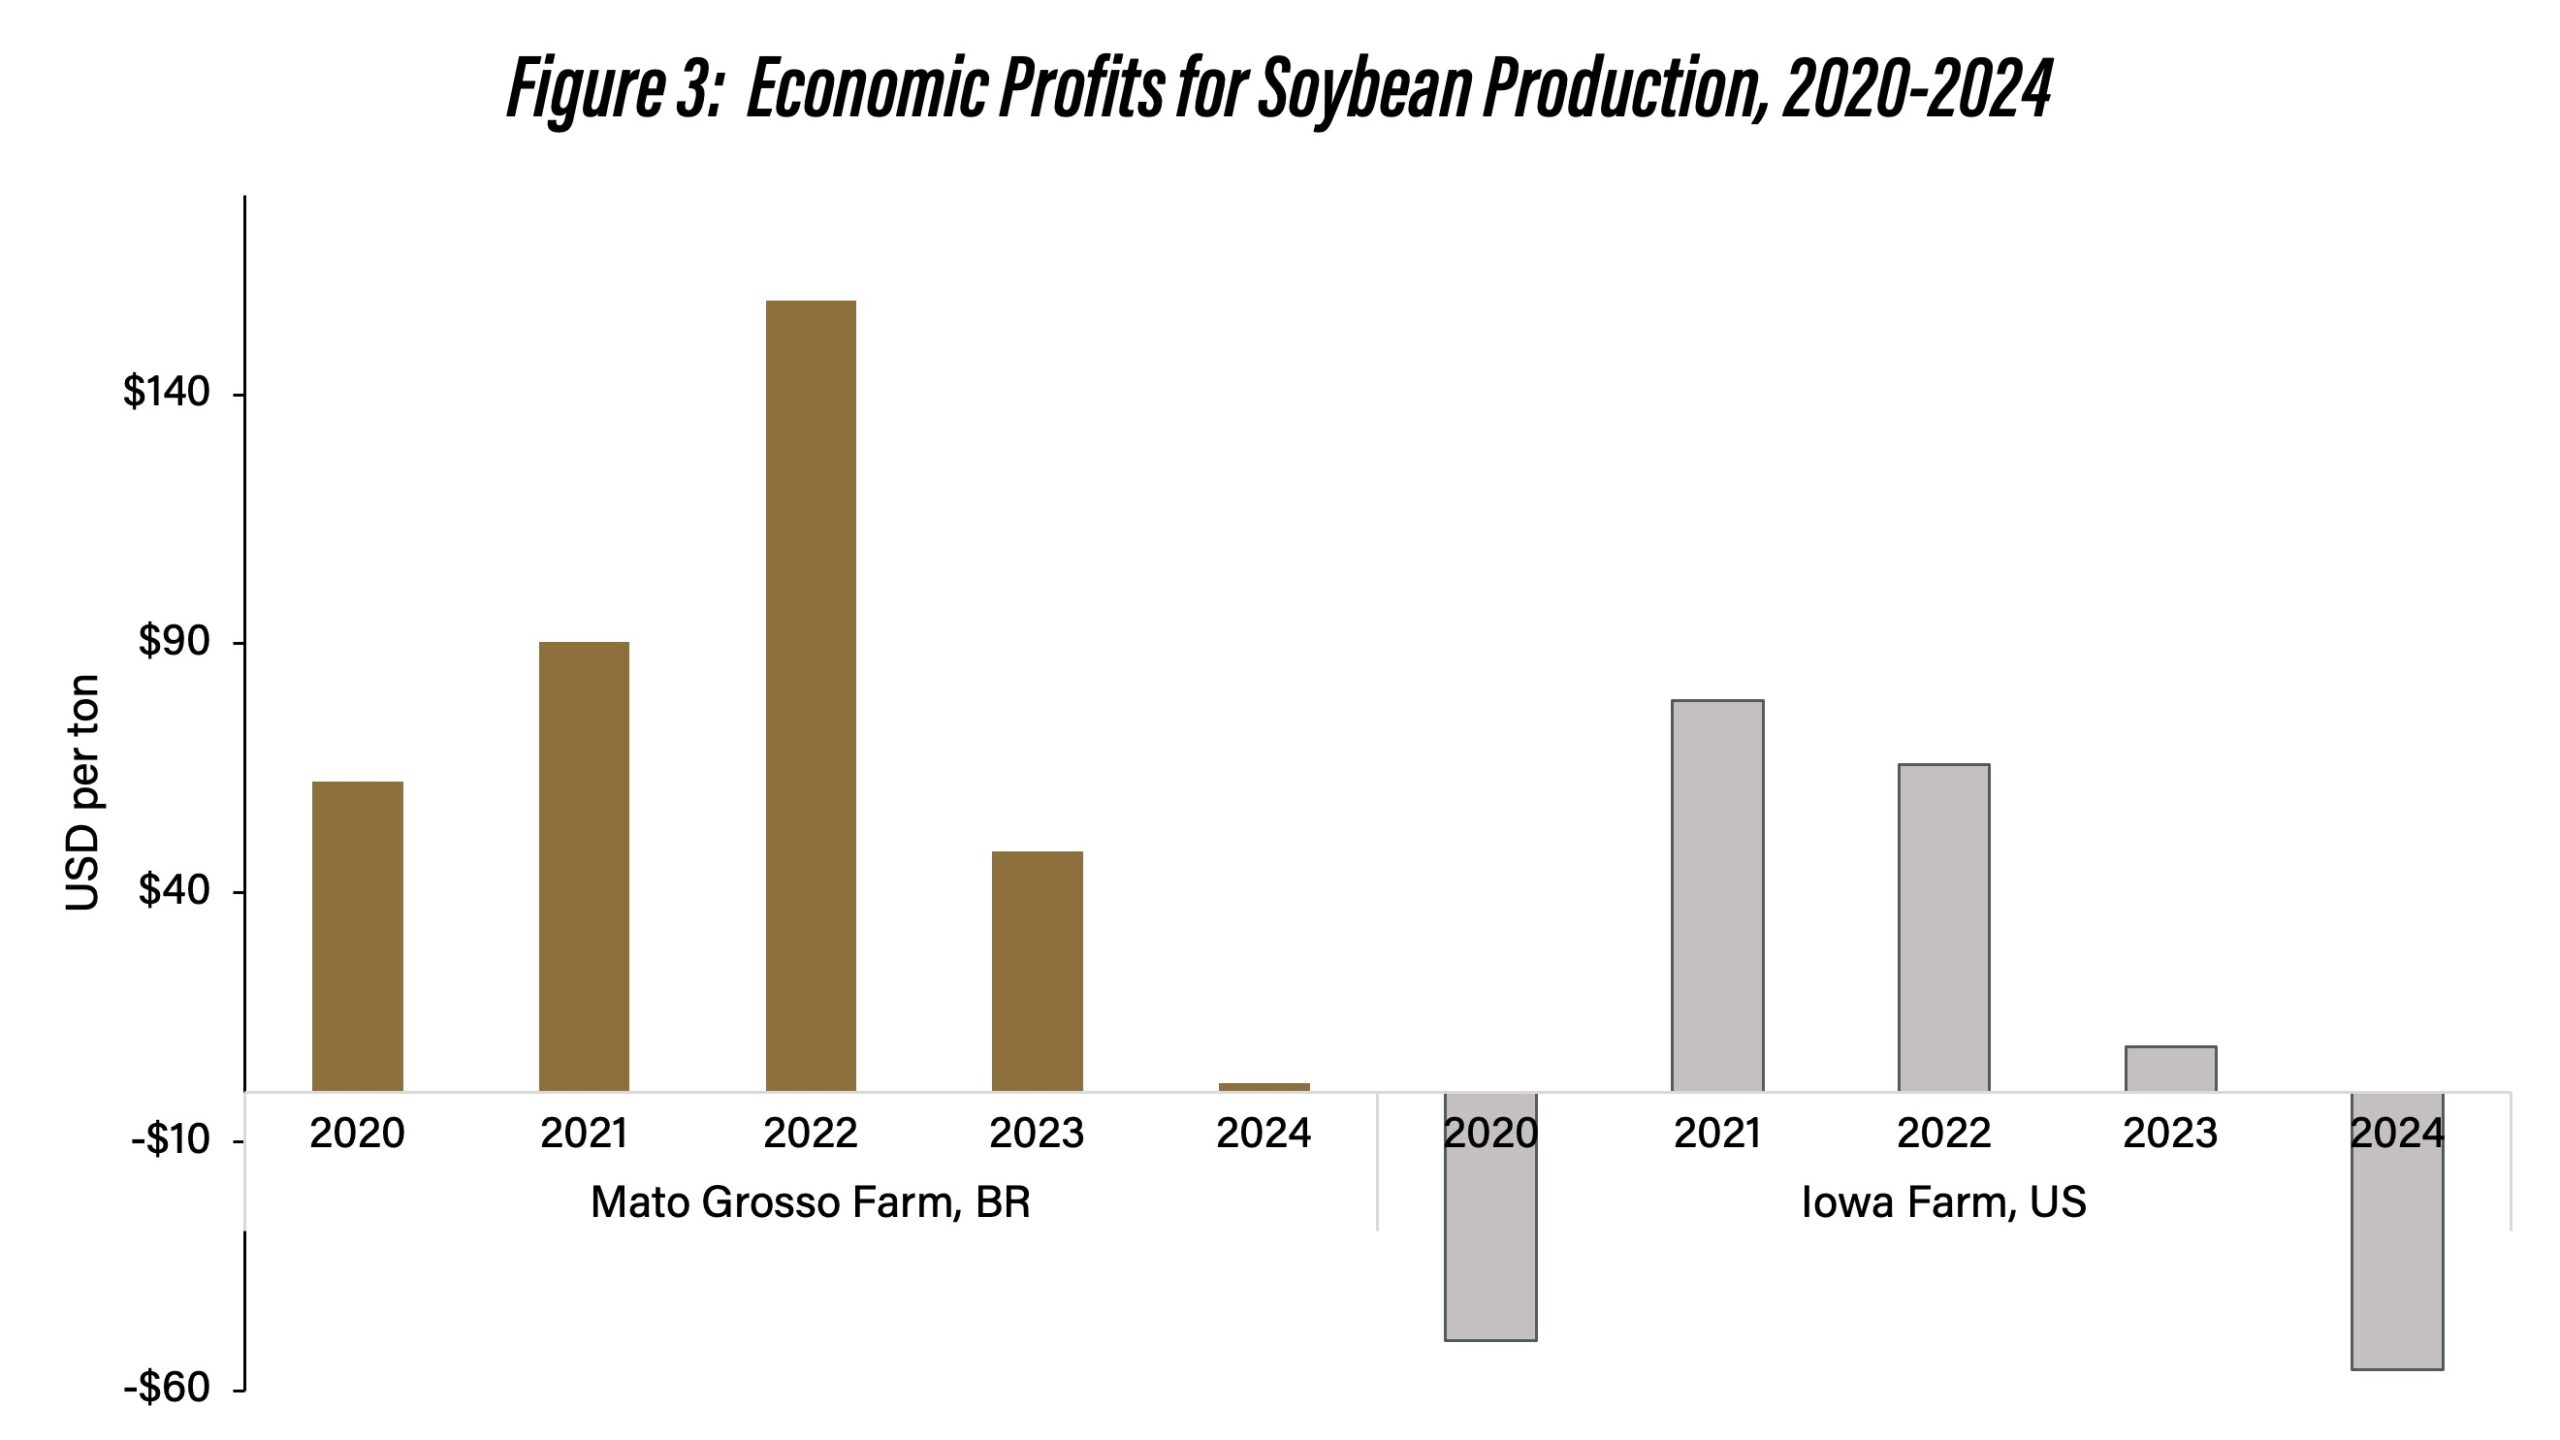
Figure 3. Economic Profits for Soybean Production, 2020-2024
Source: Computed by the authors using the Agri Benchmark Network database
Profitability remained consistently positive in Brazil, although it weakened after 2022, when soybean prices began to stabilize following the sharp price surge. In addition to exchange rate effects, Brazilian producers benefited from strong international demand, particularly from China. From 2020 to 2024, Brazilian exports to China averaged 71% of total soybean exports (Colussi et al., 2024).
By contrast, the U.S. farm showed greater volatility, including losses in 2020 and 2024, indicating increased sensitivity to cost increases and commodity price fluctuations. The financial stress faced by American farmers has intensified since 2023, reflecting higher input costs, tighter margins, and greater reliance on operating debt carried over from prior years (Langemeier and Colussi, 2026).
Final Considerations
This article compares the economics of soybean production in two major producing regions in the United States and Brazil over the 2020–2024 period. The results show some structural differences in soybean production systems in the American and Brazilian farms. While Brazil’s cost structure is heavily influenced by input-intensive tropical agriculture and dependence on imported fertilizers, the United States faces higher overhead costs driven primarily by elevated land values.
Although Brazil had significant cost increases between 2021 and 2022, strong soybean prices, local currency depreciation, and robust export demand helped sustain profitability during that period. Meanwhile, U.S. soybean production generated strong margins in 2021 and 2022 but faced tighter or negative margins in other years, reflecting rising operating costs, high fixed land expenses, and sensitivity to market price fluctuations.
Looking ahead, Brazil’s expansion into lower-cost frontier regions and continued infrastructure improvements may reinforce its cost advantage. Meanwhile, maintaining U.S. competitiveness will depend on productivity gains, cost management, and risk management strategies in an environment of input price uncertainty and strong global competition.
References
Agri benchmark. http://www.agribenchmark.org/home.html. Accessed on February 15, 2026.
Colussi, J. and M. Langemeier. “U.S. Soybean Harvest Starts with No Sign of Chinese Buying as Brazil Sets Export Record.” Center for Commercial Agriculture, Purdue University, September 22, 2025.
Langemeier, M. and Colussi, J. Farmer sentiment drops sharply at the start of 2026 as economic concerns increase. Center for Commercial Agriculture, Purdue University, February 3, 2026.
Langemeier, M. and Colussi, J. Rising farm debt and financial stress: Evidence from the Ag Economy Barometer. Center for Commercial Agriculture, Purdue University, February 4, 2026.
Langemeier, M. “International Benchmarks for Soybean Production.” Center for Commercial Agriculture, Purdue University, March 6, 2024.
Purdue University PAER 2025-08: Purdue Farmland Values and Cash Rents Survey results, Purdue Agricultural Economics Report, August 2025.
USDA Economic Research Service (2024). Farm income and wealth statistics: commodity costs and returns, United States Department of Agriculture, Washington, DC. Available at: https://www.ers.usda.gov/data-products/commodity-costs-and-returns/
USDA Foreign Agricultural Service (2025). Soybeans: Production Data.
![]()
![]()
![]()
![]()
![]()
TAGS:
TEAM LINKS:


RELATED RESOURCES
UPCOMING EVENTS
We are taking a short break, but please plan to join us at one of our future programs that is a little farther in the future.