July 18, 2012
When Do Farm Booms Become Bubbles? (Remarks)
![]()
![]()
![]()
![]()
![]()
Well thanks, Jason. It is really a privilege to be here today and I want to thank Jason,and the Kansas City Fed in general, for being real leaders on this issue and doing a tremendous amount of good, sound economic research on what is happening in the agricultural economy today. I have been a little bit surprised frankly by the amount of stuff that is not coming out of other agricultural economics departments around the country. The Kansas City Fed has clearly been a leader in addressing some of these issues.
I want to talk today very briefly or concisely about “when do farm booms become bubbles?” We’ll start by reinforcing the idea we just heard that agriculture’s history has some remarkable periods of booms and busts in it. Part of that can be explained by the heavy capital intensity of the agricultural economy.
What happens is, when profitability increases, it tends to make capital assets purchased on the expectation of much lower levels of profitability look really cheap. So you have a lot of fixed assets bought with some kind of price expectation that is low. Then the world changes and those profitability expectations go up here. Those capital assets that you purchased in that previous regime look very, very attractive, and there is tremendous pressure on them to increase in price. What happens in many cases is that we overreact on the upside to those things or that demand then fades away. Jason –and I guess I was a coauthor on that –has written a nice article on booms and busts and some of the things that have triggered those over time.
But our key questions today are, Will these times really last or are we headed for a retreat to previous levels? And secondly, are farmland values in a speculative bubble or responding normally to the wonderful economic conditions that are available in the crop sectors today?
As we try to answer that question, it is important to think first about why things have changed. As an economist, we get drilled with the idea supply and demand can explain a lot of things. In this situation, it can explain some things too. You have two kinds of shocks: demand shocks and supply shocks.
Demand calls for more output on all price levels. For example, biofuel demand and growth in the emerging markets have pushed our demand curve out. This kind of persistent demand growth can substantially increase farmland values in capital investment in agriculture.
Supply induced, on the other hand, is typically the kind of supply contraction we are having today, which is weather-related. Those tend to be very short term in nature. In most cases, capital assets don’t react to supply shocks, because we know what? Weather will return to normal times in due course. Typically, we don’t see capital assets being repriced dramatically as a result of a short-term supply shock.
The second kind of supply shortage is one where our normal kind of rate of productivity growth cannot keep up with the normal demand growth. If that were the case, then that would put a lot of pressure on capital assets to go up. What I think we have to ask ourselves is, What kind of a supply situation do we have? Is supply able to keep up with demand growth –was the weather normal? Second, how persistent is this demand growth going to be?
Our current situation is complicated, because now we are mixing all of these things together. We have demand changing. We have supply shrinking, not just this year but the previous year we had subpar crops. A couple years ago we had subpar crops. You have all these things interacting with each other, then you throw on top of that interest rates at their lowest levels in at least my lifetime, and you have a mix that is ripe for asset prices to take off.
What I want you to think about is how big these recent price increases are in farmland. This is just an example from Iowa, Illinois, and Indiana (Table 1). In the first column, you see the nominal growth rate. These are two periods –handpicked –1971-81 versus 2001-11. You can see when you look in nominal terms –let’s just focus on the Iowa situation –the gains today are nowhere near as big as we saw in the 1970s. Those were remarkable times. Farmland appreciated by 400 percent in Iowa. Today, that’s only been about 248 percent.
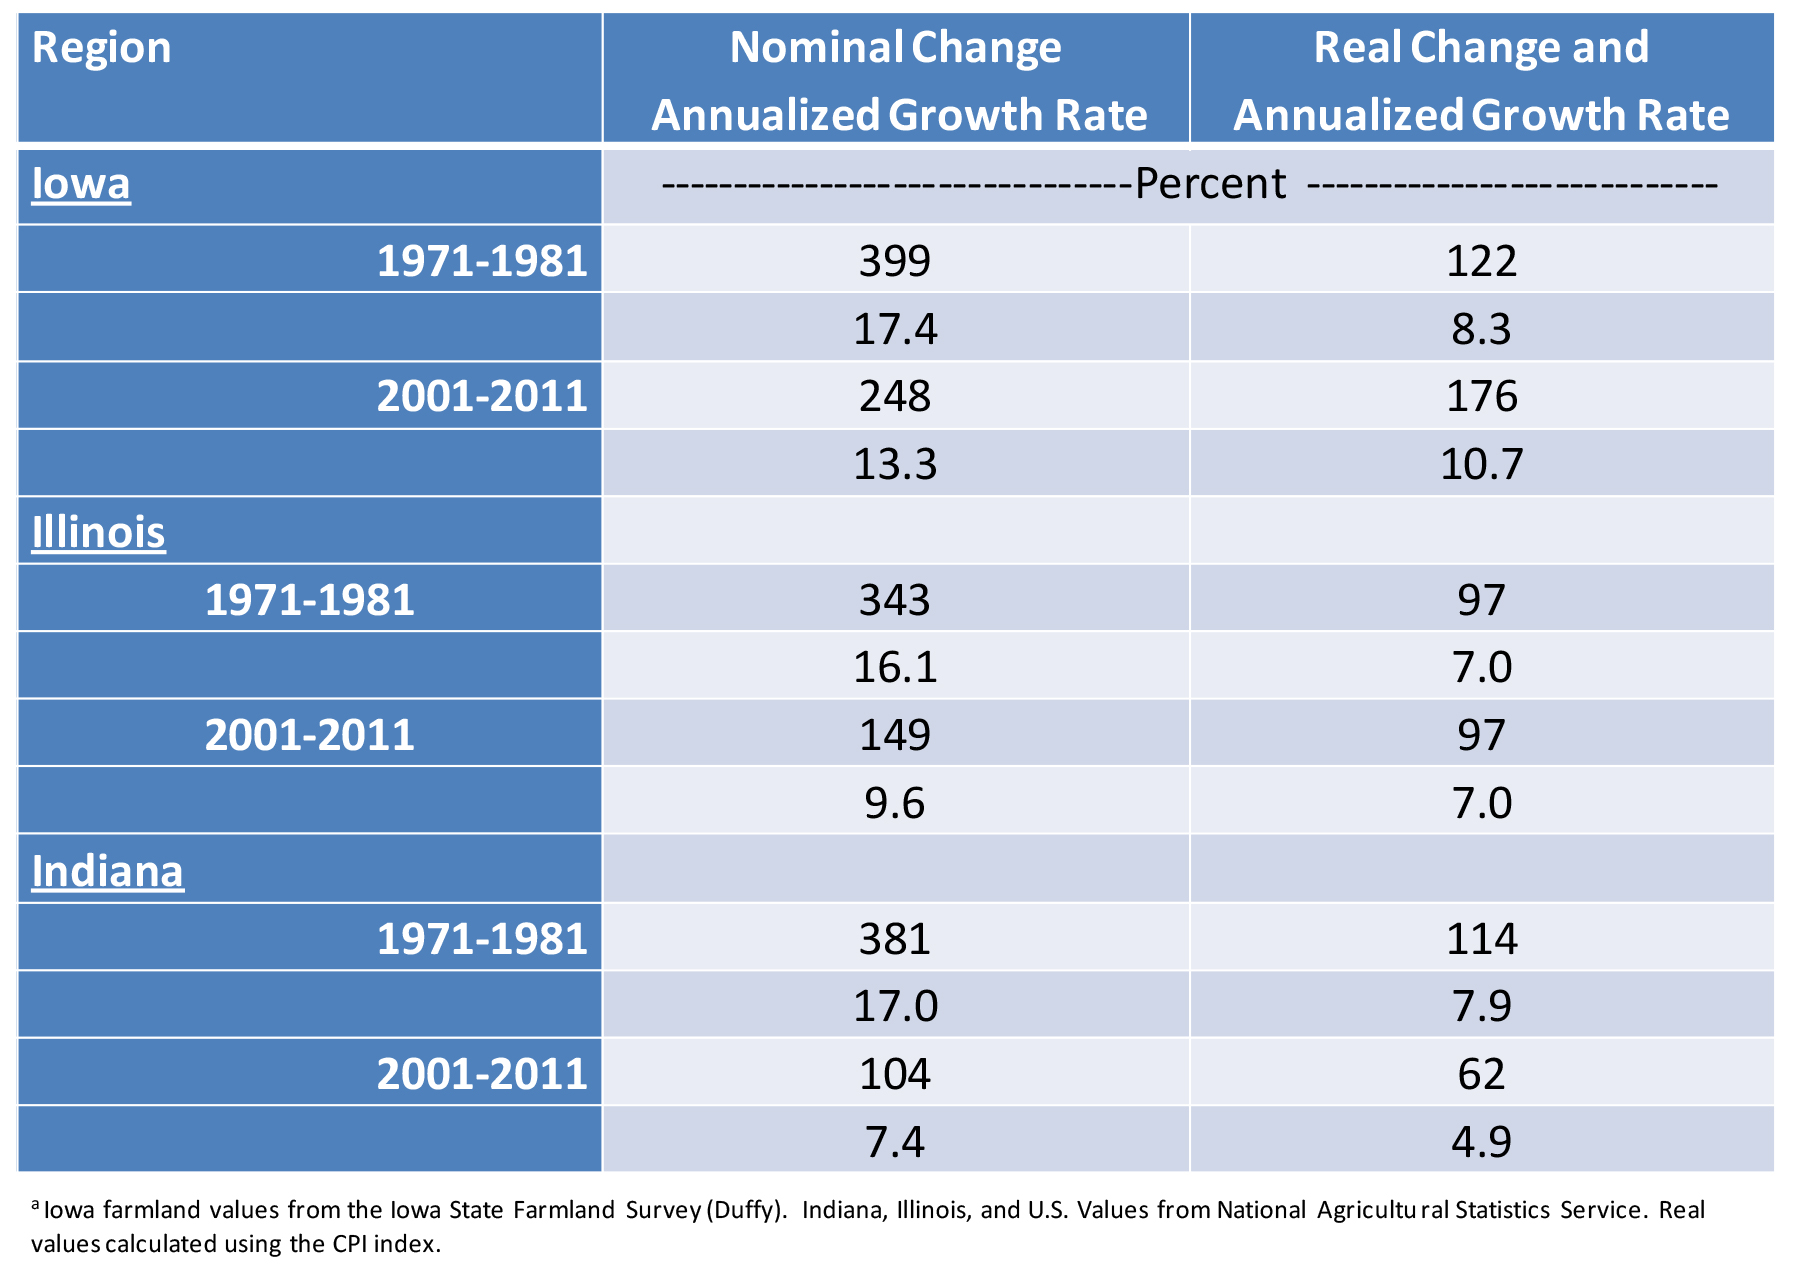
Table 1: Farmland Values
But the column I want you to focus on is the right column, where I showed the real changes, which have been adjusted for price changes. What we have to remember is the 1970s had a tremendous amount of inflation in them. When looking at the real price increases experienced today versus the 1970s, you can see that in Iowa we’ve even done better. In real terms, Iowa farmland has increased at a real annual growth rate of 10 percent in the last ten years. That, folks, is dramatic price increases –that’s real price increases, better than it did in the boom period of the 1970s!
In Illinois, the period is eerily symmetric, almost exactly the same in real terms as what happened in Illinois in the 1970s. In Indiana, we’re a little bit behind the period in the 1970s. These numbers should give us all a little bit of pause to think about what we know that absolute price increases on a percentage basis are not as big as they were in the 1970s, but in real terms they are really unprecedented.
That leaves us a question: When is it a bubble? If you ask economists, there is not a lot we normally agree on. One thing most economists can agree on somewhat is the definition of a bubble. And there are two definitions. “Substantial and long-lasting divergence of asset prices from what would be determined from a rational expectation of the present value of cash flows.” That is from Burton Malkiel, who many of you would recognize as having written a famous book called A Random Walk Down Wall Street.
Joseph Stiglitz wrote, “If the reason a price is high today, it is only because investors believe the assigned price will be higher tomorrow. When fundamental factors don’t seem to justify a price, then a bubble exists.”
These both are definitions that someone practicing rational expectations would put together for a bubble. In other words, asset prices should reflect people’s expectations of the future in some sort of rational way. Malkiel even pokes fun of himself by saying that he and a student were walking down the street and saw a $20 bill lying on the sidewalk. He stepped over it and the student said, “Don’t you want to pick that up?”
He replied, “If it were real, it wouldn’t be there.”
Taken to extreme, this kind of rational expectations theory is a little bit extreme. If you believe this, then one investor says we buy assets based on expectations of fundamentals –the value of future earnings. That makes sense. In the long run, the evidence is overwhelming in support of this. In almost every study that has been done, true speculative bubbles are very hard to find, even ex post.
People have done studies that have said you can describe almost every bubble that’s ever existed by some view of rational expectations. Really, economists don’t have much to say other than “Yeah, based on this definition, bubbles don’t happen.” They are very, very rare. That doesn’t provide me, even as an economist, very much comfort, because basically what we are saying is, “Well, bubbles can’t exist, prices can go up by 100 percent and fall by 50 percent, and that can happen, but it is not a bubble.” It may not be fun, but it’s not a bubble.
What we want to do is say, “Most people aren’t necessarily economists, we don’t think like computers, and most people associate bubbles with large price increases and decreases over a short period of time.”
Think tech stocks. In the study of these things, what people have found is they are usually started by shifts that greatly increase expectations of future profits. Once this happens, it puts in place the entire thing about investor psychology. Then investor psychology can take over and we know that can be prone to things like feedback loops. In other words, prices go up because prices are going up, somewhat like what happened in the housing market. People lose track of the fundamentals that started things off and focus simply on prices.
Warren Buffett sums that up very well in his interview with the Financial Crisis Inquiry Commission, which interviewed a whole bunch of people after the debacle in the housing and mortgage markets. He said, “You get a bubble when a very high percentage of the population buys into an originally sound premise. The premise becomes distorted as time passes and people forget the original premise and start focusing solely on price action.”
How does this apply to agriculture? We’ve had the original sound premise. Demand has shifted. Biofuels is a dramatic new demand source in agriculture. We put 5 billion bushels of corn into ethanol today that didn’t go in there before. That is big, folks. We ship about 20 million acres’ worth of soybeans to China. That is a big new demand, up from about zero ten years ago.
The increased demand is real. It has put into place this situation. Now our real question then is, Are market participants focused on the fundamentals yet or have they lost track of those fundamentals and simply focused on the price action? That is what we want to look for.
Let’s make sure we understand the fundamentals. I want to cover four of them. One, the price people are willing to pay for future earnings. Two, the relationship between returns and values. Three, we will focus at the farmer level and, four, I’ll show you some interactions between farm-level returns and interest rates.
The first chart shows the value-to-cash rent multiple for three Corn Belt states –Illinois in red, Iowa in green, and Indiana in orange [Chart 1]. It doesn’t really matter much, they are all about the same, and they all track very closely. You can see that this today tells us investors are willing to pay about 30 times current cash rents for farmland values. That’s the highest on record. Probably even if you went back to the 1920s or even 1910s, I’d be willing to bet this is the highest on record. this value-to-rent multiple is very, very high. That reflects two things: People either think incomes are going to go up a whole bunch or they think interest rates are going to stay very, very low or both. In order to get multiples in that neighborhood and sustain them, you have to have either growing income –in other words, the multiple over time will fall, because income has gone up –or that interest rates stay very low.
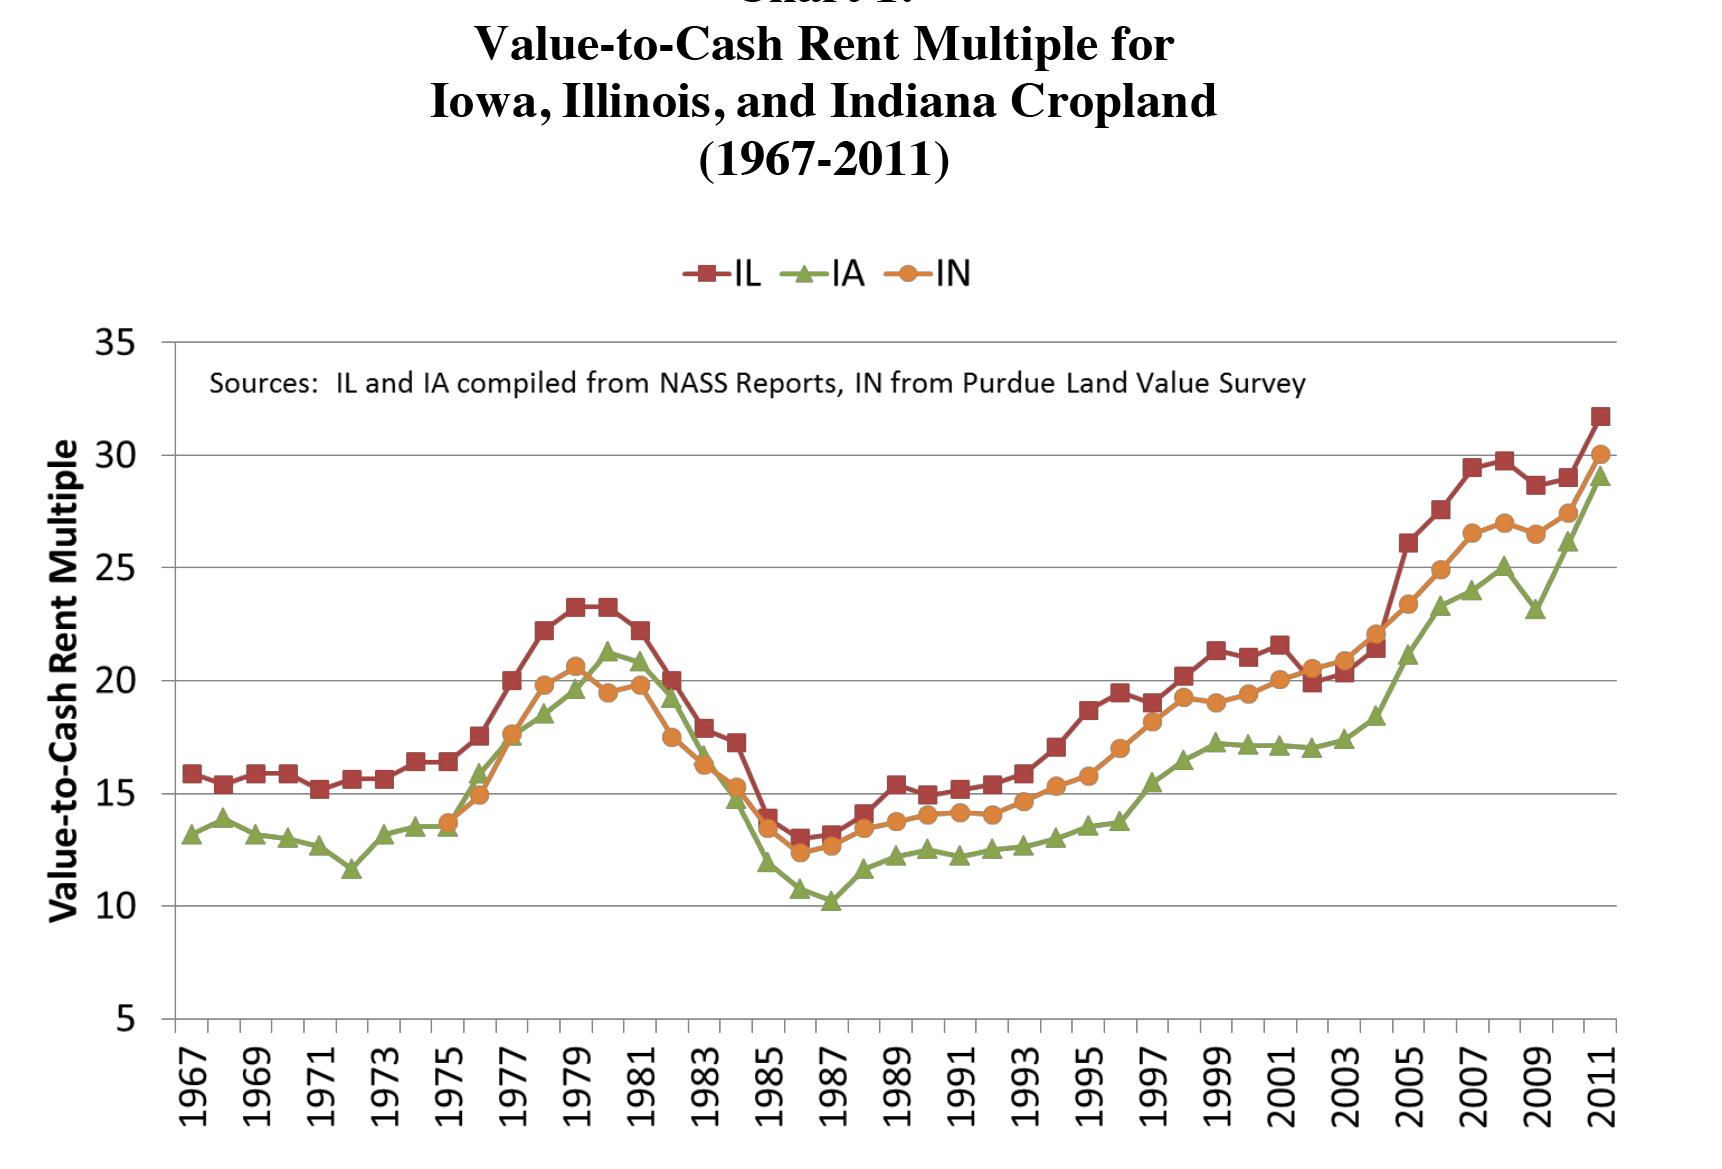
Chart 1: Value-to-Cash Rent Multiple for Iowa, Illinois, and Indiana Cropland (1967-2011)
The second chart shows the relationship between interest rates and farmland values, or capitalization rates [Chart 2]. This chart is taking the inverse of the multiple. So you divide 1 by 30 and you get the capitalization rate. The thing to note here is we have the same three states on that chart. The only thing different is I put the 10-year Treasury bond in there in blue. If the middle of that chart were blocked out, you would notice a dramatic similarity, wouldn’t you? Prices and capitalization rates tend to track that 10-year interest rate pretty darn well. And 10-year rates have fallen dramatically over the last 20 years, down to now –even if we were to do it today –under 2 percent. That cap rate has pulled down.
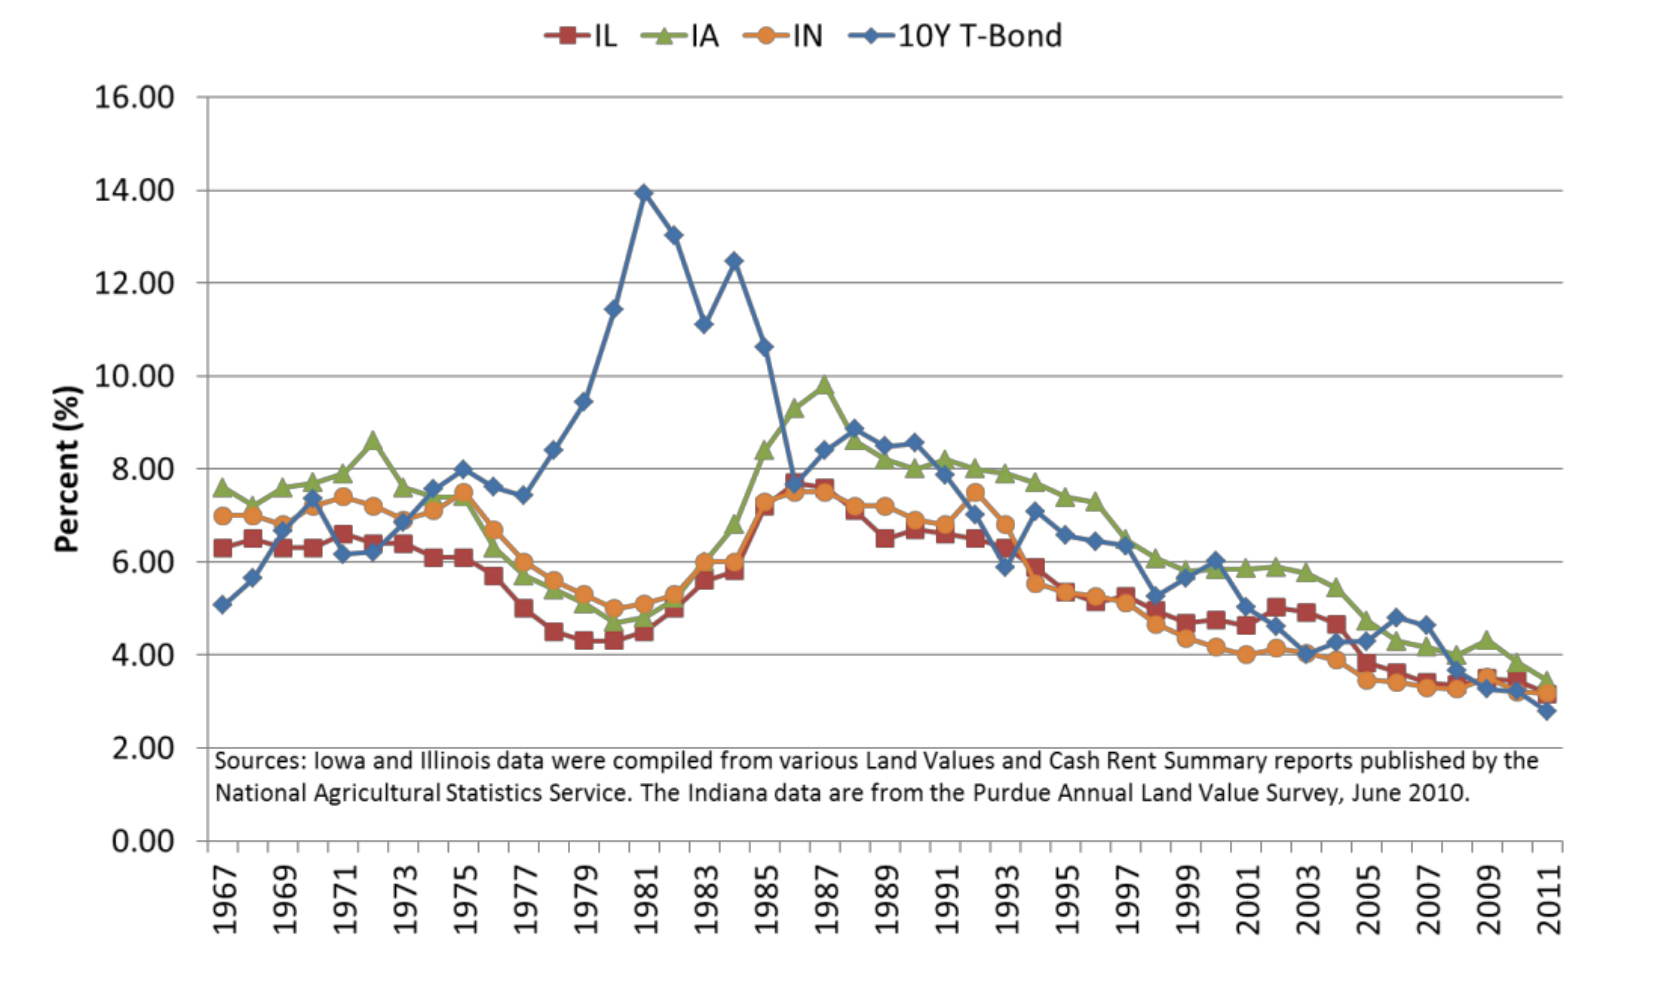
Chart 2: Farmland Capitalization Rates and Interest Rates on 10 Year U.S. Treasury Bonds(1967-2011)
There is one period where they didn’t. When was that? A period that was not very much fun for us, right? One of the things you would ask is why did that happen. Why did the cap rate fall during that period? One of the things that was happening was asset prices were increasing faster and interest rates took off upward. It took awhile for capitalization rates to increase or multiples to fall to catch back up to the interest rates. So something to be on the lookout for is that role of the interest rate and where that is headed. This shows sector-level income.
Now back in the last farm crisis, an economist at the Federal Reserve Board of Governors named Emanuel Melichar did a lot of analysis about the returns to farming. He was very critical of people using net farm income at the farm sector. And he said, “That’s not really the right way to do it. You need to use farm income, but you have to add back in interest. It’s part of what people use to fund debt, so it’s part of the return to assets that you have to add back in. And you have to add back in rents.”
I’ve constructed a very similar analysis to what he did. This chart shows that since 1929 returns to farm interest, farm operators plus interest and rent, has fallen 75 percent of the time between $60-$100 billion (all adjusted to 2005 dollars)[Chart 3].
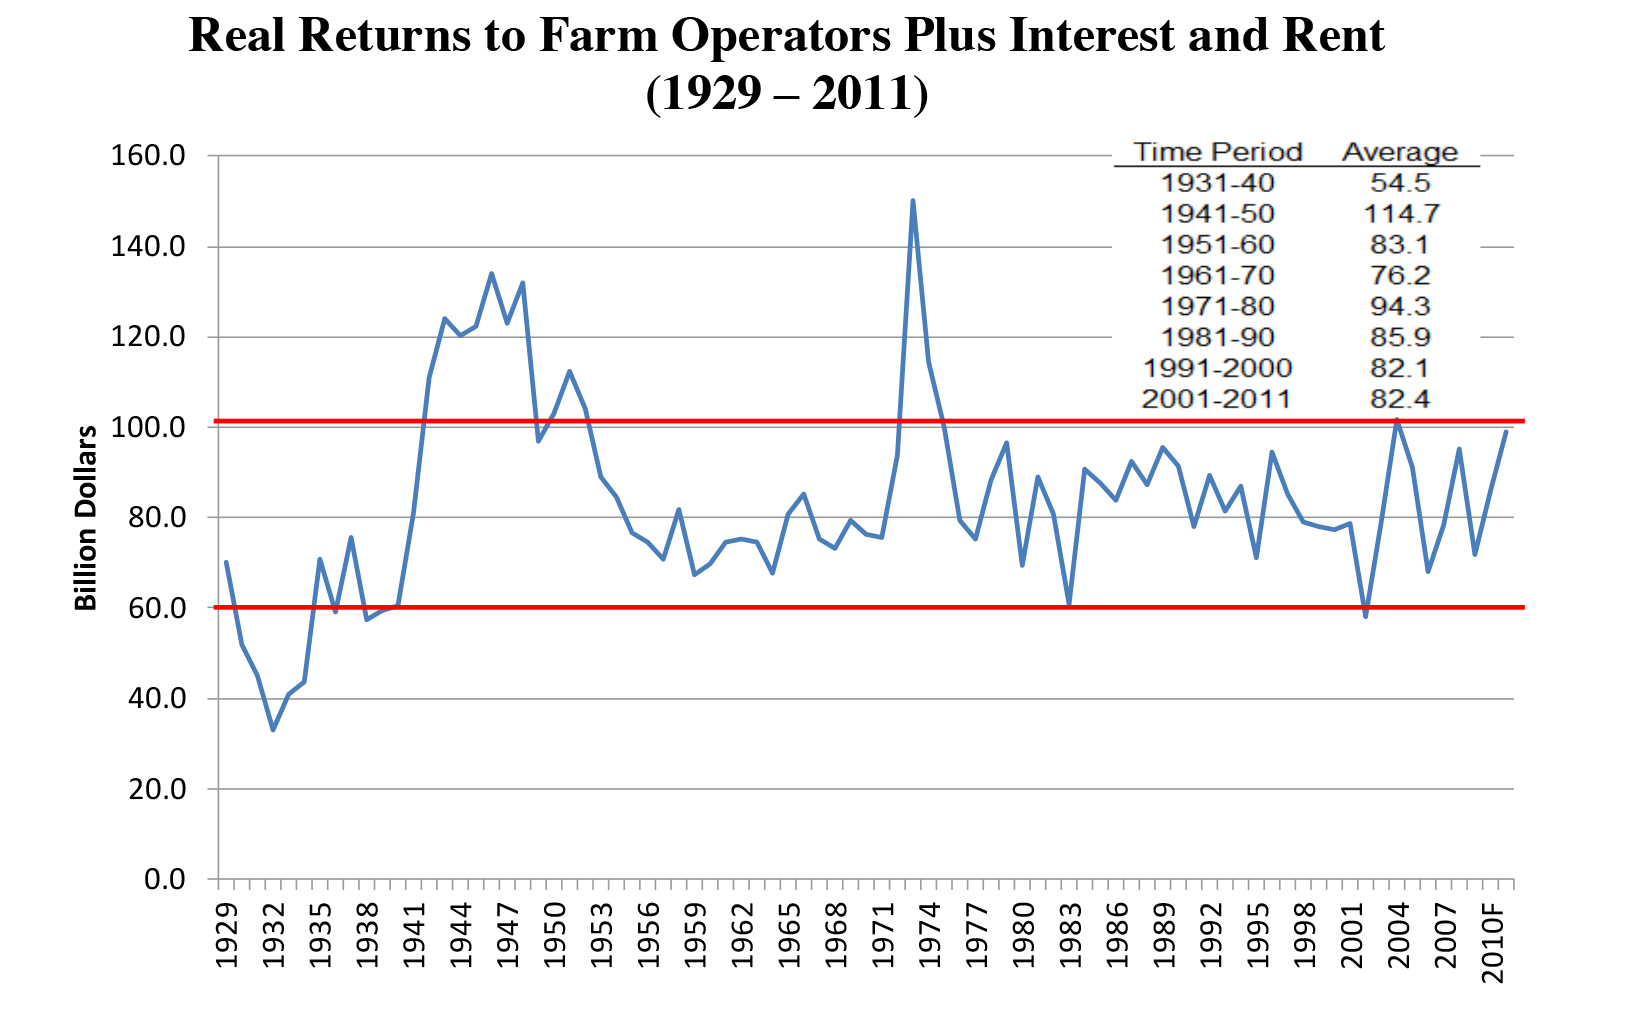
Chart 3. Real Returns to Farm Operators plus Interest and Rent, 1929-2011.
Up in the right corner you can see the averages. The best period was clearly the World War II period. We averaged over $100 billion. But look at how many times we’ve been outside of $100 billion. Not very many. The last time was in the 1970s. Even though these incomes have been big today, they have not been nearly as big as they were in the 1970s. In fact, when you look at the averages, the 2000s have not been that much different than the 1990s. What I am trying to illustrate here is, yes, times have been good; but in real terms they are not unprecedented on the income side. Remember what we said about the asset pricing side. They were really unprecedented.
That is shown in the next chart, which takes that net income and divides it by asset prices[Chart 4]. This is a rate of return on production assets. You can see this rate of return over that time period averages about 6 percent and right now we are closer to 4 percent. How many times have we been below 4 percent? About five: 1980, 1983 (both periods right before the crash and right in the middle of it, before asset prices fell dramatically), and most recently in the 2000s we’ve touched it. You can see that’s trending downward. This is a major red flag for us in terms of how fast asset prices have grown relative to incomes.
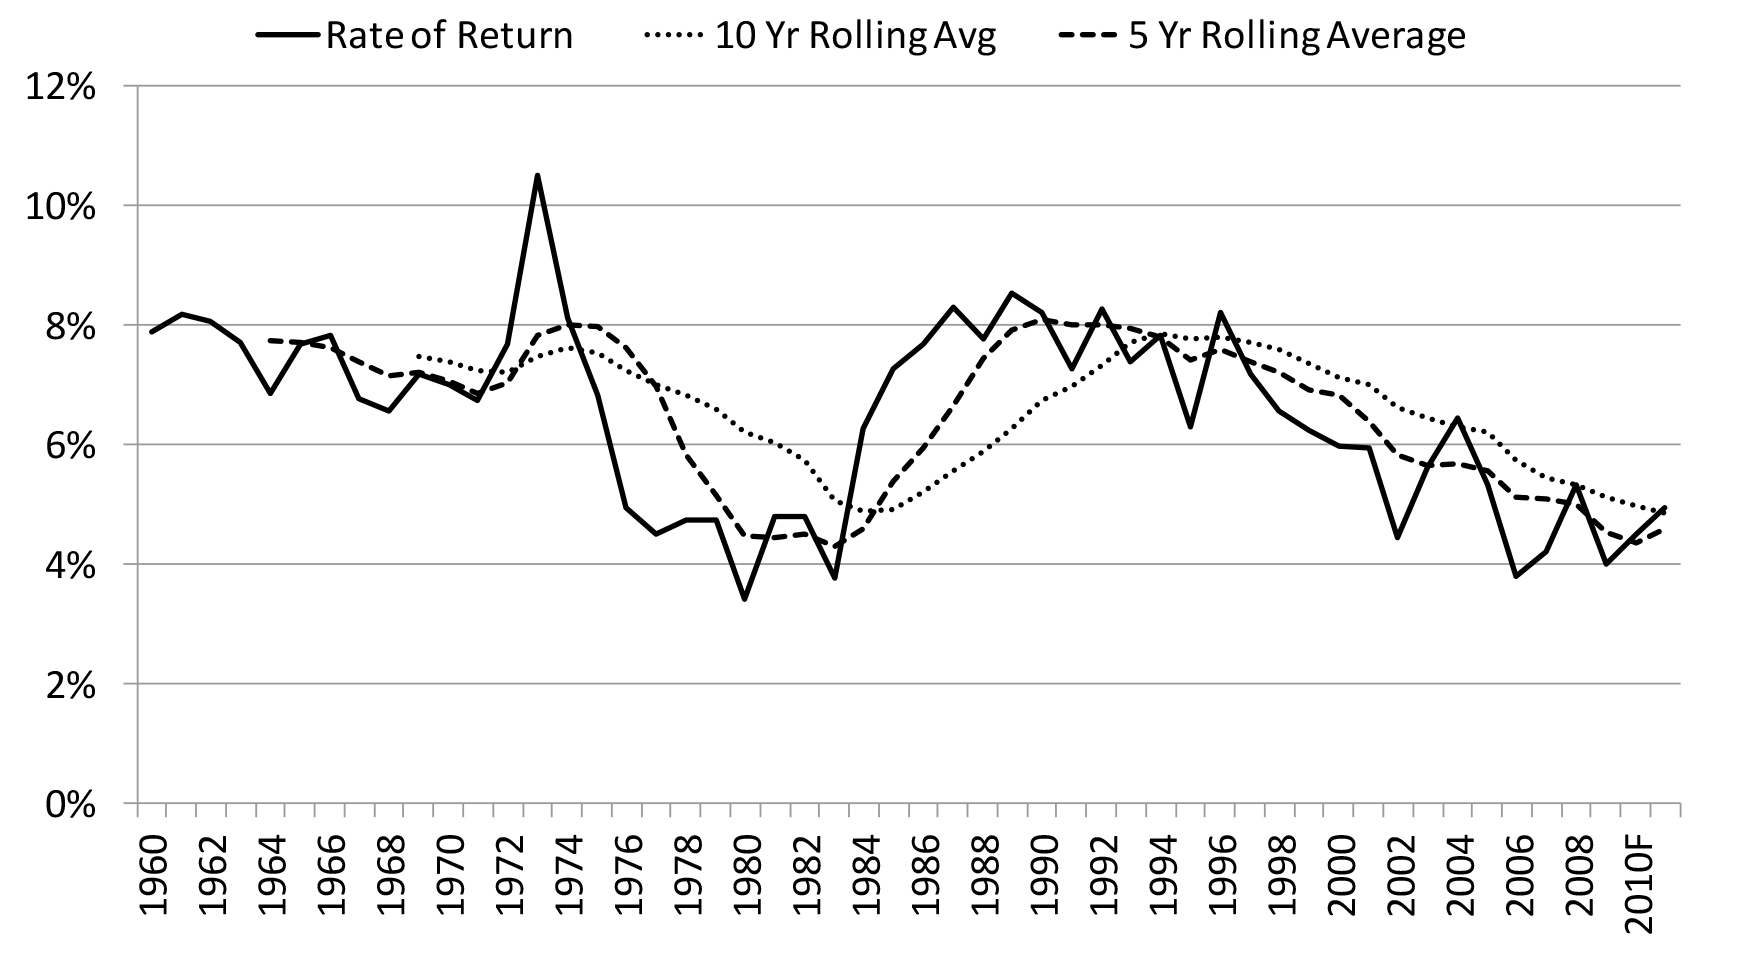
Chart 4: Real Returns to Farm Operators Plus Interest and Rent Divided by Farm Production Assests, 1960-2011.
At the sector level, we have a warning flag on the fundamentals. The rates of return are starting to go down to places where we haven’t been very often. This shows in Indiana farmland returns and budget of profit and loss[Chart 5]. In red are the cash rents. The shaded area is profit and loss. Here we see these profits at the farm level in the Corn Belt have been very, very good. Prior to 2007, in most cases, they are bouncing around between zero, usually between $50+ and $50-. The last few years they have been over $150 and, in some cases, over $250. This is putting tremendous upward pressure on cash rents. At the farm level,we are seeing increased pressure for rents to go up, which would pull our multiples down.
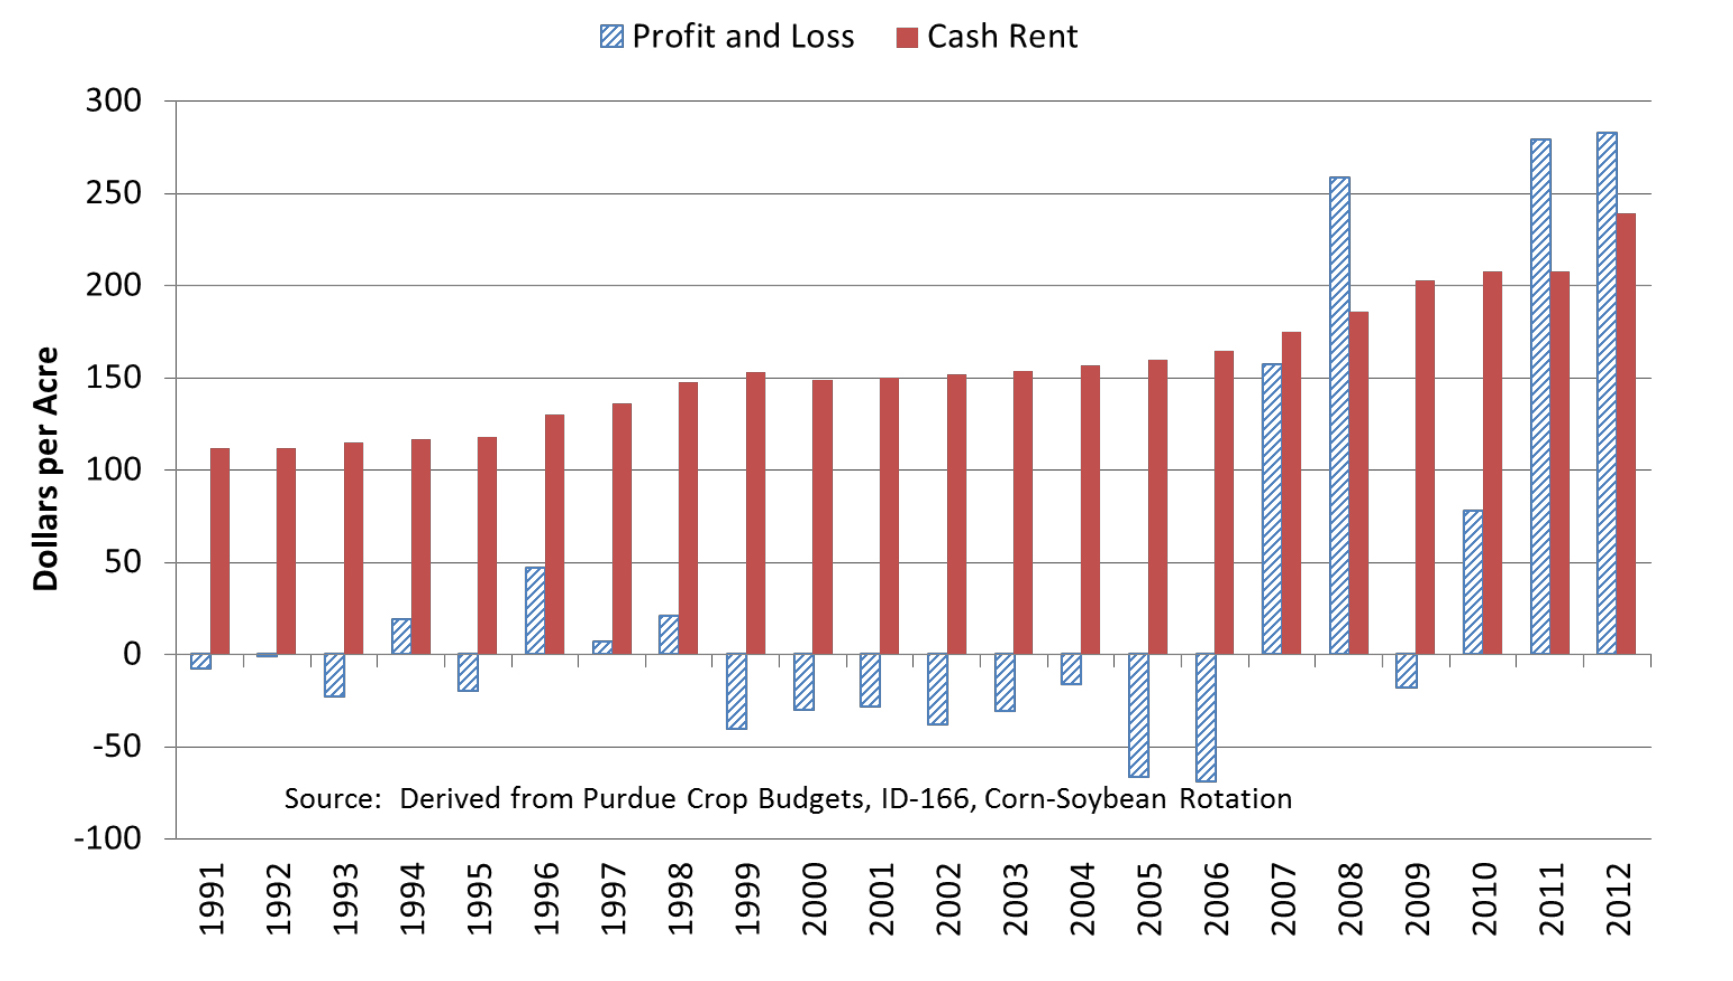
Chart 5. Budgeted Profit and Loss for High Quality Indiana Farmland, 1991-2012.
[Chart 6]shows the relationship between income and value per acre. Now these different colors in the rainbow all represent different capitalization rates: 3 percent on the top is in blue, the next one is at 4 percent in red. That shows that, if you take the income off the horizontal axis and get up to one of those multiple lines, it will tell you what the value of farmland is worth. The “T” that’s in there in black is where we are at in Indiana high-quality farmland. Turn $30 an acre average cash rent to $6,500 anacre farmland. That puts us at a capitalization rate between 3 and 4 percent, or a multiple of roughly 30.
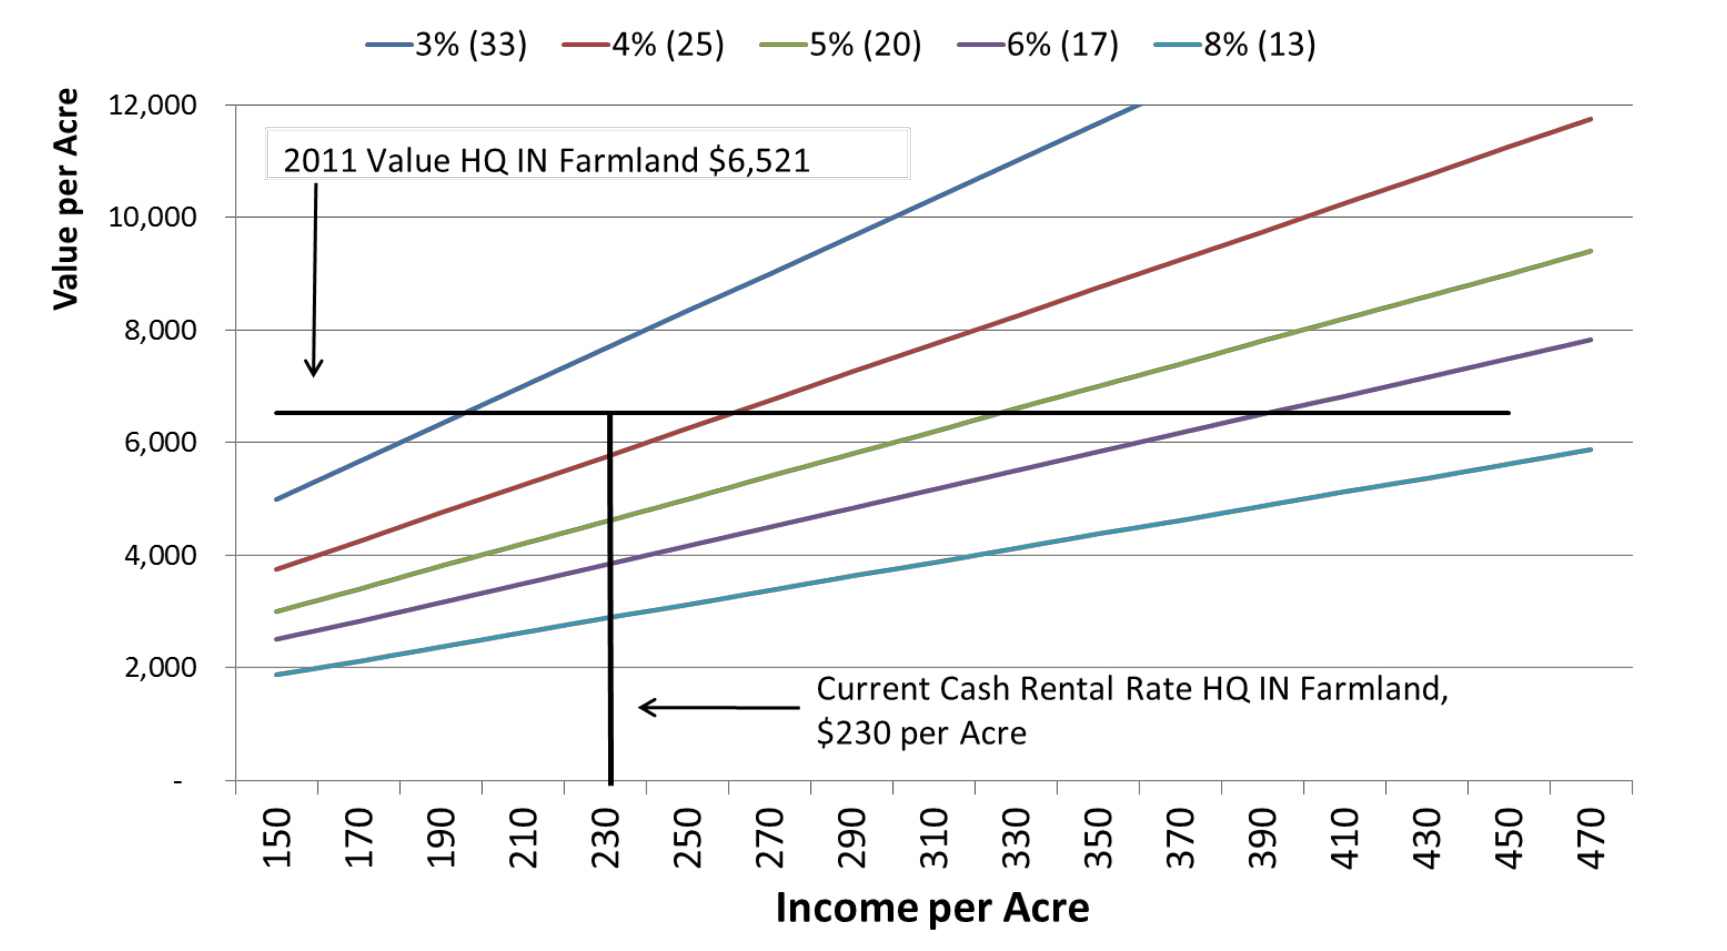
Chart 6. Land Values Under Alternative Capitalization Rates Multiples) and Income Levels
We hear stories all the time of farms selling for $10,000 an acre. How can you get to $10,000 an acre on this chart? If you keep it between a 3 and 4 percent capitalization rate, you can read over there off the vertical axis, you get down to about $300 an acre is required in cash rent at a 3 to 4 percent cap rate.
What happens if we go to a cap rate of 5 percent, which is 20 in green? How do you get to $10,000 off that chart? The answer is it is not on the chart. You have to have cash rental income of roughly $500 an acre. So you cansee the very powerful impact of interest rates on farmland prices. Anytime you see prices up in that $10,000 an acre they are based, at least in my opinion, I continue to have expectation of very low interest rates.
To summarize, we think those current values are highly dependent upon very low interest rates and high returns over variable costs. If any of you have been to an auction as I have and I went to an auction wanting to buy a farm very badly. I bid way more than I thought it was worth and we didn’t win the farm. You start to think, “What on earth could that person be thinking to pay that much for the farm?”
That question essentially drove us to do a research project to say, “What on earth are people thinking?” What are their expectations for prices going forward –not just of the farm –but what are their expectations? Because when I put numbers into my budget, I had to put very optimistic price forecasts in there to make the financing work out. What I wanted to know is, Where are people at on these things? That is the beauty of being a professor at a university. You can do a study to figure it out. So we did that.
In the spring of 2012, we had 246 completed respondents. You can see in the graph what their primary interest in farmland was. About 43 percent owned or operated a farm. We had a lot of lenders who completed the survey. We had a lot of landowners that completed it. About three-quarters of them owned farmland and about three-quarters of them wanted to purchase more farmland in the next five years and their ownership holdings were substantial. Most of these people on the median ownership was 500 acres, which is not a trivial amount if you are owning farmland in some of these areas. Many of them owned substantially more. They were also active participants in rental markets.
We asked those people a whole series of questions about the farmland market. One of the questions we asked was, “Do you think the farmland market is in a bubble?” A subjective question, but we just wanted to know what they thought. Of all those respondents, about half of them said yes. Now, not surprising to many of us in here, bankers were among the most skeptical that we were in a bubble, with over 50 percent saying they were very concerned about this market.
Those who were landowners and primarily rented their farms were less likely. And, when you split this by how many acres they own, the people who thought it was on a bubble owned about half of the amount of land of people who didn’t think it was in a bubble. Sopeople who owned more tended to not think it was in a bubble. People with more experience tended to be less likely to think it was in a bubble. That is telling us something. I was a little bit surprised by that response actually, because some of them with not very much experience have never been through one.
We asked them to consider a specific tract of farmland. We said 80 acres and it had to have production capacity of 165 bushels per acre. What we wanted to do was say, “We want you to buy that farm. Tell us what you think it is worth to you. What would you be willing to pay for that farm?”
We picked a farm that was not overly large, not overly trivially small, and a little bit below average production capacity for Corn Belt farms. We asked them to think about that farm. Then we asked them to value it. This chart shows in red the distribution of responses[Chart 7]. I ordered everybody’s responses by what they would pay and sorted them from high to low. That is the red line. You can see that about 75 percent of the people thought that farm was worth less than $8,000 an acre. Boy, about 25 percent, on the other hand, thought it was worth more than $8,000 an acre! Keep in mind, high-quality Indiana farmland would have production capacity of about 200 bushels an acre and our survey sells for $6,500 an acre today.
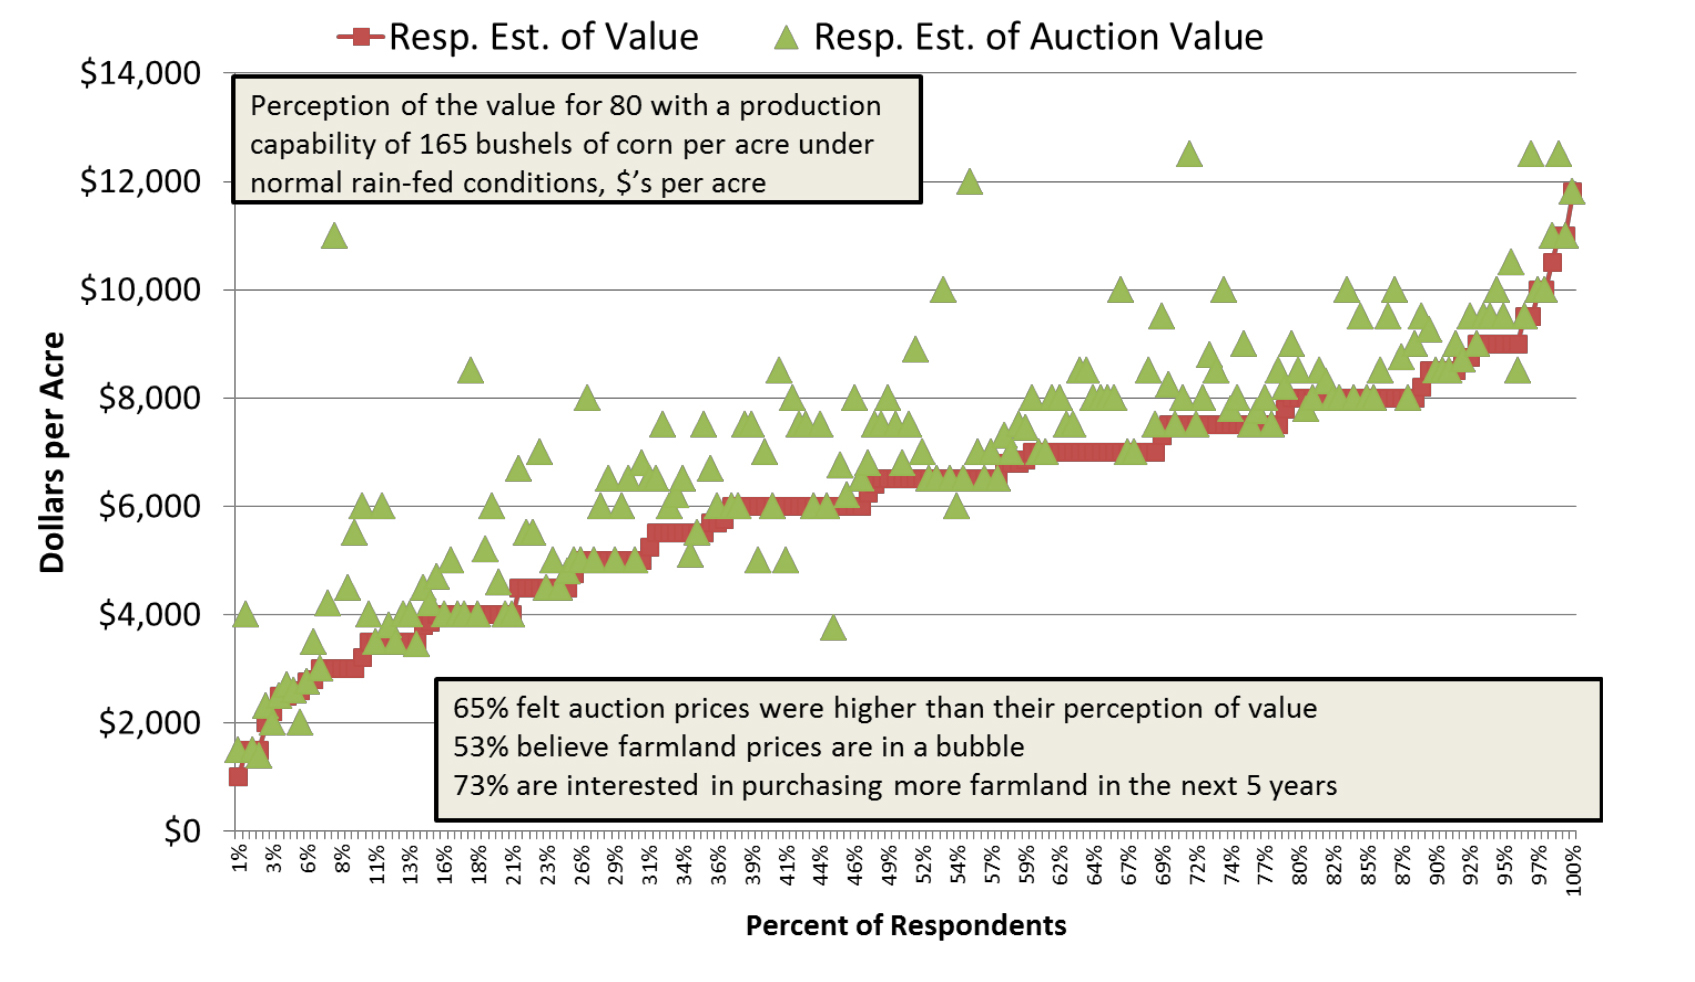
Chart 7. Estimates of Farmland Value and Price at Auction, Spring 2012
Some of these respondents have very optimistic ideas about what the land is worth. Some of them didn’t think it was worth very much at all. When we asked them, “What do you think that farm would sell for at auction? In other words, if it were to sell at auction, do you think you would buy it or not?” Those are represented by the green arrows. You can see there is a wide range of opinion there. Someone, say, down here, [I don’t have a strong enough pointer] at the 20 percent level said, “Boy, I think that farm is worth $4,000 an acre and I think somebody out there would pay $8,000 an acre for it.”
My response is, “Yes, he is probably right. Because if you look over from that red line, there are people up there who valued it way over $8,000 an acre to them.”
So, of all the people, there was somebody in the survey that would have bought –and thought it worth –what they thought it would sell for at auction. That is the first thing. What you are seeing is a lot of people tend to think there is somebody else out there willing to pay a lot for this farm. It probably reflects this bubble situation. Overall, their expectations for farmland also are very wide; it’s a very, very wide distribution.
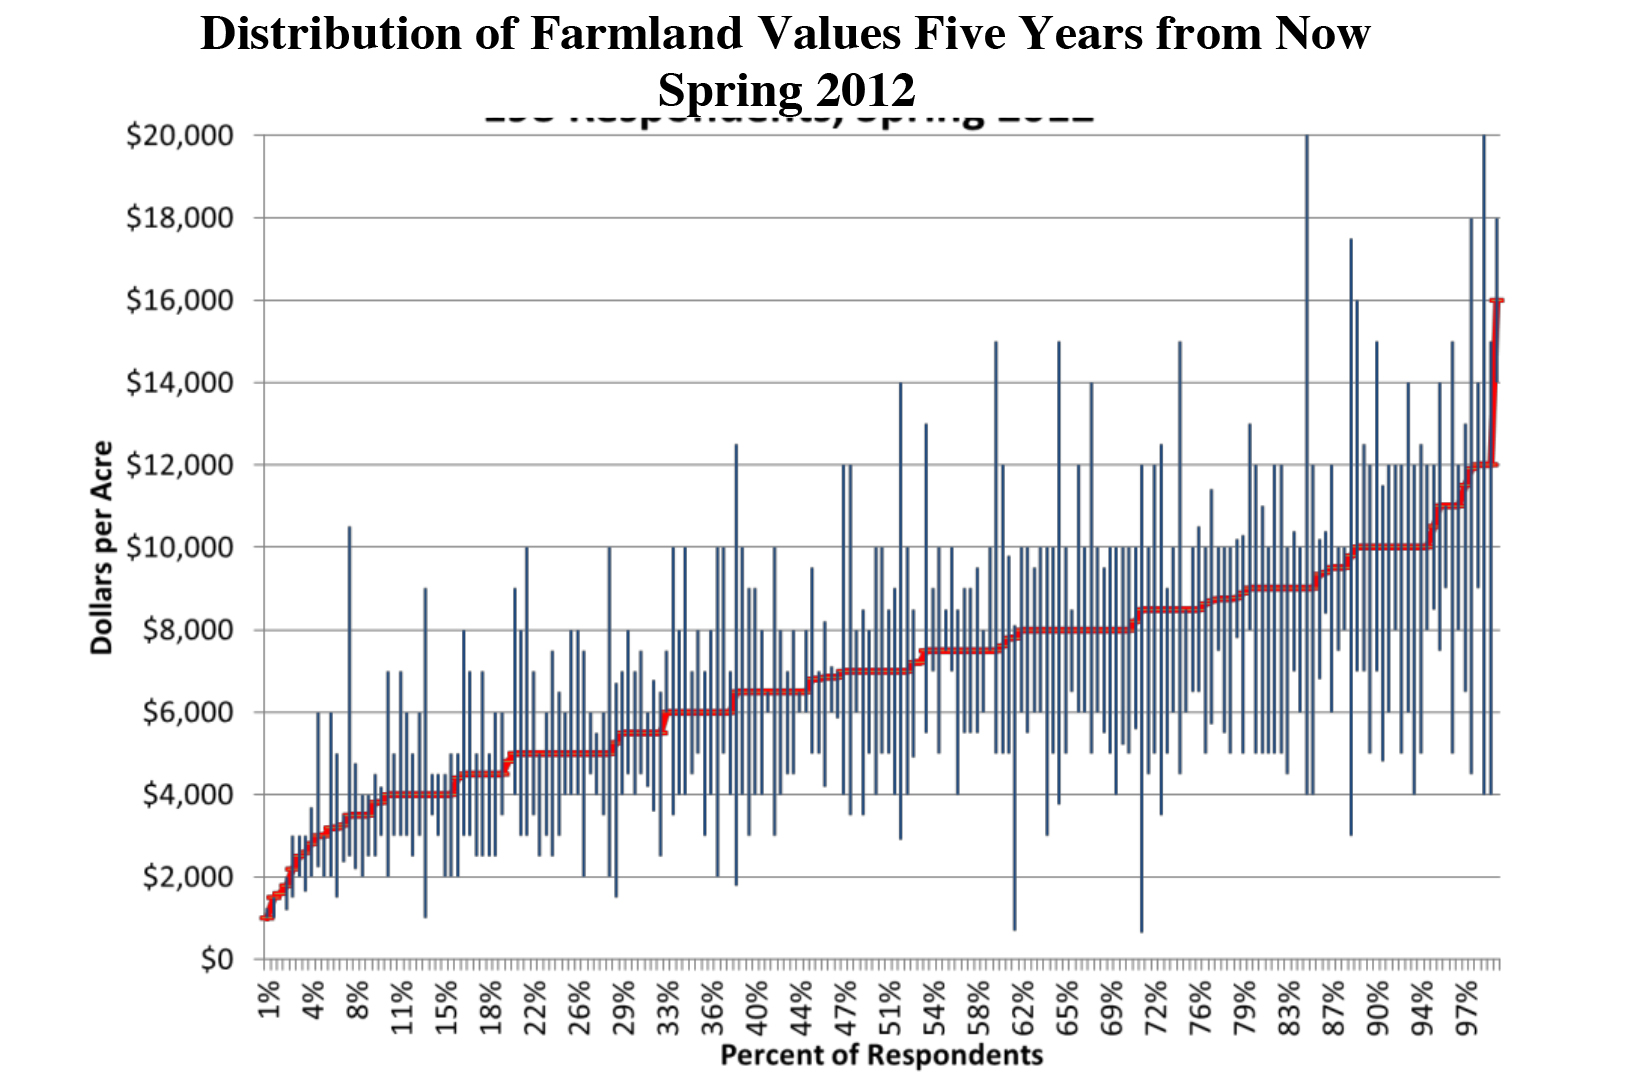
Chart 8. Distribution of Farmland Values Five Years from Now, Spring 2012
We also asked them, “What do you think it’s going to be worth five years from now and what are the one-in-ten chances it will be worth at the top and bottom end?” Again, I arranged those in order of red. Those magnitudes at the bars are their high and low expectations. Boy, what a wide distribution of opinions out there! Some people think these are narrow bands. Some people think it’s worth $8,000 an acre, but it could be worth up to $14,000 and as little as $2,000. That’s a range an economist would come up with. It pretty much captures every possible outcome. I would feel safe on that kind of a range.
Other people have much narrower bands. Overall, though, the average rate of appreciation they would be predicting is about 12 percent over an entire five-year period. Keep in mind we have been going up by 12 to 15 percent per year. Generally, I think it is going to slow down.
We asked them about cash rental rates. This again shows the diversity of opinion on cash rental rates [Chart 9]. I would say 70 percent of the people think this farm would rent for less than $300 an acre. In our survey we do of market conditions, this kind of farm is probably a little under $200 an acre right now.
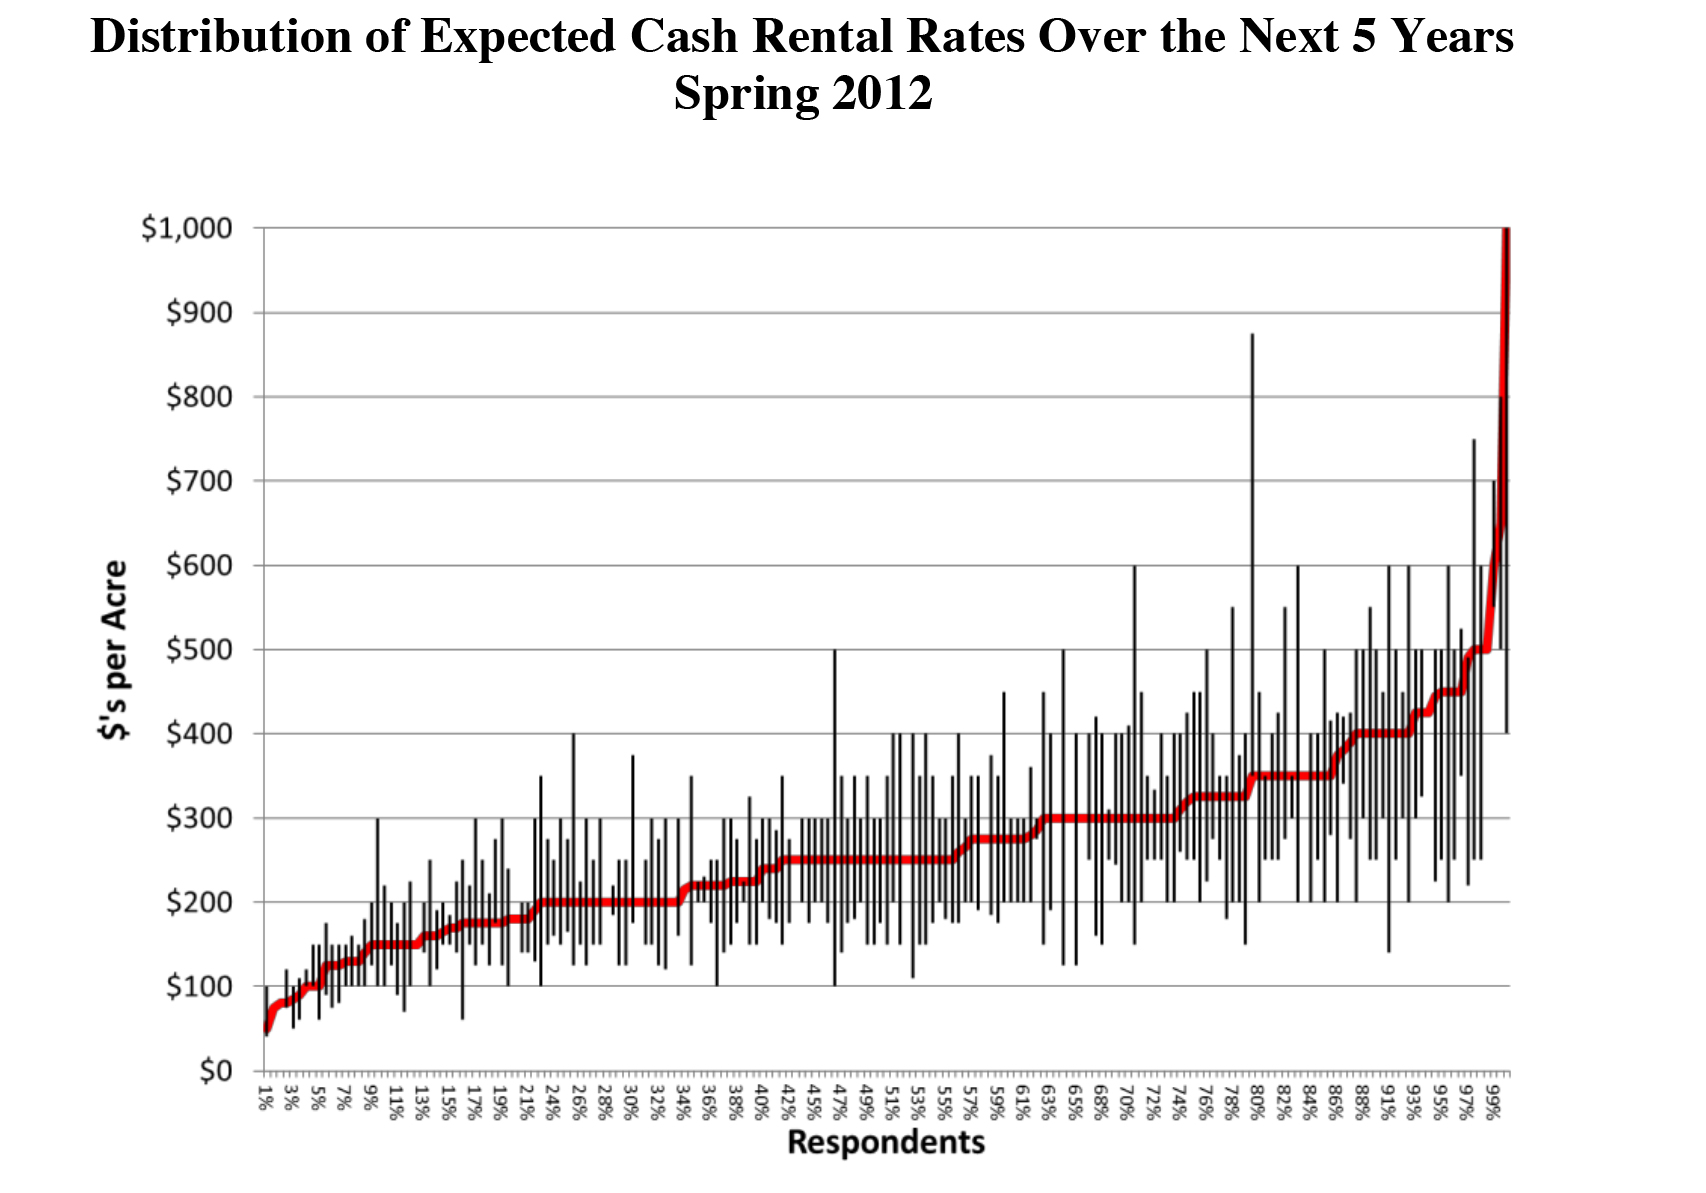
Chart 9. Distribution of Expected Cash Rental Rates Over the Next 5 Years, Spring 2012
There are a lot of people who would rent that farm for way over what we think it is and there is probably going to be a lot of upward pressure on rental rates. You can see that some people would pay up to $400 an acre to rent that farm. You put those two numbers together and you get a sense for what their multiples are. One of the first things I want to do is say, “Well, they have a multiple today. We knew what their rental rent was today, we knew what their price was, and that tells us what they think a multiple should be. That’s the red line [Chart 10].
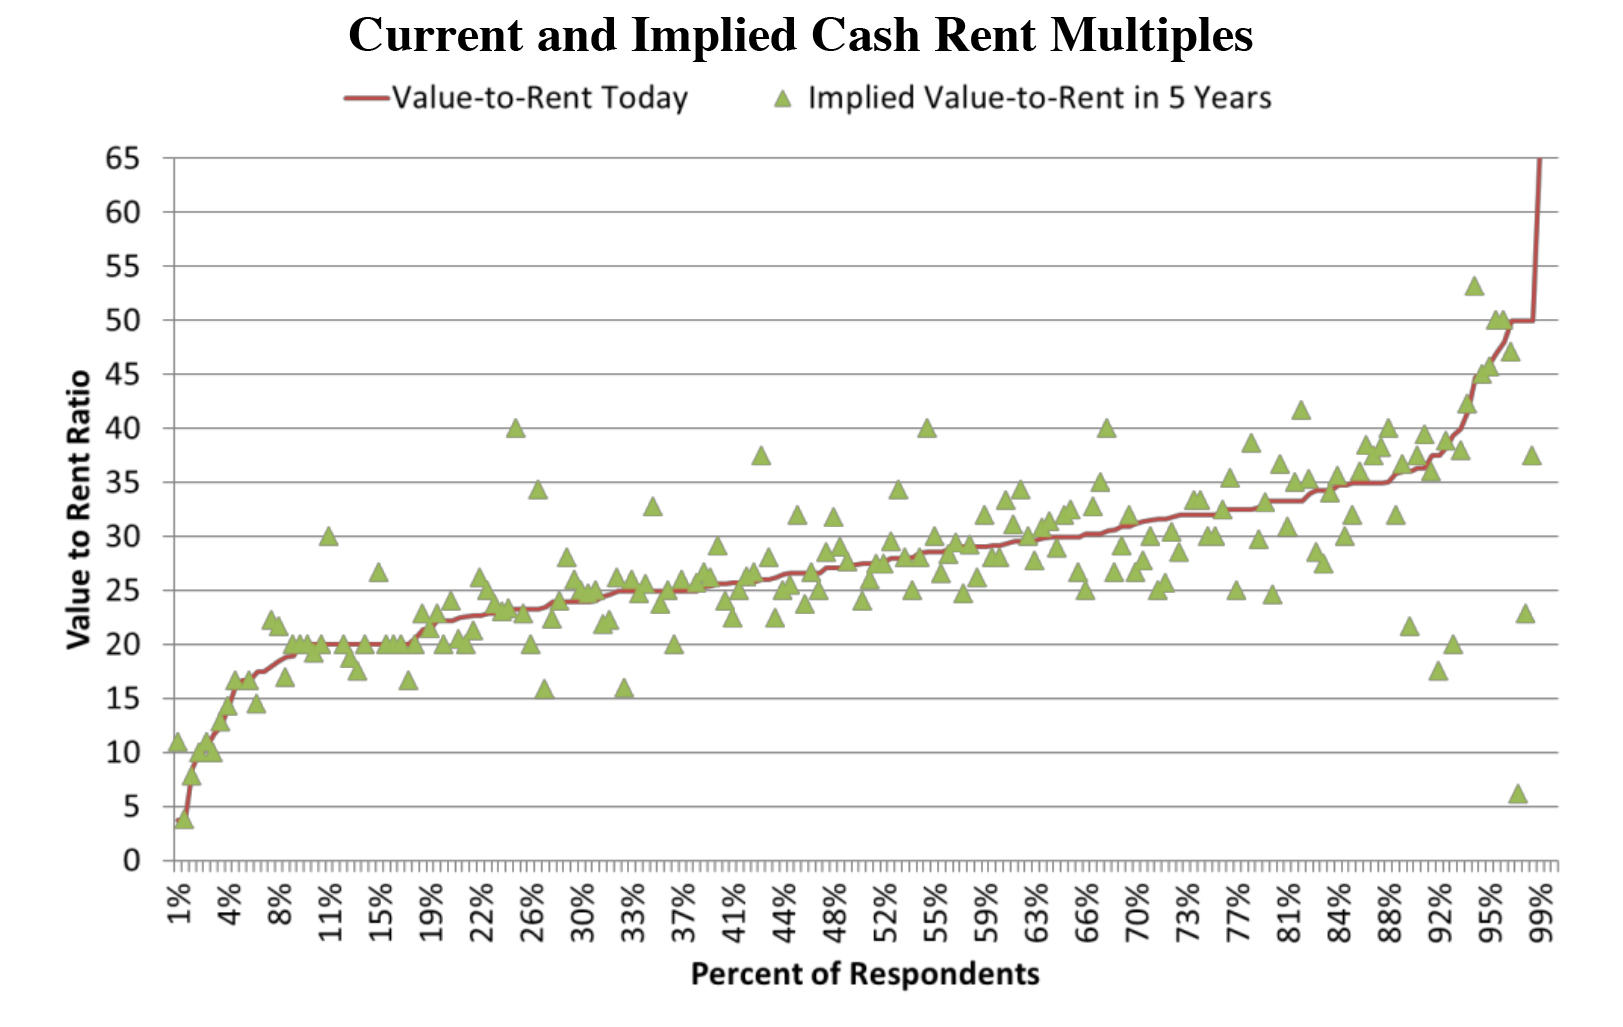
Chart 10. Current and Implied Cash Rent Multiples
About 70 percent of the people think that farm should be worth a multiple of less than 30. There are others that think it is worth more. The green is where they think it’s going to be in the future. Two things are really important. Look at how many people think we’re going to multiples below 20 –not very many. How many people think we are going to get to multiples less than 25? About 30 percent. So most people think the days of the 20 multiples are over, even going forward into the future. This is telling us something about how likely people think these multiples are to persist.
Another interesting thing is when you start to get future price/future rent, how coherent are people’s estimates of those? That is all over the board. Some people who put together multiples over 40; those are very, very extreme. In most cases, those would people who think prices are going up a whole bunch and rents are going to stay low.
On the other hand, you have people with very low multiples. In most cases, those are people who think rents are going to stay up and prices are going to crash. There is a little sense there may be a disconnect here. This is what I call one degree of separation.
Did you ever play that game, “7 Degrees of Kevin Bacon”? This is the first degree of separation –price from cash rental rate. The second degree is then corn prices. Because what drive the rental rates? Is it the farmland price that dives the cash rental rate? No, it’s the income that drives the cash rental rate than drives the farmland value, right?
So we asked on corn prices, What are their expectations of corn prices? Here you can see that, again, we are all over the board [Chart 11]. Very few of them think we are going back to a period where we are going to have corn prices less than $5 a bushel. In fact, one in five would say that a price less than $5 is likely. Most think $5 is a pretty good guess. Some, $5.50. But 25 percent think $6 and up is where we will end up on corn prices.
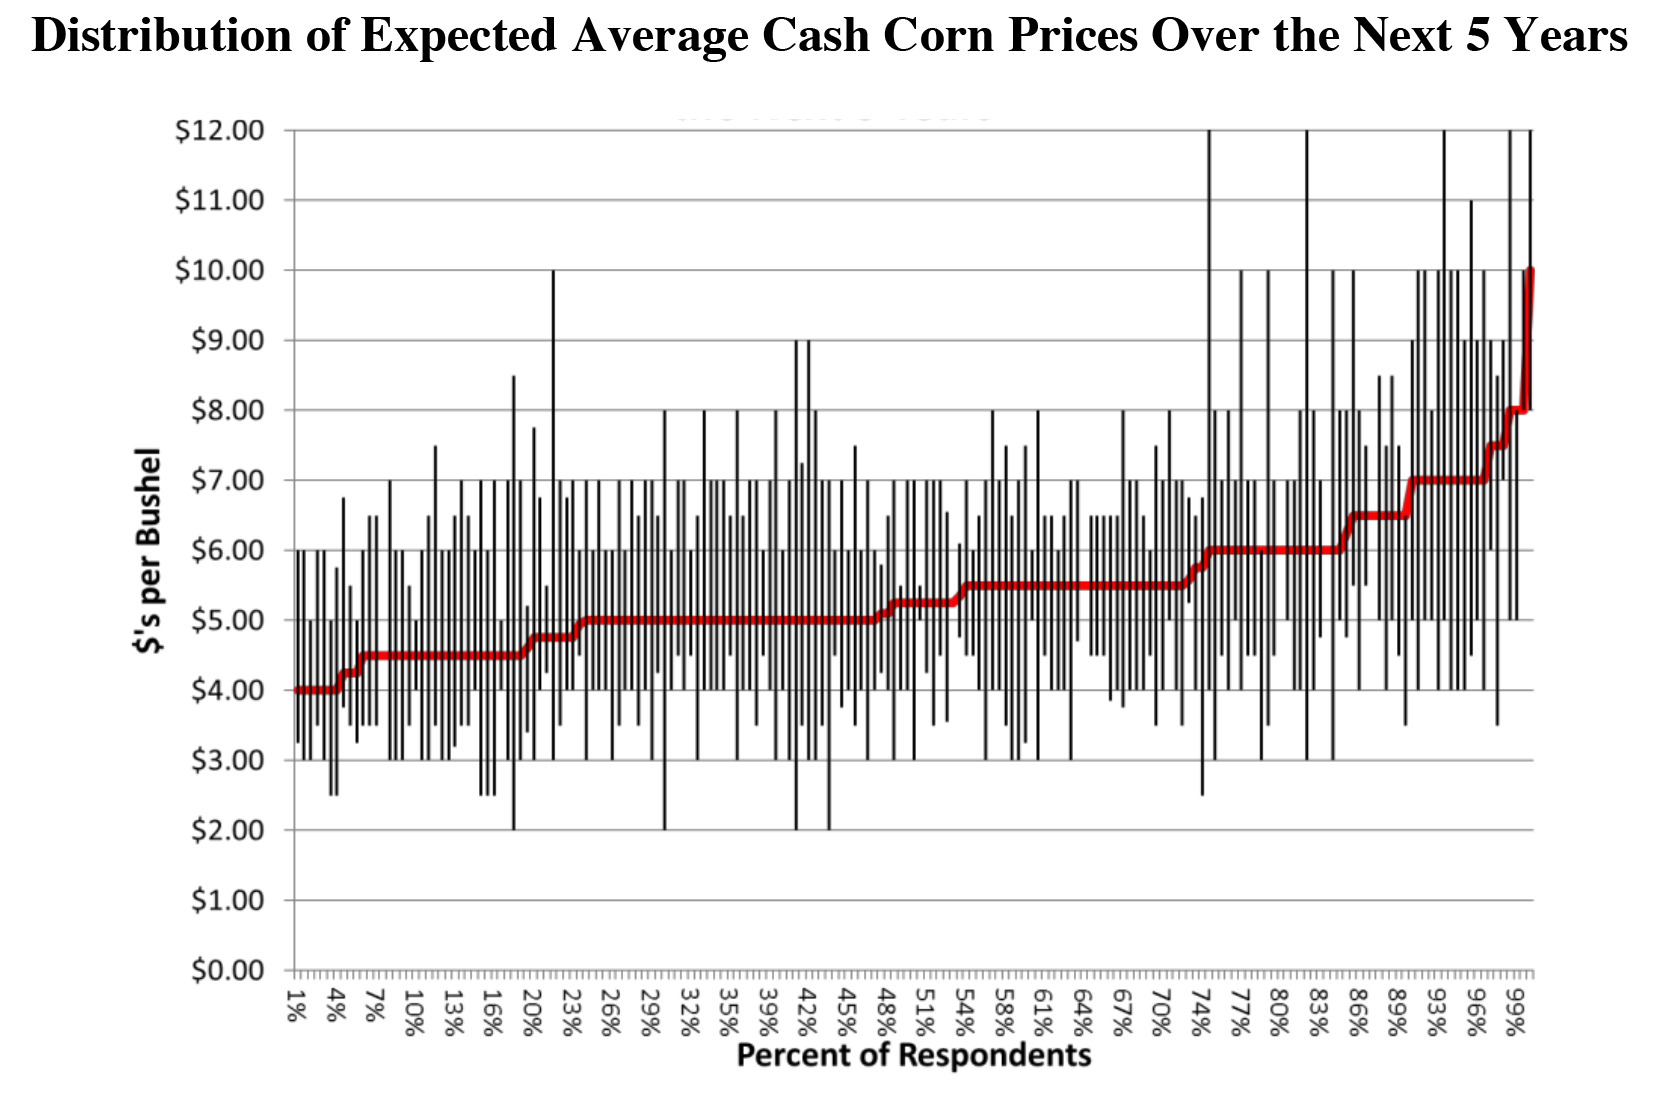
Chart 11. Distribution of Expected Average Cash Corn Prices Over the Next 5 Years
Back to my original example that started this. In order to get to the price the person paid for the farm I really wanted, if I wanted to buy that farm and I put $6 into my budget, I could have paid more than he was willing to pay for it. I didn’t think that was likely. So I’m thinking, okay, everybody that is on the high end of farm values probably has high corn prices into their budgets.
This chart shows the relationship between farmland values and corn prices [Chart 12]. If you look at that really hard, can you see any relationship in there? If you can, you are better than the computer, because the correlation between those two variables is about 0.02 or 0.03 and it is not statistically significant at any kind of a meaningful level. Somebody told me what I need to do is then put up the next slide and ex out every dot that doesn’t line up on bubble. So make it show “bubble.”
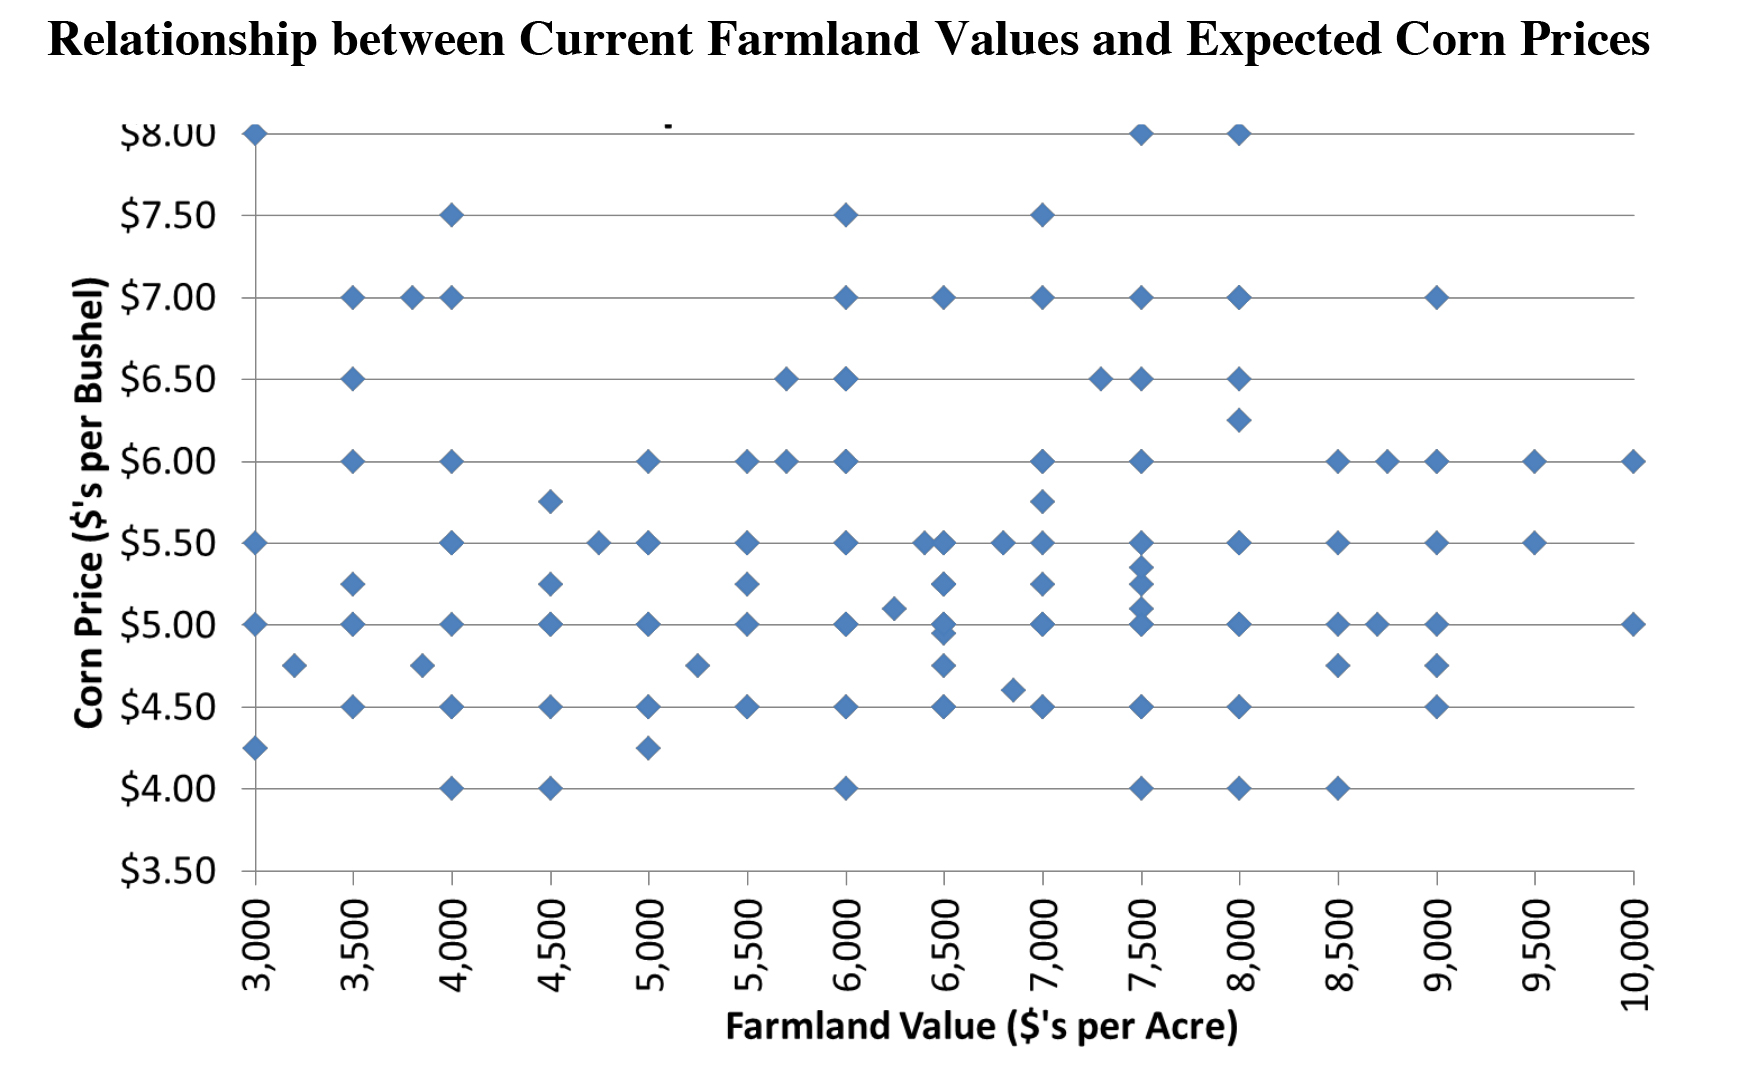
Chart 12. Relationship between Current Farmland Values and Expected Corn Prices
What this is saying is, when you get to two degrees of separation, the connection is off the chart. What we would expect is the people out there at $10,000 an acre ought to be up there on high corn prices. And the people at low corn prices ought to have lower land-value expectations, in some kind of a rough sense. Not perfect, but that is the kind of relationship we would be looking for. We didn’t find that. That’s a red flag.
A third red flag I want to point out is we asked them how they would finance? There is a lot of anecdotal evidence these are all cash purchases, which doesn’t mean you can’t lose a lot of money. It just means you lose a lot of your own money, as opposed to a lot of your banker’s money if the prices were to go down. There is a lot of anecdotal evidence that people buy this with all cash.
We asked these people –and these are people who are buying farmland –How would you finance it? Eleven percent said they would buy an 80-acre parcel with cash [Chart 13]. Eighty acres is not a huge farm for an additional farm to buy. So only 11 percent would fund that with cash. Most of them are going to borrow the additional money. There is some evidence there is probably more credit going into this than we would like to know.
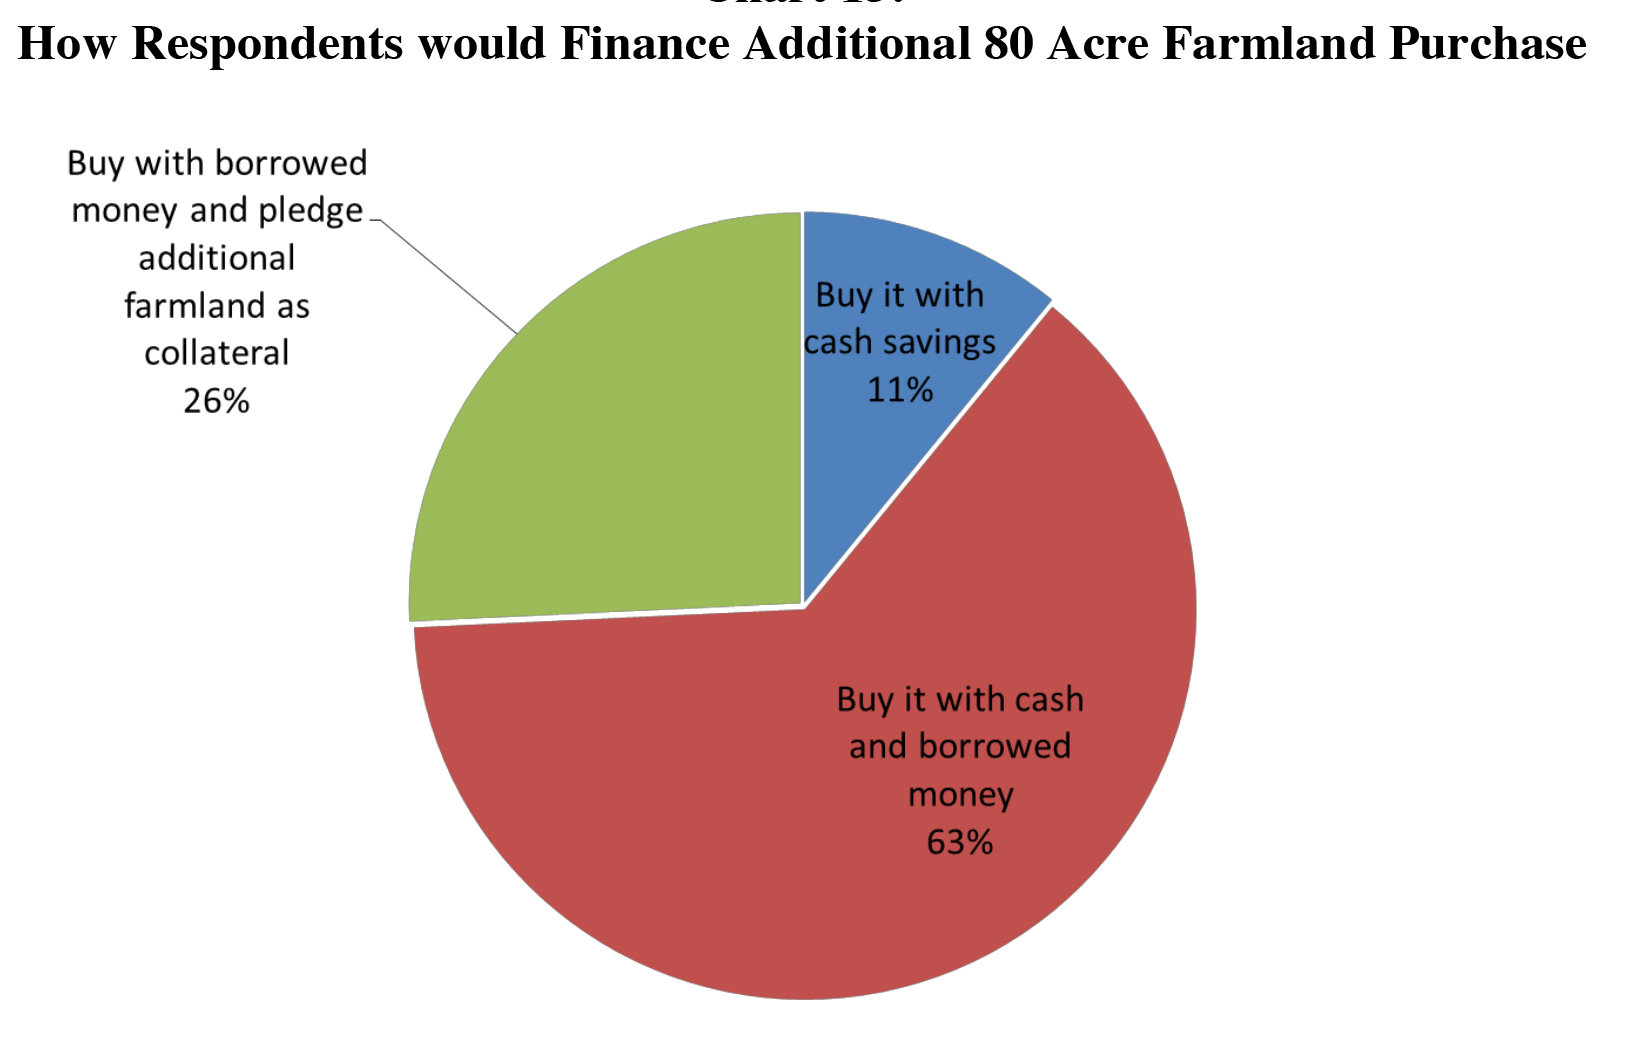
Chart 13. How Respondents would Finance Additional 80 Acre Farmland Purchase
In summary, the price increases we’ve seen recently are on par with some of the most dramatic we’ve seen in the last 50 years. They clearly reflect the view that returns are going to stay high over variable costs. As an economist, I can say it is very unlikely the market is in a bubble, according to an economist definition which we conveniently make to say such that we can’t really say anything about it. They don’t exist essentially, so that doesn’t say a lot. This does not obviously rule out the possibility that prices could fall substantially.
When you lay out what investors think, they are showing cautious optimism. They want to buy farmland. They want to buy more farmland in the future. They are concerned about whether the market is in a bubble, which I think is healthy. It does to me appear to indicate most of them are comfortable with multiples approaching 30 and they expect these are going to be maintained into the future. They also think corn prices above $5 a bushel, which right now looks to be really prescient, are here to stay. When you compare their forecast of values to corn prices, you don’t get much relationship, which is a major red flag.
To finish it off, the current returns are falling and relatively low levels. It should point out set prices are leveling off. Remember this whole premise when talked about what the premise was behind this is based on. The most credible premise is demand expansion from biofuels and emerging market growth.
The previous presenter did a wonderful job of highlighting all the things outside the farm sector’s control that contributed to the declines. One of the biggest trade policy can be a really, really big thing that is outside our control, but can have a big effect. Remember he talked about exchange rates and all these other things? If something were to change that demand scenario, this would have a very negative impact on farmland values.
There are some warning signs, but investors do appear to be mostly rationally evaluating fundamentals. Many expect these price increases are going to slow down, with the caveat that right now we don’t have a lot of supply on the market offered to the market. You saw there are people at the upper end of that price distribution. The ultimate question is, How much purchasing power do the people at the upper end of the demand curve have and how high are they going to push prices until their purchasing power is exhausted? As we have tight supplies offered to the market, their demand is going to drive prices.
Jason, we started a little bit later. I tried to get us back to on time, but if I’ve exhausted our questions, they were probably better addressed to the Ambassador anyway. Do we have time for a question or two?
![]()
![]()
![]()
![]()
![]()
TEAM LINKS:
PART OF A SERIES:
RELATED RESOURCES
UPCOMING EVENTS
We are taking a short break, but please plan to join us at one of our future programs that is a little farther in the future.