Excel Workshop: Hone Your Skills
Even if you have been an Excel user for years, there are likely features or approaches that could make you excel at Excel even more. This workshop video was prepared for AgGateway’s fall 2020 conference and is now available to all via YouTube.
This workshop video is under one hour, but if you watch and then do (as you should do in order to reinforce the learning), it might take 90-100 minutes from top to bottom. If you are a complete novice with spreadsheets, this may not be the best place to start. In that case, I suggest the Excel portions of the “Digging into the Data Pipeline” webinar series.
But if you can do algebra, you have used spreadsheets before, and want to grow your skills for problem solving, this workshop is for you.
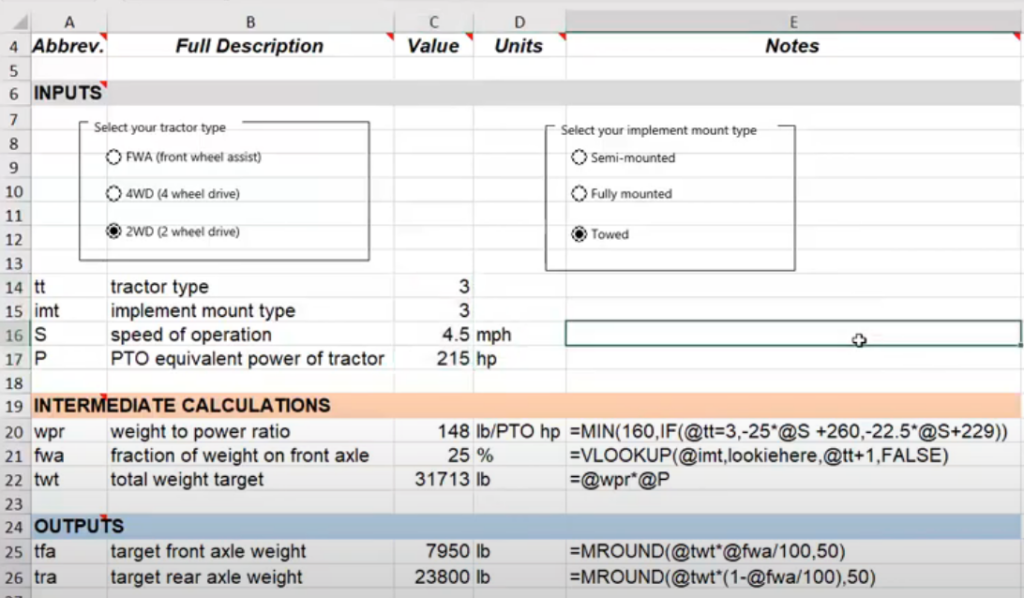
What will you learn? Logical spreadsheeting in a time-tested format that lends your spreadsheet decision or design tools to be intuitive to any user, fully documented, and structured in a way that will never need a user’s manual. You will see (& practice) how to incorporate data validation, intrinsic functions regarding rounding and lookup, and generate and use trendlines. You’ll see how to use names rather than cell references (for readability), insert forms for user friendliness, and enable protection to avoid inadvertent changes to your precious formulas. Data tables are introduced and will enable you to do what if analyses without redoing the math. You will get a glimpse of how you might link different spreadsheet tools together to reduce development overhead. Links to other examples and resources are also provided.

What won’t you learn? Anything related to data analysis in spreadsheets … that just wouldn't’t fit within the time frame. Sorry. However, that is covered briefly in this one.


