March 6, 2011
Are Economic Fundamentals Driving Farmland Values?
by Brent A. Gloy, Michael D. Boehlje, Craig L. Dobbins, Christopher Hurt, and Timothy G. Baker
Farmland is a critical asset in the agricultural sector, comprising 85% of the assets in production agriculture. Soaring farmland values have generated considerable national news attention and given rise to questions about the factors driving farmland values higher and whether current farmland values are reasonable. Many in the agricultural sector are worried that the farm sector is headed for a repeat of the farmland value bubble that collapsed in the 1980s. From an economic perspective, the first of the above questions has a relatively straight-forward answer. The second question regarding the “reasonableness” of land values is much more difficult to answer.
To answer these questions, one must first realize that farmland is a capital asset that will produce earnings indefinitely into the future. Capital assets derive their economic value from these future earnings. For this reason, the value placed on farmland should reflect the market consensus of the present value of those future returns. Thus, to value farmland, market participants must forecast future earnings associated with farmland and what those earnings will be worth in today’s dollars.
As a result, two fundamental drivers generally influence the value of any capital asset including farmland, future earnings and the expected opportunity cost of funds—the rate at which market participants discount future earnings. Expected future earnings are clearly an important driver of farmland value. Other things equal, the higher expected earnings, the more investors will pay for farmland. More subtle is the role played by opportunity costs. An opportunity cost is created because funds used to purchase farmland could be invested in other assets. Consequently, future earnings must be discounted. Factors such as expected future inflation, borrowing costs, and rates of return on alternative investments affect the expected opportunity cost of funds. Other things equal, higher discount rates will decrease farmland values. This article examines the role of expected earnings and opportunity costs on farmland values.
A Fundamental Approach to Valuation of Farmland
The traditional income capitalization model provides a straightforward approach with which to view the economic fundamentals of farmland values. This model simplifies the farmland valuation problem and expresses current farmland values as a function of current income produced by farmland, the opportunity cost of capital or discount rate, and the constant rate at which income is expected to grow in the future, as shown below:
This model argues that increases in farmland values can come from expectations of increases in income, decreases in the discount rate, or increases in the growth rate of income produced by farmland. The cash rental rate in $’s per acre is frequently used as a proxy for the income produced by an acre of farmland. The discount rate represents the opportunity cost of invested funds or the rate of return that an investor would require in order to own this asset. This rate can be thought of as the rate of return on risk-free securities plus an upward adjustment for the risk associated with the farmland investment. The rate that could be earned on an investment of comparable risk is another way to think of the opportunity cost. The growth rate is the rate at which the returns to farmland are expected to grow. The model assumes the growth rate is constant into perpetuity. The difference between the discount rate and the growth rate is often referred to as the capitalization rate.
Although the income capitalization formula provides a mathematical relationship between expected income, expected income growth, and expected opportunity costs, it is a simplification of reality. Nonetheless, it can be used to provide useful insights about the impact of different economic conditions on farmland values. However, one must be aware that evaluating the “reasonableness” of various expectations is a very difficult task. Earnings from agricultural production can be quite volatile and difficult to predict. This is also true when considering the opportunity costs facing producers. Although the present opportunity cost is known at the time of investment, these costs will change in the future. Reasonable people can have very different views of the future prospects of these fundamental drivers of value. This is particularly true during periods of high volatility or rapid change in the forces that influence future returns and opportunity costs. When market participants underestimate the risk that the consensus view is overly optimistic or pessimistic, the market can become over or under priced.
Complicating this situation is the fact that the amount of farmland that is sold in a given year is a relatively small amount of the total quantity of farmland. Because there are relatively few transactions per year in farmland, a very limited number of buyers and sellers have a chance to express their forecasts of the future. A 2010 Nebraska survey indicated that farmland turnover—changes in ownership—which typically is 3-5% per year, is currently only about 1.5% per year, less than one-half the historical average (Johnson, 2010). Contrast this with ownership claims on a publicly traded company such as Microsoft where investors trade roughly 0.74% of the outstanding equity shares on a daily basis, based on the 50 day average daily trading volume and shares outstanding on March 29, 2011, as reported in a summary quote for Microsoft, (MSFT) on www.NASDAQ.com.
So what is the present situation for farmland income, and interest rates, and what do current land values suggest about expectations for these drivers in the future? By understanding these drivers we can start to answer the second and much more difficult question as to whether current land values are “reasonable”.
Farmland Earnings
In the Corn Belt, increases in net farm income have been driven in large part by substantial corn and soybean price increases. Demand shifts including a rapidly growing soybean export market in China and the rapid growth of the U.S. ethanol industry have been major contributors to price increases. These two demands now account for roughly 20 million acres of U.S. soybean production and 20 million acres of U.S. corn production or roughly one-quarter of the 2010 harvested acres of each crop (Gloy, et al., 2011). These demand shifts combined with recent production shortfalls due to adverse weather have led to historically low projected ending inventories relative to utilization for the 2010-11 crops.
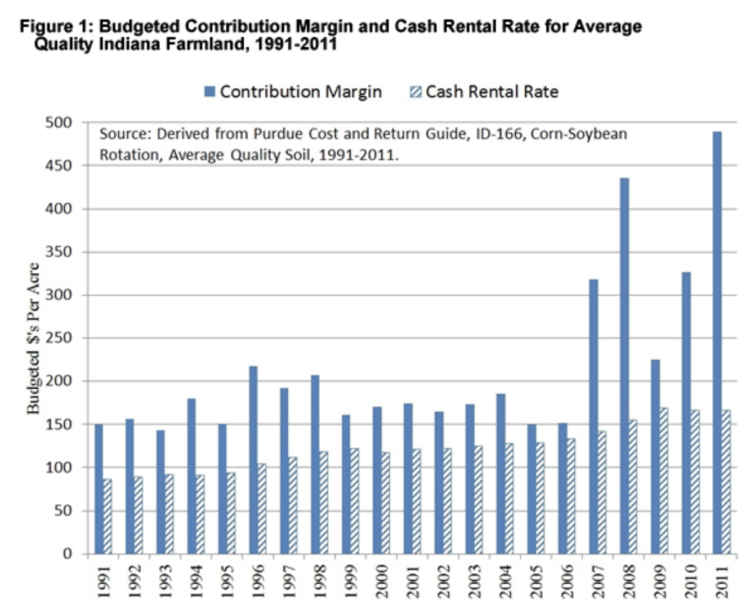
As a result of strong demand and tight commodity stocks-to-use ratios, current crop prices are relatively high and volatile. Although input costs have also risen, the net result has been a substantial increase in the profitability of row- crop production in the United States. This is illustrated in Figure 1 which shows the budgeted contribution margin and cash rental rate for average quality Indiana farmland for the years 1991-2011. The budgeted contribution margin is calculated by subtracting the variable costs of production from revenues and is what remains to cover all overhead costs including land, machinery replacement, family labor, and management. Today’s contribution margin is at its most favorable level in recent times. The chart also shows that cash rental rates have risen steadily, but not as rapidly as contribution margins. Given the large increases in contribution margins, one would expect that rental rates will continue upward at least in the short-term. One of the most important considerations influencing land values is whether these higher contribution margins and cash rental rates will be maintained into the future.

Figure 1. Budgeted Contribution Margin and Cash Rental Rate for Average Quality Indiana Farmland, 1991-2011
The Relationship between Farmland Value and Earnings
The value-to-cash rent multiple is one of the most common metrics used to describe the relationship between land prices and income. The value-to-cash rent ratio describes how much buyers are willing to pay for each dollar of cash rental income—it is an analogous concept to the price to earnings (P/E) ratio commonly used in assessing values relative to earnings in the equity markets.
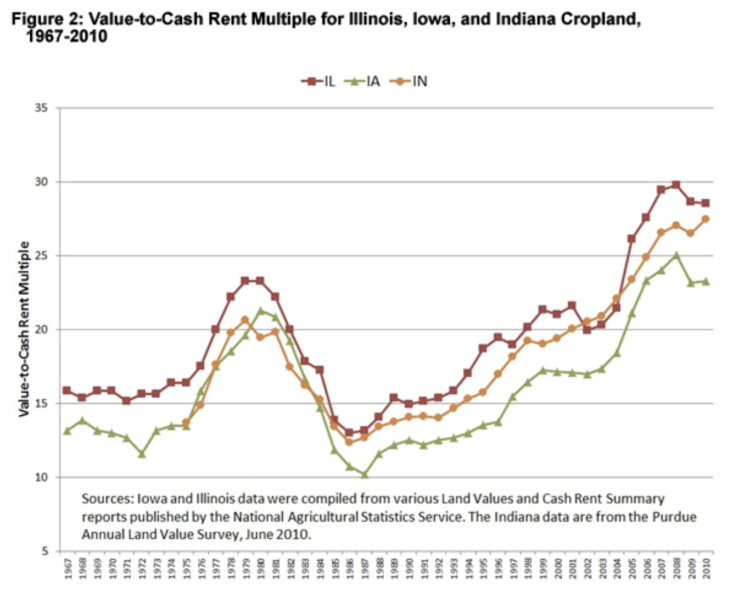
The value-to-rent ratio for Illinois, Iowa and Indiana cropland is shown in Figure 2. Not only has income increased as discussed in the previous section, but investors are willing to pay more for that income stream as well. Even before budgeted returns started to increase in 2006-07, farmland values rose as investors were willing to pay more for each dollar of current earnings. In the case of Indiana, investors are currently willing to pay nearly $28 for each dollar of cash rent produced by average quality Indiana farmland. This places the value to rent ratio at its highest point in modern times. While the ratio has recently experienced a slight decline in Illinois and Iowa, it is still near all-time highs in both states.
It is possible that cash rents have not fully adjusted to higher contribution margins and that future cash rental rate increases will bring the value-to-rent multiple down. Regardless, these value-to-rent multiple levels clearly indicate that investors have a very low opportunity cost for funds, they expect incomes to grow substantially in the future, or both.
When examining this chart it is tempting to argue that at present this multiple is abnormally high. However, one must be cautious about such conclusions based on this graph alone. The same argument could have been made in 1997. Why would an investor have paid $18.20 for each dollar of cash rent in 1997 and only $12.40 in 1986? Part of the answer is that investors likely had a more favorable future outlook in 1997 than in 1986. Whether those expectations materialize is another story. Another part of the story involves interest rates which were lower in 1997 than in 1986.
Interest Rates
As illustrated in the income capitalization model, interest rates play a role in determining the value of farmland as they are a fundamental determinant of the opportunity cost of capital and thus the capitalization rate. Lower interest rates reflect a lower opportunity cost of capital, reducing the discount applied to future earnings received from farmland, and increasing the farmland valuation multiple.
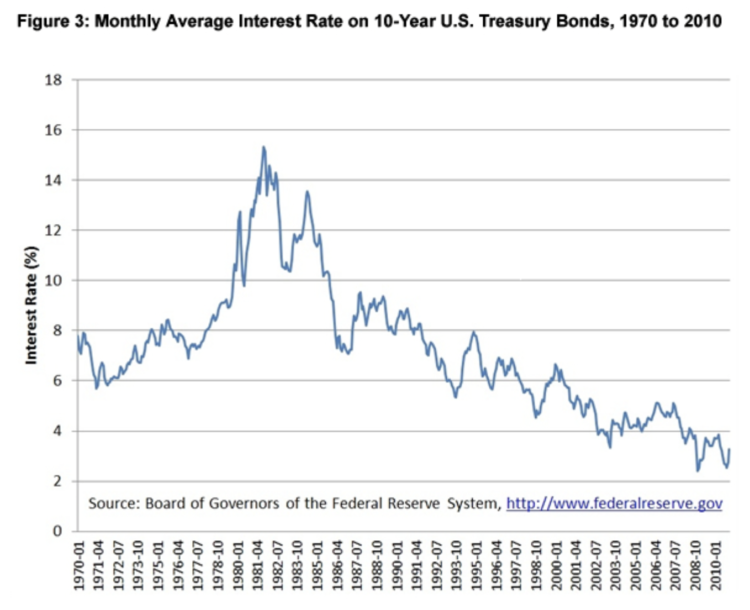
The interest rate on 10-year Treasury bond is often used to represent the risk-free interest rate on long term investments. Figure 3 shows the average interest rate paid on 10-year U.S. Treasury bonds from 1970 to 2010. Rates have fluctuated widely over this period. Starting in 1970, interest rates started to climb, almost doubling over the next decade and reaching a peak of 15% in the early 1980s. Since then, interest rates have declined dramatically, falling to around 3% today. While the exact impact of interest rates on farmland prices is difficult to measure, the large increases of the early 1980s should have had a negative impact on farmland prices, and the large declines since the 1980s should support rising farmland prices.
Assuming that the risk premium and income growth rate remain constant, a decline in the risk-free component of the discount rate decreases the capitalization rate. At low capitalization rates, the impact on land values can be dramatic. For instance, a capitalization rate of 4% which is consistent with current economic conditions would result in an earnings multiple of 25 being applied to each dollar of current income, while a capitalization rate of 8% which was consistent with the late 1980’s would produce a multiple of 12.5. When put into the context of actual land values, these changes are striking. Using the simple capitalization model, land that produces cash rent of $200 per acre with capitalization rates of 8% and a multiple of 12.5 would be valued at $2,500. In contrast, the same cash rent with capitalization rates of 4% and a multiple of 25 would be valued at $5,000 per acre.
Current Farmland Values
The June 2010 survey of Indiana (Dobbins and Cook, 2010) shows a farmland price for average quality farmland of $4,419 per acre, and the associated cash rental rate was $161 per acre. These values produce a capitalization rate of 3.64% . With 10-year U.S. Treasury bonds at 3.25%, these values imply that investors were willing to accept rates of return only slightly higher than the yield on the 10-year Treasury bond for owning farmland, or that they expected substantial income growth from farmland (Gloy, et al., 2011).
If interest rates increase, it would likely put substantial pressure on cash rent multiples and farmland values. Holding other things equal, if capitalization rates would increase from 3.64% to 4.64%, the multiple would decrease from its current level of 27 to 21.5. In order to maintain land values, expectations of future income would need to rise and/or investors would have to accept a lower risk premium. For example, if the multiple decreased to 21.5, the current cash rent on average quality Indiana farmland would have to rise from $161 per acre to nearly $205 per acre to maintain land values.
While there are many factors which support the case for increased farmland income in the future, one must be very careful in assuming growth rates beyond the general rate of inflation and the rate of productivity growth in agriculture. Sustained growth beyond this level would require substantial demand growth that would manifest itself in continually higher agricultural product prices.
The Bottom Line
Farmland prices have undergone a significant increase in recent years. These increases have come in part, in response to increased farm earnings and low interest rates. Were these factors to reverse it would put downward pressure on land values. It is important for market participants to understand that earnings associated with farmland can be quite volatile. This is particularly true in the case of crop prices where recent price increases have boosted expected revenue several hundred dollars per acre for most Corn Belt farms. Had prices moved the other direction and investors felt that this was a more accurate representation of future income levels, it would be hard to make the economic case for significantly higher farmland values.
It is difficult to conclude at this time that current farmland market expectations regarding the economic fundamentals are misguided. Currently, one could make the case that average sale prices are reasonable and could even support higher prices; but one could also argue that, given the extreme price volatility in agricultural markets,moves to the downside are also quite likely.
For now, it appears that farmland values reflect investor’s beliefs that farm incomes will remain high and capitalization rates will remain low. Will these expectations materialize? In truth, it will be very difficult to determine whether these expectations are correct until hindsight provides the luxury of 20/20 vision. At this point, it appears that investors are at least considering market fundamentals before making purchase decisions. One situation to be concerned about is when investors must use arguments unrelated to market fundamentals to justify prices. Such factors typically involve debates over the magnitude of capital gains that landowners can expect, arguments that conservative collateral and lending standards need to be scrapped for higher loan-to-value ratio loans, development of new credit instruments with flexible repayment schemes or balloon payments to give more farmers a better “chance” to buy land, suggestions that if one doesn’t buy a farm today they’ll never be able to afford one, false hopes that farmland prices can’t go down because they aren’t making any more of it, or that inflation will always carry land values higher. If these discussions become common place, it is clearly time to assess whether the market has a sound view of realistic economic expectations. Let’s hope that time doesn’t come.
For More Information
Dobbins, C.L. and K. Cook. (2010, August). Indiana farmland values and cash rents: renewed strength in a weak economy. Purdue Agricultural Economics Report. Department of Agricultural Economics, Purdue University. West Lafayette, IN.
Gloy, B.A., C. Hurt, M.D. Boehlje, and C. Dobbins. (2011, March). Farmland values: current and future prospects. Center for Commercial Agriculture Staff Paper. Department of Agricultural Economics Purdue University. West Lafayette, IN.
Johnson, B. (2010, September 8). “A Thin Real-Estate Market Becomes Even Leaner.” Cornhusker Economics, University of Nebraska-Lincoln.
Purdue University Department of Agricultural Economics. (2010, November). 2011 Purdue crop cost and return guide, October 2010 estimates. ID-166-W, Purdue University Extension. Available at: https://ag.purdue.edu/commercialag/home/resource/keyword/crop-cost-return-guide-archive/
Brent A. Gloy (bgloy@purdue.edu) is Associate Professor, Michael D. Boehlje (boehljem@purdue.edu) is Distinguished Professor, Craig L. Dobbins (cdobbins@purdue.edu) is Professor, Christopher Hurt (hurtc@purdue.edu) is Professor, and Timothy G. Baker (baker@purdue.edu) is Professor. All are in the Department of Agricultural Economics, Purdue University, West Lafayette, Indiana.
TAGS:
TEAM LINKS:
RELATED RESOURCES
Margaret Lippsmeyer presented during agri benchmark’s 2024 annual conference in mid June, which was hosted by the Spanish Ministry of Agriculture in Valladolid, Spain. An increase in soybean acreage may come from either (a) shifting away from continuous corn rotations to corn-soy and (b) shifting corn-soy rotations toward corn-soy-soy. Based on agri benchmark data, Margaret showed that option (a) would require an increase in soybean prices of 6% and option (b) of 8% to make these rotations preferable over existing ones.
READ MOREUPCOMING EVENTS
We are taking a short break, but please plan to join us at one of our future programs that is a little farther in the future.


