February 26, 2015
Crop Insurance Guarantees
![]()
![]()
![]()
![]()
![]()
Crop insurance can be an effective tool to mitigate downside risk on crop farms. As with last year’s crops, in 2015 there are several crop insurance products to choose from in Indiana. A companion paper compared various crop insurance products. This paper provides an illustration of insurance guarantees and potential insurance payments for various yield and price scenarios.
Crop insurance guarantees and potential indemnity payments vary among crop insurance products. Table 1 illustrates potential indemnity payments for three products; yield protection (YP), risk protection with harvest price exclusion (RP-HPE), and risk protection (RP); under three price and yield scenarios for corn. These scenarios are used to illustrate the differences between the three insurance products. It is important to note that the scenarios depicted are less likely to occur than scenarios using average or expected price and yield, or prices and yields slightly below expected price and yield.
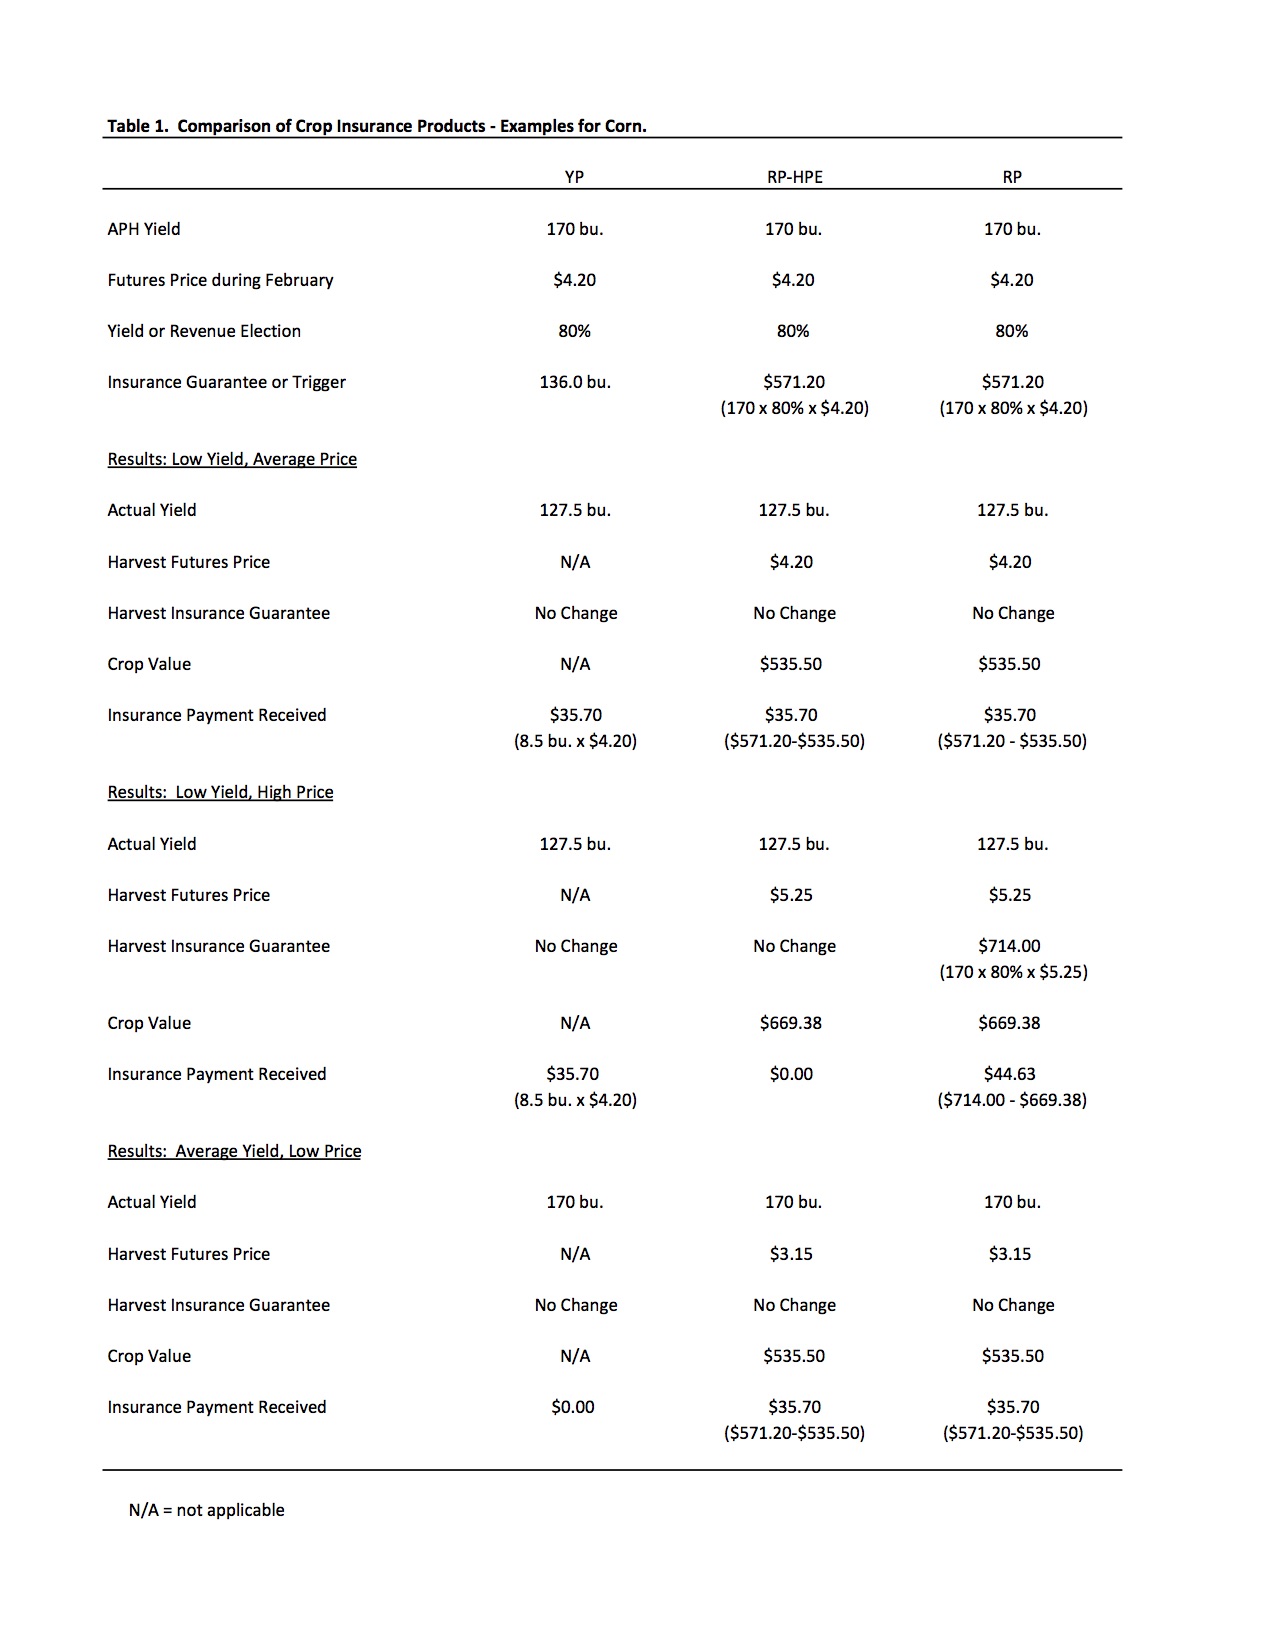
Table 1. Comparison of Crop Insurance Products – Examples for Corn.
The first section of Table 1 illustrates estimated projected price as the date of this article ($4.20), a coverage level of 80 percent, and the insurance guarantee or trigger for each product. A coverage level of 80 percent was used for the examples in Table 1. Coverage levels that are lower and higher could also be chosen by producers. The YP product has a yield guarantee of 136.0 bushels (170 x 0.80). The RP-HPE and RP products have a revenue guarantee of $571.20.
These revenue guarantees are computed by multiplying the APH yield by the projected price and 0.80 (i.e., the coverage level).
The first scenario depicted in Table 1 exhibits a low yield (25% below APH yield) and a harvest price (i.e., average price) of $4.20. Under this scenario, the insurance payment for each product would be $35.70. If the harvest price differed from the projected price, the payments for the RP-HPE and RP products would differ from the payment for the YP product. A contrived set of prices is used in this scenario to illustrate that all three products provide payments when yields are extremely low.
The second scenario in Table 1 depicts a situation with low yield and high price (25 percent above projected price). This scenario is similar to what occurred in 2012. Under this scenario, the insurance payments vary across the three products. The indemnity payment for the YP product is the same as it was in the first scenario. For this product, the change in price has no impact on the indemnity payment. Because of the price increase, the indemnity payment for the RP-HPE product is lower than the indemnity payment for the YP product. In contrast, the RP product indemnity payment is higher than the payment for the YP product. In essence, the RP product pays for the bushels lost using the greater of the projected and harvest prices. In this case, the harvest price is higher so this price is used to compute the indemnity payment.
The third scenario in Table 1 presents the results of an average yield and low price situation. If the U.S. corn crop is above trend yield in 2015, this scenario is more likely to play out than the previous two scenarios. In this scenario, the indemnity payment for the YP product is zero. The indemnity payments for the RP-HPE and RP products are $35.70 per acre.
In summary, this paper illustrated the guarantees and triggers for yield and revenue protection products. The Illinois farmdoc website (www.farmdoc.illinois.edu/cropins) contains tools that can be used to further evaluate guarantees, cost, and potential payouts for various crop insurance products.
![]()
![]()
![]()
![]()
![]()
TAGS:
TEAM LINKS:
RELATED RESOURCES
UPCOMING EVENTS
We are taking a short break, but please plan to join us at one of our future programs that is a little farther in the future.