August 3, 2023
Comparing Corn and Soybean Marketing Strategies
by Gloria Lenfestey and Michael Langemeier
![]()
![]()
![]()
![]()
![]()
While there have been numerous studies or articles that have evaluated grain marketing and crop insurance strategies separately, there is limited previous literature that examines these tools simultaneously. Previous articles have examined corn and soybean marketing strategies in isolation of one another (Lenfestey and Langemeier, 2023 a b). The purpose of this article is to identify which strategies contribute to an optimal portfolio of corn and soybean marketing strategies for a case farm in southeast Indiana using a downside risk model.
Crop Insurance and Marketing Strategies
Crop insurance products examined included revenue protection (RP) products, supplemental coverage option (SCO), and enhanced coverage options (ECO). Specifically, five crop insurance products were examined: 75% RP, 80% RP, 85% RP, 80% RP with SCO and 90% ECO, and 80% RP with SCO and 95% ECO. For ease of illustration and because it is a commonly used product in southeast Indiana, this article will focus on the results for the 80% RP product. The 80% RP product was combined with three cash price strategies, a basic storage hedge strategy, and a hedge and roll strategy. Cash strategies included a marketing year average cash price strategy (October through August), a harvest cash price strategy (October through December), and a 6-month cash price strategy (October through March). The harvest cash price and 6-month cash price strategies used equal marketing weights for the individual months. The marketing year cash price strategy utilized historical monthly marketing weights reported by USDA-NASS. The basic storage hedge strategy allows a producer to sell July futures in October, and then sell back July futures in May. With this strategy, the cash crop is also sold in May. The hedge and roll strategy is similar to the basic storage hedge strategy. The difference is that the producer starts an additional hedge earlier in the year. With this strategy, a producer sells November futures for soybeans and December futures for corn in June. In October, the producer would then buy back this futures contract, and sell July futures. In May, the producer would buy July futures and sell cash corn and soybeans. The marketing strategies are designated by abbreviations in the results discussed below: “mktg year” represents the marketing year cash price strategy, “harvest” represents the harvest cash price strategy, “6-month” represents the 6-month cash price strategy, “basic hedge” represents the basic storage hedge strategy, and “hedge and roll” represents the hedge and roll strategy.
Net return per acre was computed using crop yields obtained from an experimental field at the Southeast Purdue Agricultural Center, Indiana crop prices, futures prices, crop insurance indemnity payments computed using historical experimental field and county crop yields and historical projected and harvest crop insurance prices, government payments, and crop budget information for the 1992 to 2021 period. Crop insurance costs for the base year (i.e., 2022) were estimated for Jennings County, Indiana using the University of Illinois crop insurance tools. Historical crop insurance costs were estimated using cost indices created with historical costs per acre in the FINBIN database. A corn/soybean rotation was utilized. More information pertaining to revenue and costs can be found in Lenfestey (2023).
The hedge and roll strategy had the highest average net return per acre ($111.29 per acre). The net return per acre for the basic storage hedge was $78.99 per acre. Net returns for the marketing year cash price, harvest cash price, and 6-month cash price strategies were $99.86, $77.85, and $91.96 per acre, respectively. Downside risk models focus on the mitigation of low outcomes. In this study, downside risk was computed using annual net returns for each marketing strategy and a target income level of $95 per acre, which was the average crop net return during the study period. The hedge and roll strategy had the lowest downside risk level of any of the individual strategies. Downside risk for the other individual strategies was from 22 percent (6-month cash price strategy) to 38 percent (harvest cash price strategy) higher than that for the hedge and roll strategy. Interestingly, the correlations of net returns between strategies were lower for the corn hedge and roll strategy and the other corn and soybean strategies, with the exception of the hedge and roll soybean strategy, than they were for other combinations of strategies. This suggests that combining the corn hedge and roll strategy with other strategies will likely decrease downside risk.
Given the relatively attractive return and risk characteristics of the hedge and roll and marketing year cash price strategies, it would be interesting to contrast the annual net returns for both of these strategies. Figure 1 illustrates the difference in net returns between these two strategies. The difference in figure 1 was computed by subtracting the average net return for corn and soybeans using the marketing year cash price strategy from the average net return for corn and soybeans using the hedge and roll strategy. Thus, low deviations indicate a preference towards the marketing year cash price strategy and high deviations reveal a preference for the hedge and roll strategy. Obviously, there are some large differences in net returns in certain years. For example, the hedge and roll strategy performed very well in 2008; but had relatively low returns in 2010 and 2020.
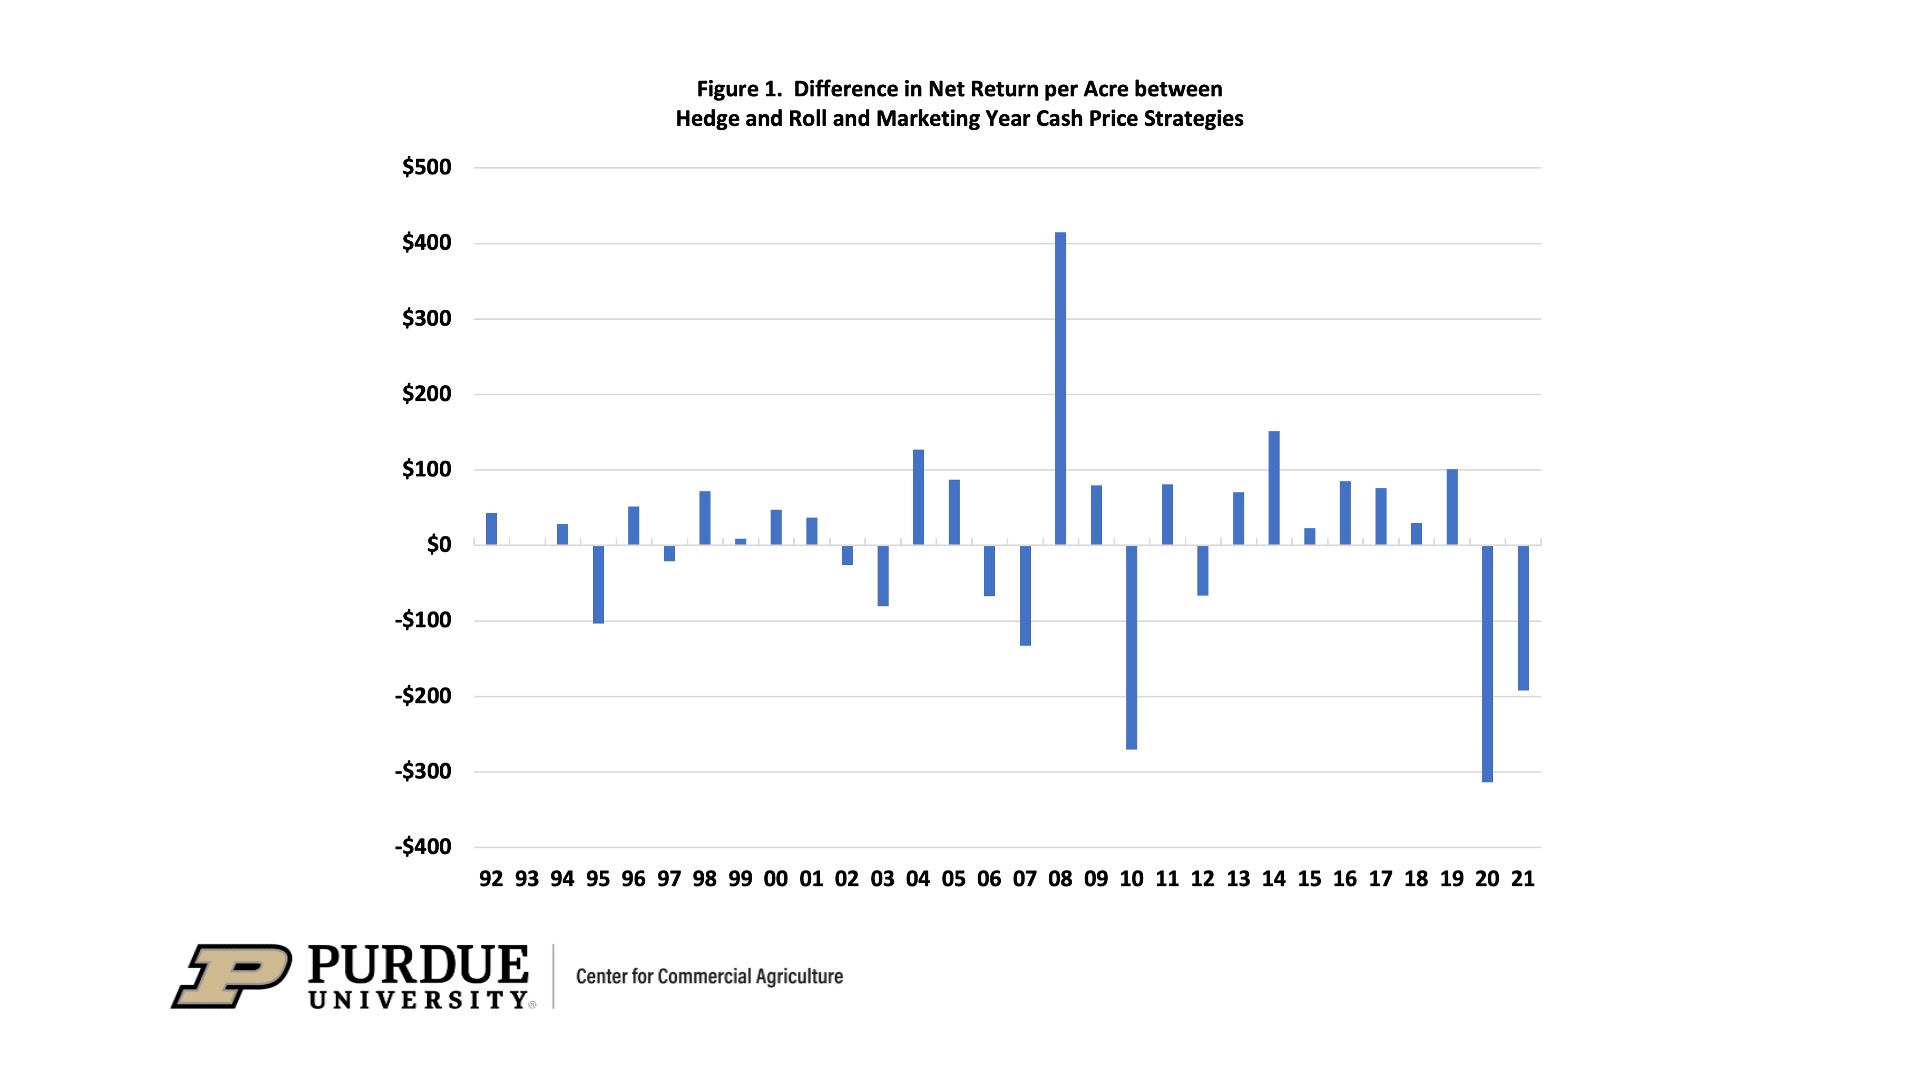
Figure 1. Difference in Net Return per Acre between
Hedge and Roll and Marketing Year Cash Price Strategies
Portfolio Results
The expected net return and negative deviations below the target income for the 80% revenue protection product are presented in table 1. The negative deviations in the table represent total negative deviations over the 30-year period. Annual deviations can be computed by dividing total negative deviations by 30. Scenario 1 represents the solution with the highest level of downside risk and the highest net return. The hedge and roll strategy for corn and soybeans was chosen for this scenario. Scenarios 2 through 4 were generated by reducing downside risk. As downside risk (total negative deviations below the target) is reduced, the expected net return also declines. However, the decline in net return is substantially smaller than the decline in downside risk. For example, for scenario 4, net return is only 0.9% lower ($1 per acre lower) than that for scenario 1, but downside risk is 8.1% lower. This illustrates the power of diversifying marketing strategies. The hedge and roll strategy for corn is chosen by all 4 scenarios depicted in table 1. However, as risk is reduced, the proportion chosen for the soybean and hedge and roll strategy diminishes. For scenario 4, the soybean hedge and roll strategy is not chosen. Rather, soybeans are marketed using a combination of the marketing year cash price strategy and the 6-month cash price strategy.
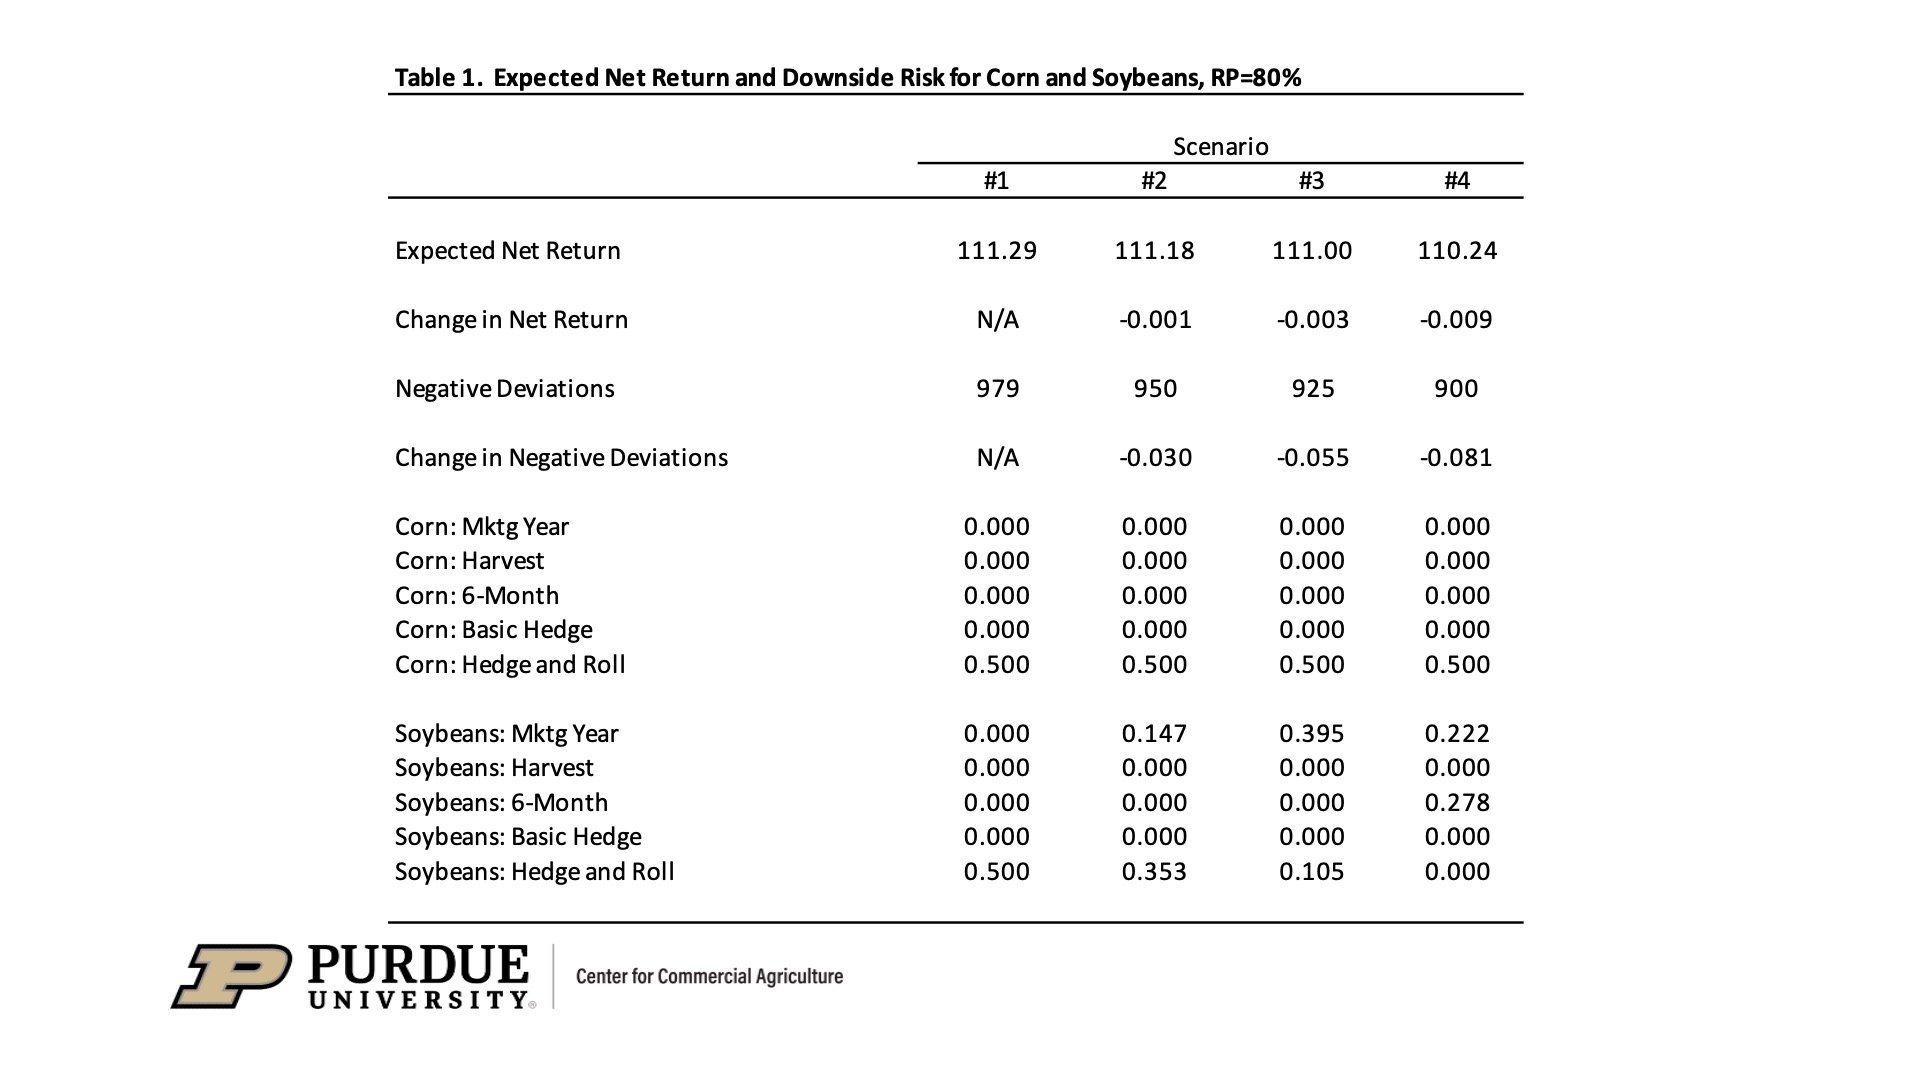
Table 1. Expected Net Return and Downside Risk for Corn and Soybeans, RP=80%
Scenarios a, b, c, d, and e in table 2 represent the expected net return and downside risk associated with choosing each individual marketing strategy. If a producer wanted to pick just one strategy for both crops, the hedge and roll strategy would clearly be chosen. However, the fact that the marketing strategies are not perfectly correlated (i.e., net returns do not move by the same magnitude and in the same direction), indicates that downside risk can be reduced through diversification of marketing strategies.
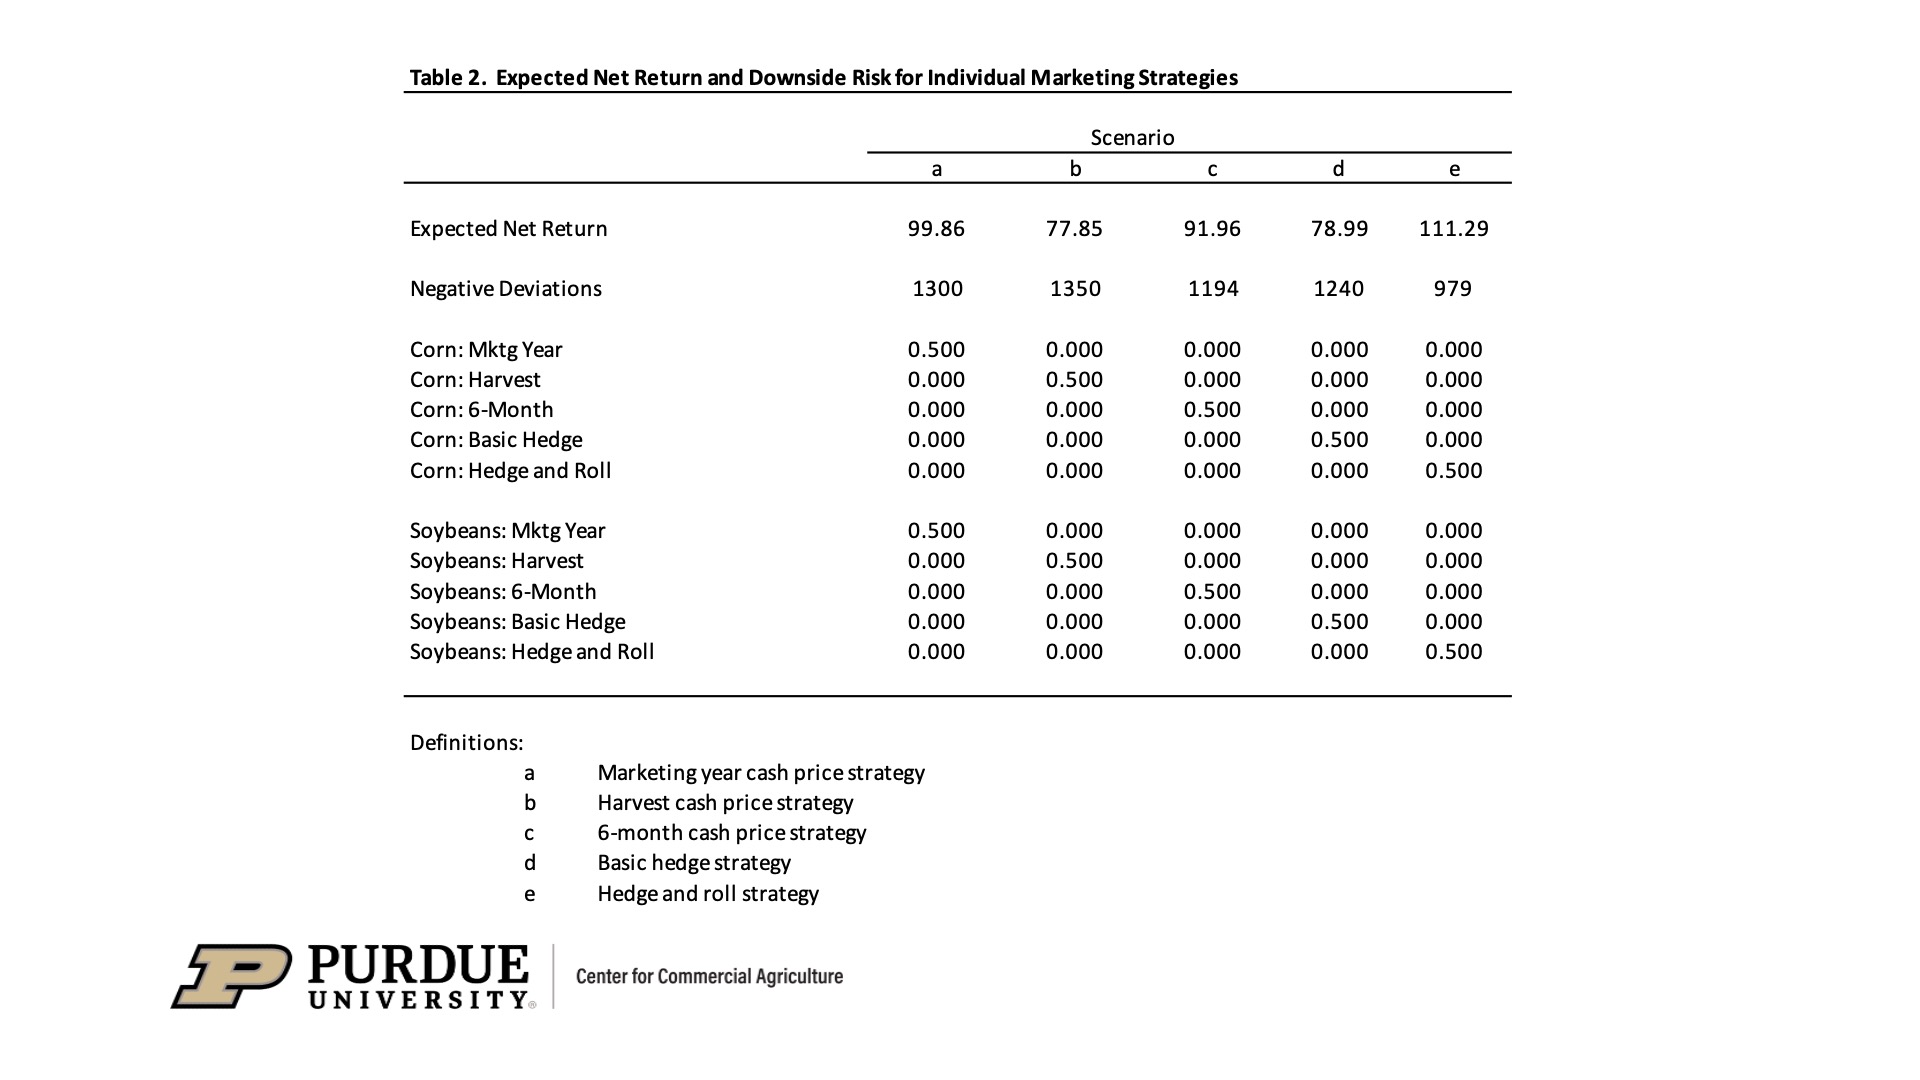
Table 2. Expected Net Return and Downside Risk for Individual Marketing Strategies
Conclusions
This article identified the optimal portfolio of corn and soybean marketing strategies for a case farm in southeast Indiana. The hedge and roll strategy had the highest net return per acre, and the lowest level of downside risk of any of the individual marketing strategies. However, downside risk can be reduced by diversifying marketing strategies. In particular, combining the hedge and roll strategy with the marketing year cash price strategy was effective in reducing downside risk and resulted in only a slight decline in net return per acre.
It is important to note that there are numerous assumptions that need to be considered when examining the results of this study. These assumptions relate to the years used to the analysis, relationship between the crop yields for the case farm and the county it resides in (Jennings County, Indiana), the cost structure of the case farm, and marketing strategies used in this study.
Citation
Center for Farm Financial Management, University of Minnesota, FINBIN web site, accessed June 22, 2022.
Lenfestey, G. “A Portfolio Approach to Grain Marketing and Crop Insurance Strategies for an Indiana Case Farm.” Unpublished M.S. thesis, Department of Agricultural Economics, Purdue University, forthcoming.
Lenfestey, G. and M. Langemeier. “Comparing Corn Marketing Strategies.” Center for Commercial Agriculture, Purdue University, July 20, 2023.
Lenfestey, G. and M. Langemeier. “Comparing Soybean Marketing Strategies.” Center for Commercial Agriculture, Purdue University, July 31, 2023.
USDA-NASS, Agricultural Prices, various issues.
![]()
![]()
![]()
![]()
![]()
TAGS:
TEAM LINKS:


RELATED RESOURCES
UPCOMING EVENTS
We are taking a short break, but please plan to join us at one of our future programs that is a little farther in the future.