August 31, 2015
Agricultural Productivity Growth and Regulation
![]()
![]()
![]()
![]()
![]()
Abstract
Though regulations on U.S. agriculture undergo serious scrutiny by academic agricultural economists prior to their implementation, very little attention is paid in the literature to the systemic effects of United States Department of Agriculture (USDA) and Environmental Protection Agency (EPA) regulation on the performance of the agricultural sector as a whole. This paper uses measures of regulation from the Mercatus Center at George Mason University and the Weidenbaum Center at Washington University at St. Louis to examine the impact of regulation by these agencies on state-level agricultural productivity. The Mercatus Center data measures restrictive language in the Code of Federal Regulations while the Weidenbaum Center data measures regulation as spending in dollars on regulatory activity. We find statistically and economically significant negative effects of regulation on state-level farm productivity.
Introduction
Agricultural policy has made up a significant proportion of American political discussions since at least the New Deal era. The New Deal was the progenitor of modern farm programs which are designed to support agricultural producers in times of hardship. Regulations on the production practices of farmers have a similarly long history. Laws such as the Federal Insecticide, Fungicide, and Rodenticide Act have been in place for many decades and have empowered the EPA with significant control over the day-to-day operations of agricultural producers.
Much of the public policy research conducted in agricultural economics focuses on USDA policies designed to support production agriculture or to reduce the negative impacts of modern agriculture on the environment. In the former case, policies such as crop insurance (Kropp and Katchova, 2011), direct payments to producers (Weber and Key, 2012), and disaster relief payment programs (Ubilava, Barnett, Coble, and Harri, 2011) are evaluated for their effects on farm decision making behavior. In the latter case, the economics of various best management practices and their implementation are evaluated in terms of their environmental impact and effects on farm profitability (Smith, Leatherman, Peterson, Crespi, and Roe 2012). These research efforts are certainly useful in increasing our understanding of the effects of specific regulations stemming from agricultural and environmental policies.
An aspect of government policy that is difficult to study in agricultural economics is the effect of regulation in general on farm performance. Two large departments of the federal government, the United States Department of Agriculture (USDA) and the Environmental Protection Agency (EPA), are responsible for the majority of federal regulatory activities in agriculture. While a specific regulatory proposal can certainly be examined for its impact on productivity, profits or environmental outcomes, and, indeed is reviewed under benefit-cost analyses including a period of public commentary on the proposal, more often the complaints of farmers, stakeholders, and politicians concern the general perception on all “regulation.” Broadly defined, this regulatory impact pertains to a perception that the cumulative impacts of regulatory policies lead to substantial inefficiencies. Like a patient receiving numerous treatments for varied ills, the overall impact of all of the treatments on the patient’s health ought to provoke a physician to step back and look at the whole patient rather than examining some ceteris paribus impact from a single dosage. Examining the cumulative impact of regulation is exceedingly difficult, but in order to understand the complaints of the “patient” ought to be attempted.
The USDA has three primary agencies that make up the bulk of its regulatory spending: the Animal and Plant Health Inspection Service (APHIS), the Food Safety Inspection Service (FSIS), and the Agricultural Marketing Service (AMS). These regulatory agencies focus almost exclusively on animal and plant health, biotechnology, invasive species issues, food safety and inspection, food recall data collection, food defense, country of origin labeling, and intellectual property for plant varieties.
The EPA oversees 12 major regulatory acts directly impacting agricultural producers including the Clean Air Act; the Clean Water Act; the Federal Insecticide, Fungicide, and Rodenticide Act; and the Food Quality Protection Act. The EPA website includes a compliance assistance tool entitled “Major Existing EPA Laws and Programs That Could Affect Agricultural Producers” designed to assist producers in their effort to comply with regulatory and voluntary programs. All regulations necessarily impact the day-to-day operations of a farm because they restrict the range of technologies available to farmers to deal with pests and soil fertility issues. The degree to which these restrictions affect the performance of the agricultural industry is an important question for policymakers and regulators to balance against the concerns of consumers and other stakeholders.
One way to evaluate the impact of regulation on agriculture is to determine its impact on farm performance. As mentioned at the outset, there have been works examining specific regulations, but little work on the cumulative impact of agricultural regulations. A seminal piece by Lichtenberg and Zilberman (1986) considered the conflicting welfare impacts that would arise when regulatory policies “furthering social goals such as environmental quality and equitable income distribution often reduce productivity” (p. 1135). They formulated a theoretical model that also took into account the role of agricultural price supports and, via an empirical extension that included ad hoc simulations of supply shifts due to regulatory impacts, examined the competing welfare impacts. This paper and others citing it spawned a literature on the incidence of specific agricultural policies that is perhaps best summarized by Alston and James (2002). What neither Lichtenberg and Zilberman nor the literature noted in the Alston and James chapter shows is any research attempting to use a variable(s) to proxy the cumulative amount of regulation–more generally defined– facing producers.
A few studies have been performed in non-agricultural industries to examine general regulatory impacts, however. Crain and Crain (2010) examine the incidence of regulatory costs on U.S. businesses. The authors find that small businesses (those with fewer than 20 employees) face annual regulatory costs of $10,585 per employee. Medium-sized businesses (20 to 499 employees) face costs of $7,454 per employee per year. Though Crain and Crain do not explicitly examine agriculture, most farms and agribusinesses in the U.S. fall into one of these size categories.
Regulatory burdens can have an impact on productivity and output at the macro level as well. Dawson and Seater (2013) use page counts from the Code of Federal Regulations as a measure of regulation to examine regulatory impacts on total factor productivity and GDP in the U.S. They find statistically significant negative impacts on both productivity and output and are able to explain the productivity slowdown in the U.S. in the 1970s. They conclude that GDP in 2011 would be $53.9 trillion instead of $15.1 trillion if regulation had remained at 1949 levels. The authors note that this dramatic effect is consistent with, albeit smaller in magnitude than, other studies of the effects of regulation.
Other research on regulation focuses on effects of regulation across countries. An example of this type of work is a paper by Holcombe and Boudreaux (2015). Data from the Economic Freedom of the World Index (Gwartney, Lawson, and Hall; 2014) are used to examine the impact of the level of regulation in a country on the level of corruption in the country’s government. Holcombe and Lawson find that regulation has a statistically significant and positive impact on corruption.
The objective of this paper is to examine the general impacts of USDA and EPA regulation on farm performance in the U.S. Anecdotal accounts of regulation harming individual agricultural businesses by producers or politicians are not sufficient to determine the effects of regulation on the industry as a whole and specific policy benefit-cost analyses lack the aggregate perspective of cumulative impacts. Following the literature on regulatory impacts cited above, we employ state-level revenue and expense data from USDA’s Economic Research Service (ERS) database as well as two proxies for USDA and EPA regulation. The analysis is conducted in two stages. We calculate total factor productivity and then regress it on measures of regulation and a measure of farm stabilization policy.
This paper adds to the agricultural policy literature in three important ways. First, we provide an examination of two different, quantifiable measures of agricultural regulation that can be used by future researchers and policy makers. Second, using these measures we document changes in agricultural regulation over the 1997-2012 time period. Third, we determine whether and to what extent regulation, broadly defined, has affected productivity in agriculture for the first time.
We are fully aware of the limitations of our analysis, and so offer this caveat and justification. While this paper examines the effect of regulation on productivity in agriculture, because our regulatory variables are so broadly defined, we are not able to determine the origins of or justifications for the regulations we examine. That is, we cannot provide evidence that distinguishes between a theory that implies that regulation is intended to improve social welfare (Pigou 1938) nor regulatory capture, in which regulated firms are able to gain an advantage over other firms by controlling the regulatory agency (Stigler 1971). Further, we cannot evaluate the net effect of USDA and EPA regulations on society in general since our data are limited to a single industry. But these goals while worthy are not our objective. Such analyses are best left to the specific benefit-cost analyses of specific policy proposals. What we are able to do here is provide needed quantitative context to a term, namely, “agricultural regulation” that is discussed with great import but with loose definition from coffee shops to Congress. Without some framework for examining regulation, then the term really defies definition and can mean anything and, as such, renders any serious policy discussion of regulatory impacts meaningless.
Data
State-level value added data are taken from the USDA-ERS database. The data include revenue for crops, livestock, and other agricultural operations (including forestry) and expenses (seed, fertilizer, pesticides, feed, purchased livestock, labor, repairs, electricity, fuel, electricity, and depreciation). All data are adjusted for inflation to 2009 constant dollars. Summary statistics of all data used in the estimation are found in Table 1. These data are used to calculate productivity.
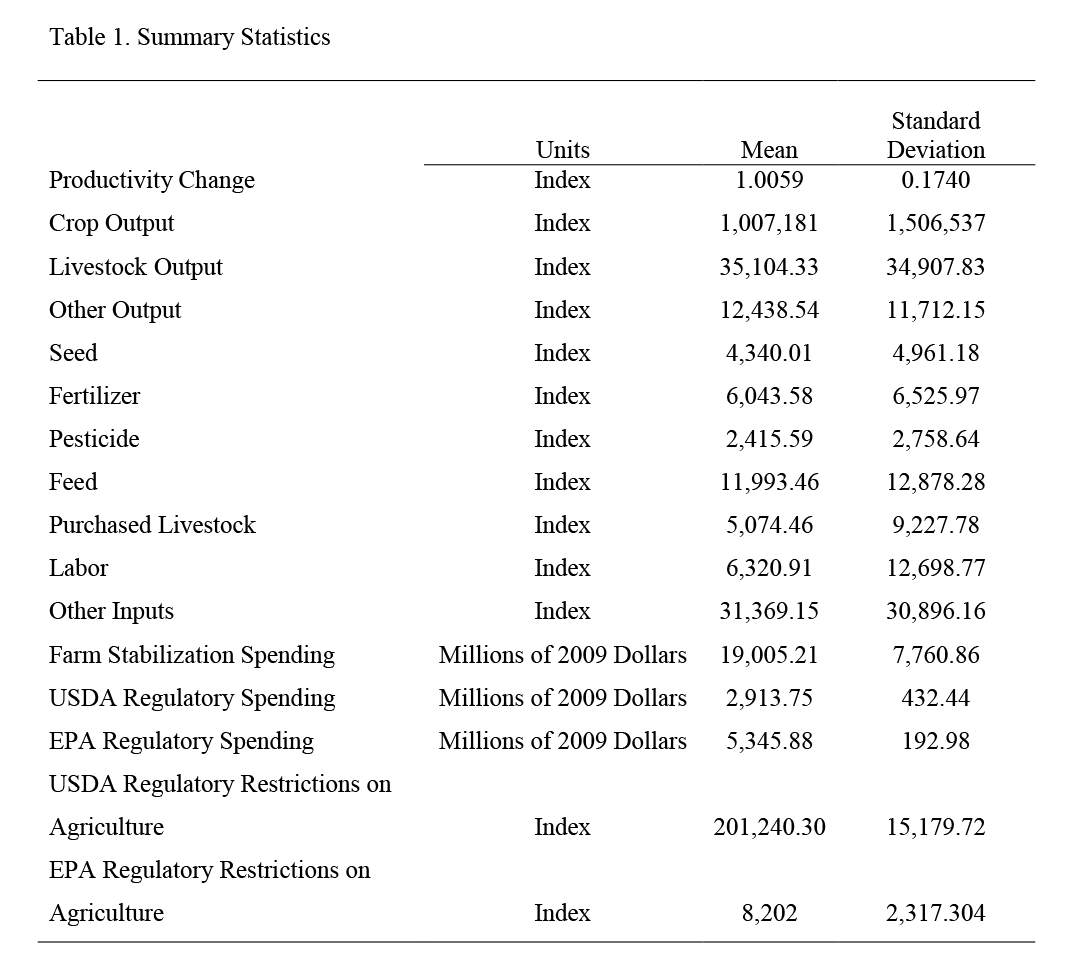
Table 1. Summary Statistics
Zhengfei and Lansink (2006) use two measures of firm performance, return on equity and productivity growth, to examine the costs of the use of leverage. Since we do not have access to balance sheet data, we use only productivity as a measure of farm performance. The productivity growth index calculation is discussed in the model section below.
Price data are taken from the USDA-NASS database. These data include annual price indices for corn, feeder calves, seed, fertilizer, chemicals, feed, wages, and the consumer price index. Calculation of productivity growth indices requires input/output data so we generate input and output indices by dividing each expense item (seed, fertilizer, pesticides, feed, purchased livestock, labor, other inputs) and revenue item (crops, livestock, other ag outputs) by their respective input price indices (seed, fertilizer, chemicals, feed, wages, consumer price index) and output price indices (corn, feeder calves, consumer price index). The choices of price indices are straightforward, with a few exceptions. Corn is the major driving force of crops commodity markets, so corn is chosen as a price index for all crops. A satisfactory price index for other agricultural outputs and inputs was not found in the USDA National Agricultural Statistics Service (NASS) database, so we used a general indicator of the price level to generate output and input indices for these variables.
Lichtenberg and Zilberman (1986) examined the offsetting impacts of regulation and farm stabilization in their theoretical model. Since the USDA oversees both farm stabilization policy and farm regulation, it is necessary to account for farm stabilization spending in the regressions. Farm stabilization spending data were taken from the White House Office of Management and Budget and adjusted for inflation. These data will be used to account for changes in government policy over time that are designed explicitly to benefit farmers.
The first proxy of regulation is provided by the Weidenbaum Center at Washington University in St. Louis (we will refer to these series as the WC-indices). This dataset includes inflation-adjusted regulatory spending by agency from 1997 to 2012 for the USDA and EPA. A plot of the data (Figure 1) shows that USDA spending on regulatory activities is generally increasing over the period at a decreasing rate. EPA spending is more volatile and fell dramatically during the 2008 recession. It is important to note that these data measure total spending by agency and do not provide information about regulation on specific industries. This is unlikely to be an issue for USDA regulation since the agency is charged with supporting and regulating agriculture, not other industries. However, the EPA regulates a wide range of industries including automotive, construction, electric utilities, oil and gas extraction, transportation, retail trade, healthcare, manufacturing, mining, and other industries. As such our measure of EPA regulatory spending at best proxies EPA regulatory spending related specifically to agriculture.
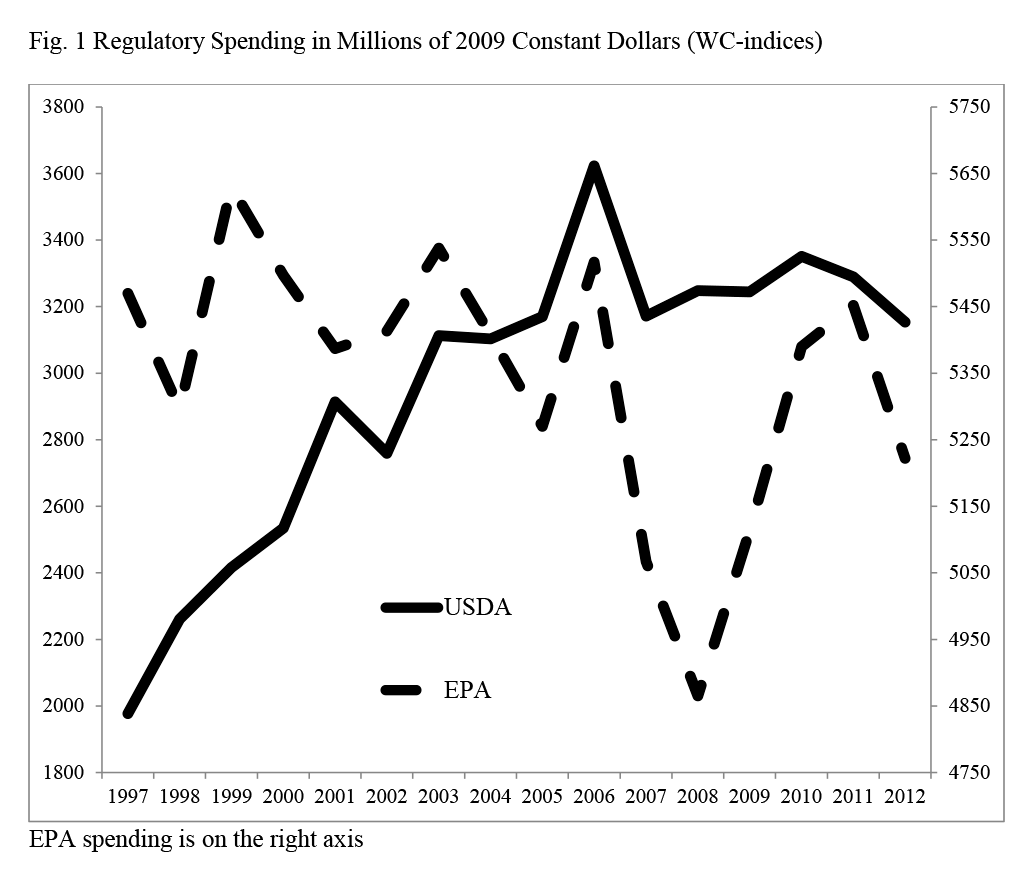
Figure 1. Regulatory Spending in Millions of 2009 Constant Dollars (WC-indices)
Another potential issue with the regulatory spending is that agency budgets are affected by other things than the amount of restrictions they place on business activity. Changes in labor and overhead costs may impact total regulatory spending by an agency even if the degree to which that agency restricts behavior in an industry is constant. Alternatively, changes in regulatory responsibilities by a given agency may change the level of regulation, but an increase in spending may be delayed due to issues with federal employee layoffs. Finally, a recession may reduce the government’s budget. While this may affect enforcement in the short run, it does not impact the number of regulations being enforced.
Inflation-adjusted spending on USDA regulation grows an average of 3.46% per year. Nine of the 15 growth rates are positive and the greatest year over year increase is 15% from 2000 to 2001. Inflation-adjusted EPA regulatory spending actually declines over the period with an annual decline of -0.22%. Seven of the 15 growth rates are negative with the largest decline from 2006 to 2007 of -8.16%.
The second proxy of regulation is taken from the RegData database at the Mercatus Center at George Mason University (we will refer to these series as the MC-indices). This database is generated by counting the number of restrictive words such as “must,” “shall,” or “required” in the Code of Federal Regulations. The word counts are transformed into regulatory indices that measure regulation by agency by industry. The regulatory restriction data have two significant advantages over other measures such as page counts in the Federal Register or annual budgets. First, since the regulatory index is based on the number of restrictions, there is likely to be less noise from other factors such as changes in bureaucratic costs or recession (a problem for spending measures) or changes in extraneous legislative language (a problem for page count measures). Second, the ability to determine the level of regulation on a specific industry by a given agency reduces the potential for noise from changes in that agency’s regulation on other industries.
A plot of both regulatory restriction indices (Figure 2) shows that USDA regulation declined from 1999 through 2004 and then increased substantially using this measure starting in 2005. EPA regulation declined slightly from 1997 to 2000 and increased thereafter. It is important to note that the method used to calculate these indices does not allow for a comparison of levels of regulation across industries or agencies. However, comparisons of percentage changes are appropriate.
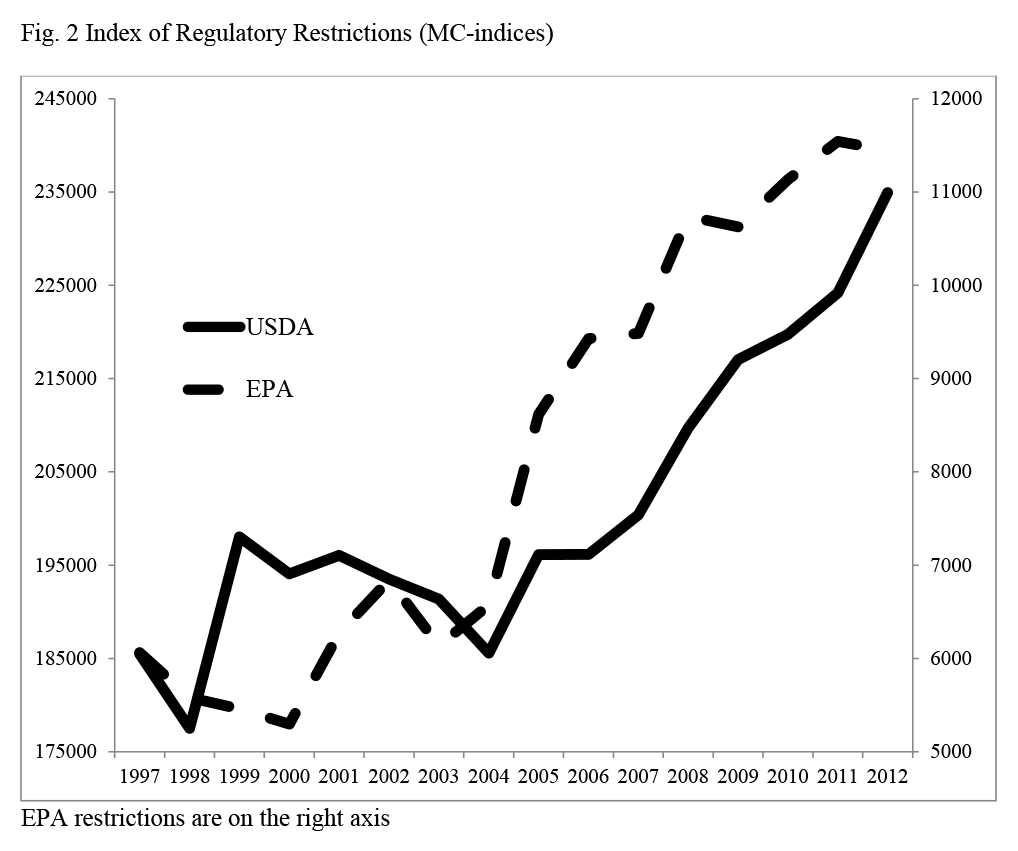
Figure 2. Index of Regulatory Restrictions (MC-indices)
The average annual growth rate of USDA regulatory restrictions is 1.66%. Two thirds of these growth rates are positive and the largest increase in regulation is 11.57% from 1998 to 1999. EPA regulatory restrictions on agriculture grew much faster over the period. The average growth rate of EPA restrictions is 4.8% per year with 9 of the 15 growth rates being positive. The largest annual increase is 31% from 2004 to 2005.
It is clear that the two proxies for regulation have significantly different characteristics over the observed period. Thus we expect that the results of the two models will differ. The regulatory restriction data are likely a better measure of regulation having fewer sources of noise than regulatory spending data. However, regulatory spending has been used in other studies of regulatory impacts (Sinclair and Vesey 2012; Beard et al. 2011). This paper serves as a comparison of the two types of proxies though we provide no statistical test of the accuracy of the two measures other than comparisons of model fit and marginal effects.
Model
As noted above, we examine the effects of regulation on agricultural productivity growth. We use the Malmquist productivity growth index specified by Färe et al. (1994):
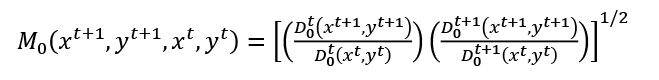
where ? is a vector of input indices, and ? is a vector of output indices. ?0?(??, ??) is a firm’s period ? output-oriented distance function measured relative to the same-period’s technology. This applies to ?0?+1(??+1, ??+1) as well. Similarly ?0?(??+1, ??+1) and ?0?+1(??, ??) are output- oriented distance functions measured relative to the period ? and period ? + 1 technologies, respectively. The Malmquist index is a nonparametric measure of input-output relationships. An index value of 1 indicates no productivity growth, a value greater than 1 indicates positive productivity growth, and a value less than 1 indicates a decline in productivity.
In the second step, we model agricultural productivity as a function of regulation and farm stabilization spending. It is necessary to control for farm stabilization spending since the USDA oversees both stabilization and regulatory functions. Without controlling for farm stabilization spending, estimated effects of USDA regulation on firm performance may be biased. To allow for direct comparisons of the effects of regulation on firm performance across regulation and performance measures, all variables are transformed using natural logs. The model is specified by the following equation:
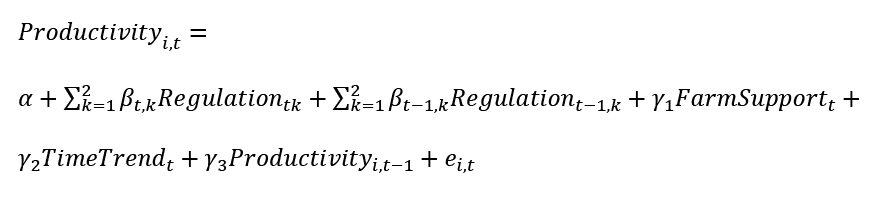
where Productivity?? is a measure of state-level farm performance, Regulationtk is a measure of regulation of agriculture, FarmSupport? is farm stabilization spending, TimeTrend? is a time trend to account for the effects of unobserved variables on productivity that are constant across states, and Productivity??−1 is a lag of productivity. Subscripts denote observations for state ? in year ? and source of regulation ?. A lag of regulation is added to determine if performance in a given period is affected by the level of regulation in the previous period. The error term ??? is assumed to be a random disturbance centered around zero.
Tests for state fixed effects were not statistically significantly different from zero, but tests for the time trend variable were statistically significant. Since productivity growth is a time- period measure, autocorrelation is a possible issue. Specifically, a high productivity growth rate in one period is likely to leave less potential for high productivity growth in the next period. After conducting a Wooldridge test for autocorrelation on both models, we find statistically significant evidence of autocorrelation. We also find evidence of heteroskedasticity in both models. Since both autocorrelation and heteroskedasticity are present, we use block bootstrapped standard errors. This method is superior to other methods of correcting for autocorrelation and heteroskedasticity in panel data (Bertrand et al. 2004).
We expect that USDA regulation will have a negative but small effect on state-level farm productivity growth. This is because many of USDA’s regulations are primarily designed to constrain the activity of firms down the supply chain from the farm. If these firms are able to pass some of the regulatory compliance costs upstream to farms, this would be observed as a negative impact of USDA regulation on farm performance. Another possible source of regulatory costs to farms from the USDA is compliance with conservation requirements. Since 1995, farmers have been required to have a conservation plan for their operation to receive program payments. Further, any part of a farmer’s land deemed a “wetland” area by the Natural Resources Conservation Service must be taken out of production.
EPA regulation, on the other hand, may very well have a larger negative effect on farm productivity growth as the EPA directly regulates production agriculture. Environmental issues associated with production agriculture regulated by the EPA include air and water quality, soil erosion, pesticide use and handling, personnel safety, and other issues. To the degree that regulatory restrictions placed on producers associated with these issues impose costs, we should observe a negative impact of EPA regulation on farm productivity growth.
Results
As expected, we find that USDA and EPA regulation generally have a negative impact on productivity growth. However, the effects differ across regulatory measures (Table 2).

Table 2. Regression Results: Determinants of Agricultural Productivity Growth from 1997 to 2012
From the regression coefficients presented in Table 2, we calculate the long run effects of each regulation using the following equation:
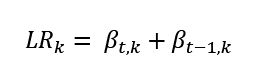
where all variables and subscripts are defined as above. The long run effect of regulation accounts for both the lagged and contemporaneous effects and allows for comparison of regulatory effects across agencies. For example, regulation by one agency may affect performance only contemporaneously while regulation by another agency may have both a lagged and contemporaneous effect on performance. If a marginal effect is not statistically different from zero, we omit it from the calculation in equation 4.
Model 1 estimates the effect of USDA and EPA regulation on productivity growth using regulatory spending (WC indices) as the measure of regulation. USDA regulation has negative and statistically significant contemporaneous and lagged effects on productivity growth. The long run effect of a 1% increase in USDA regulation is a -0.465% decline in productivity growth. In the case of EPA regulation, the contemporaneous effect is negative and economically significant. The lagged effect is positive, statistically significant, and slightly greater in magnitude than the negative contemporaneous effect. Thus the long-run effect of EPA regulation on productivity growth in this model is positive and very small (0.005%).
The most interesting aspect of this elasticity is its sign. Regulation designed to internalize externalities and thus benefit society as a whole would likely impose costs on firms, driving down productivity growth. On the other hand, Stigler’s theory of regulatory capture comports with the findings. If farm lobbying organizations are able to influence USDA and EPA regulators, they may be able to increase productivity growth. The more likely scenario, however, is that the correlations are spurious. Since regulatory spending is affected by other factors than the intensity of the restrictions on the regulated industry, it is relatively noisy.
Model 2 estimates the effect of USDA and EPA regulation on productivity growth using regulatory restrictions (MC indices) as the measure of regulation. The small positive contemporaneous effect of USDA regulation is more than offset by a lagged negative effect. Both effects are statistically significant and negative in sign. The long run effect is a -1.005% decline in productivity growth for a 1% increase in USDA regulation. EPA restrictions also have both a lagged and contemporaneous effect on productivity growth. The long-run effect indicates that a 1% increase in EPA regulation results in a -0.529% decline in productivity growth. The results contradict our expectation that marginal impacts of USDA regulation would be smaller than those of EPA regulation. However, the total effect over the 1997-2012 time frame could be larger for EPA regulation than for USDA regulation.
One interesting finding is that the marginal effects of farm stabilization are statistically significant and consistent in sign for both models. What is interesting is the negative correlation. The marginal effects of farm stabilization are -0.072% and -0.068% for Models 1 and 2, respectively. More discussion is clearly warranted.
We believe there are three plausible explanations for this negative relationship. The first explanation is simply that the variables are picking up a negative trend that is not captured by the linear trend variable itself. Indeed the trend variable, with its consistent positive signs, may be “pulling out” the underlying stabilization impact. Adjusting for other nonlinear trends seemed to have no impact on the sign of the stability coefficients, however. A second possibility is proffered by Pasour and Rucker (2005) who argue that, since the 1960s, environmental interests have captured agricultural policy such that programs ostensibly designed to support producers actually do the opposite. We are not ready to make this claim without much more analysis as many of the farm support programs are in some sense voluntary and producers could walk away from them if they really harmed them. The political power of Midwestern senators having as many votes as senators from more populous states also calls into question why farmers would not be able to lobby to change “farm support” that hurts their bottom line. A third, and we believe more plausible explanation is that our farm support variable is not measuring farm support so much as measuring farms in need of support. The negative sign is consistent with the following account: when productivity growth is high (low) in production agriculture, farm stabilization spending declines (increases). This is consistent with an actuarial gain (loss) on crop insurance for the Risk Management Agency when yields are high (low). The fact that these effects are likewise very inelastic suggests that farm stabilization spending over the time period of the study only adjusted slightly. This is consistent with the direct payment structure of farm policy during the period. For this reason, we feel that the negative sign on these variables as constructed is actually consistent with farming reality.
Using model 2, we calculate the total effect of regulation (measured by the MC-indices) on productivity growth. The long-run marginal effects of regulation on productivity compounded over the period of the study suggest that the total effect of regulation on agriculture is dramatic. The total effect of USDA regulation is a reduction of productivity growth of -24.76%, suggesting that productivity growth in agriculture would have been 24.76% higher in 2012 if regulation had remained at 1997 levels. A similar calculation for the effects of EPA regulation indicates that productivity growth would have been 36.82% higher in 2012 if regulation had remained at 1997 levels. These effects are the result of average annual growth in USDA and EPA regulation of 1.67% and 4.81%, respectively. These findings are consistent with our expectation that regulation by the EPA has a larger impact on agricultural productivity growth than the USDA.
As indicated in the data section, there are several potential problems with the use of regulatory spending as a measure of regulation. It is likely to be noisy since spending is a function of other factors unrelated to legal restrictions on managerial behavior. A problem specific to this paper is that regulatory spending data are general and do not indicate the level of spending used in the regulation of specific industries. An increase in regulatory spending by the EPA on mining may have little effect on its regulation of agriculture. USDA regulation is not likely to be as dramatically affected by this issue. Regulatory restriction data has advantages over regulatory spending as a measure of regulation in that it is not subject to as many sources of noise and is specific to each industry.
Two recent papers examining the effect of regulation on the macro-economy inform the discussion further. Sinclair and Wesey (2012) measure regulation with regulatory spending data and find no statistically significant impact of regulation on GDP or employment. Dawson and Seater (2013) use the number of (standardized) pages in the Code of Federal Regulations to measure the effect of regulation on GDP and total factor productivity growth. Though this measure of regulation is not the same as the regulatory restriction measure we use, it is similar. The authors find statistically significant and large negative effects of regulation on both GDP and total factor productivity. The authors indicate that this finding is consistent (though smaller in magnitude) with other cross-country and panel data studies. Given the likely problems with noise and the available empirical evidence, regulatory restrictions are likely to be a better measure of regulation than regulatory spending.
This is not to suggest that measures of regulatory spending are not valuable for the study of regulation. In situations where regulations have measurable benefits, regulatory spending is a key part of determining the cost. If regulation has a negative effect on the macro-economy, regulatory spending data can inform policymakers as they conduct regulatory reform.
Conclusion
This paper examines the effect of USDA and EPA regulation on state-level farm productivity growth from 1997 to 2012. The degree to which each agency regulated the agricultural sector was measured by total regulatory spending for each agency and by an index of regulatory restrictions in the Code of Federal Regulations. The data used to calculate productivity growth include state-level revenue and expenses data on crops, livestock, forestry, and other agricultural outputs taken from the USDA-ARMS database.
Effects of regulation are found to differ across measures of regulation. When regulation is measured by regulatory spending, USDA regulation has a negative effect on productivity growth whereas EPA regulation positively impacts productivity growth. When regulatory restrictions are used to measure regulation, USDA and EPA regulations have a statistically significant and negative effect on productivity growth.
Given the conflicting estimates of marginal effects of regulation, we discuss the advantages and disadvantages of the measures of regulation. Regulatory spending data are likely to be a poorer measure of regulation than regulatory restrictions due to possible issues of noise and a lack of industry specificity. Potential noise issues include changes in overhead and labor costs, budgetary restrictions, and recession. Consistently negative and statistically significant effects of regulation at the micro level found in the literature suggest that regulatory restrictions are a better measure of regulation (Dawson and Seater 2013).
Productivity growth is a good measure of farm sector performance because it ignores the effect of prices and is likely a better representation of managerial ability than other measures such as profitability or return on equity. Evidence from Zhengfei and Lansink (2006) indicates that productivity growth is a better measure of farm performance when examining the effects of policy. Using the MC-indices, we find cumulative reductions in productivity growth over the 1997-2012 period of -24.76% and -36.82% due to growth in USDA and EPA regulation, respectively. It is important to note that these are reductions in the growth rate of productivity, not its level.
We also examine the effects of farm stabilization policy on productivity growth. In each model, the effect of farm stabilization policy is negative and statistically significant. We believe that this is a case of reverse causality. When farm performance is low (high), farm stabilization policy adjusts upward (downward). This is likely capturing the effect of crop insurance.
Further work examining the effects of regulation on farm performance is needed to determine the distributional impacts of regulation. Agriculture is likely to remain a politically important industry and is likely to continue to face regulatory pressure at the federal and state levels. Our regulatory data came from two institutes who focus on the measure of regulation. More such variables are needed and more studies utilizing regulation broadly defined are necessary before we can even begin to have a debate about the impact of regulation on agriculture. Future research needs to examine other issues as well. Interaction effects of farm size, farm type, producer experience, and other factors on regulatory impacts can be examined using firm-level data and will provide insights into these distributional impacts. Effects of political factors such as the majority party in congress and agricultural sector lobbying on the intensity of agricultural regulation are also valuable extensions of this research. Though the effects of regulation are often discussed anecdotally, applied research in this area is needed in order to improve our understanding of agricultural policy dynamics. Clearly there is room for more research, but until we come to terms with how to measure agricultural regulation and how to incorporate such measures into our research, little progress can be made either in economics or in politics. Our hope is this paper takes some needed first steps.
References
Alston, J. M., & James, J. S. (2002). The Incidence of Agricultural Policy. In B. L. Gardner, & G. C. Rausser (Eds.), Handbook of Agricultural Economics (Vol. 2, pp. 1689-1749). North-Holland.
Al-Ubaydli, O., & McLaughlin, P. A. (January 2015). RegData: A Numerical Database on Industry-Specific Regulations for All US Industries and Federal Regulations, 1997- 2012.”. Arlington, VA: Mercatus Center at George Mason University.
Beard, T. R., Ford, G. S., Kim, H., & Spiwak, L. J. (2011, April). Regulatory Expenditures, Economic Growth and Jobs: An Empirical Study. Phoenix Center Policy Bulletin.
Bertrand, M., Duflo, E., & Mullainathan, S. (2004). How Much Should We Trust Differences-in- Differences Estimates? The Quarterly Journal of Economics, 119(1), 249-275.
Crain, N. V., & Crain, W. M. (2010). The Impact of Regualtory Costs on Small Firms. Small Business Association Office of Advocacy.
Dawson, J. W., & Seater, J. J. (2013). Federal Regualtion and Aggregate Economic Growth. Journal of Economic Growth, 18(2), 137-177.
Fare, R., Grosskopf, S., Norris, M., & Zhang, Z. (1994). Productivity Growth, Technical Progress, and Efficiency Change in Industrialized Countries”. American Economic Review, 84, 66-83.
Gwartney, J., Lawson, R., & Hall, J. (2014). Economic freedom of teh world 2014 annual report. Vancouver, BC: Fraser Institute.
Holcombe, R. G., & Boudreaux, C. J. (2015). Regulation and Corruption. Public Choice, 164(1- 2), 75-85.
Kropp, J. D., & Katchova, A. L. (2011). The Effects of Direct Payments on Liquidity and Repayment Capacity of Beginning Farmers. Agricultural Finance Review, 71, 347-365.
Lichtenberg, E., & Zilberman, D. (1986). The Welfare Economics of Price Supports in U.S. Agriculture. The American Economic Review, 76, 1135-1141.
Pasour Jr., E. C., & Rucker, R. R. (2005). Plowshares and Pork Barrels: The Political Economy of Agriculture. Oakland, CA: Independent Institute.
Pigou, A. C. (1938). The Economics of Welfare (4 ed.). London: Macmillan and Co.
Sinclair, T. M., & Vesey, K. (2012). Regulation, Jobs, and Economic Growth: An Empirical Analysis. Working Paper.
Smith, C. M., Leatherman, J. C., Peterson, J. M., Crespi, J. M., & Roe, J. D. (2012). BMPs For
Sale! – Implications from a Case Study in BMP Auctions. The Journal of Regional
Analysis and Policy, 42, 151-161.
Stigler, G. J. (1971). The Theory of Economic Regulation. Bell Journal of Economics and
Mangaement Science, 2, 3-21.
Ubilava, D., Barnett, B. J., Coble, K. H., & Harri, A. (2011). The SURE Program and Its Interaction with Other Federal Farm Programs. Journal of Agricultural and Resource Economics, 36(3), 630-648.
United States Department of Agriculture Economic Research Service. (n.d.). Farm Income and Wealth Statistics. Retrieved November 2014, from http://www.ers.usda.gov/data- products/farm-income-and-wealth-statistics/value-added-years-by-state.aspx#.VNqP- PnF91A
United States Environmental Protection Agency. Agiculture Laws. Retrieved December 2014, from http://www.epa.gov/agriculture/llaw.html
Weber, J. G., & Key, N. (2011). How Much Do Decoupled Payments Affect Production? An Instrumental Variable Approach with Panel Data. American Journal of Agricultural Economics, 94(1), 52-66.
Weidenbaum Center, Washington University and the George Washington University Regulatory Studies Center. (2015). Regulators Budget: Agency Level Data Sheets.
Zhengfei, G., & Oude Lansink, A. (2006). The Source of Productivity Growth in Dutch Agriculture: A Perspective from Finance. American Journal of Agricultural Economics, 88(3), 644-656.
![]()
![]()
![]()
![]()
![]()
TAGS:
TEAM LINKS:
RELATED RESOURCES
UPCOMING EVENTS
We are taking a short break, but please plan to join us at one of our future programs that is a little farther in the future.