May 1, 2016
Feed Cost Indices for a Dairy Cow Enterprise
![]()
![]()
![]()
![]()
![]()
This article discusses recent trends in feed costs for a dairy cow enterprise. A ration consisting of alfalfa, corn silage, corn, soybean meal, and supplements was used to create the feed cost indices. Corn prices represent averages for Indiana as reported by USDA-NASS. Alfalfa prices represent averages for the United States as reported by USDA-NASS. Corn prices were used to estimate corn silage prices. Soybean meal prices were obtained from Feed Outlook, published monthly by USDA-ERS. Information from Agricultural Prices, a monthly USDANASS publication, was used to compute supplement prices. Future prices for corn and soybean meal were used to project feed indices through 2017.
Figures 1 and 2 report monthly corn and alfalfa prices from January 2000 to March 2016. A distinction is made for prices before and after 2007. The period starting in 2007 is often thought to be a new price regime. Corn price averaged $2.18 from 2000 to 2006, and $4.84 from 2007 to the current month. Alfalfa price averaged $98 from 2000 to 2006, and $165 from 2007 to the current month. Note that corn and alfalfa prices are currently below their average prices since 2007.

Figure 1. Monthly Indiana Corn Prices, 2000 to 2016
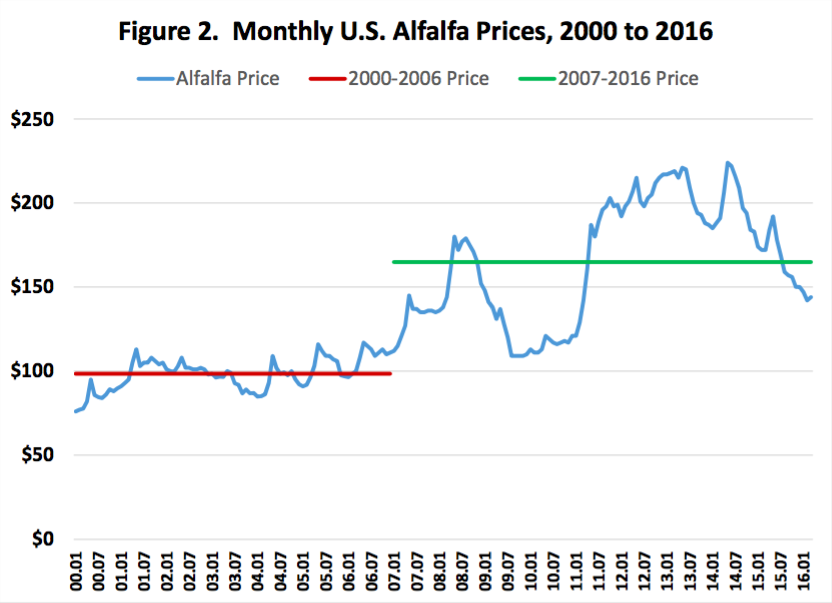
Figure 2. Monthly U.S. Alfalfa Prices, 2000 to 2016

Figure 3. Monthly Dairy Feed Cost Indices, 2000 to 2016
Annual dairy feed cost indices are presented in Figure 4. The projections for 2016 and 2017 (red bars) used corn and soybean meal futures prices in early May, and long-run forage price projections. The projected feed cost indices for 2016 and 2017 are 95 and 97, respectively.
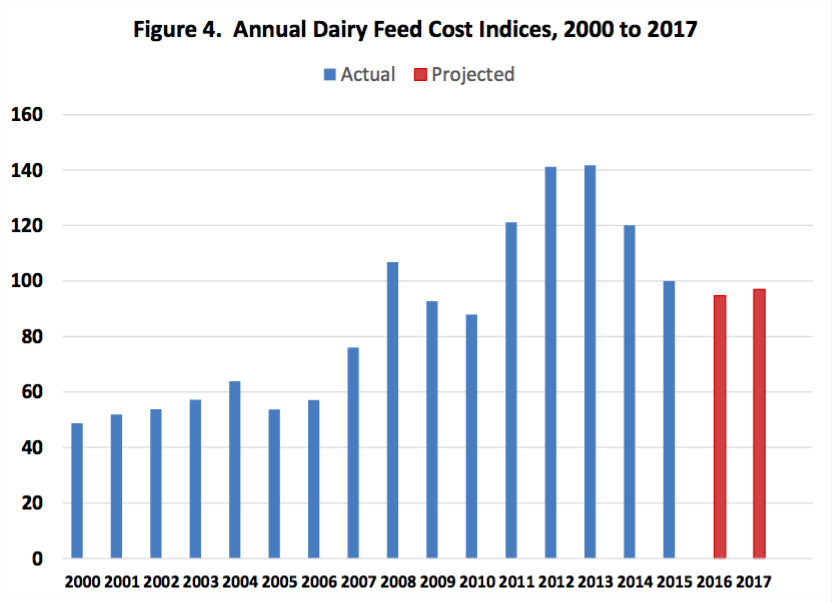
Figure 4. Annual Dairy Feed Cost Indices, 2000 to 2017
Figure 5 presents annual dairy feed cost and milk price per cwt. since 2000. Historical milk prices for Indiana are obtained from USDA-NASS. Milk price projections are recent estimates reported by the Livestock Marketing Information Center. The projected milk price for 2016, if realized, would be the lowest annual price since 2009. The actual margin represents the average margin for the 2000-2015 period while the projected margin represents the average expected margin for 2016 and 2017. The projected margin over feed cost, particularly for 2016, is relatively weak compared to the historical average.
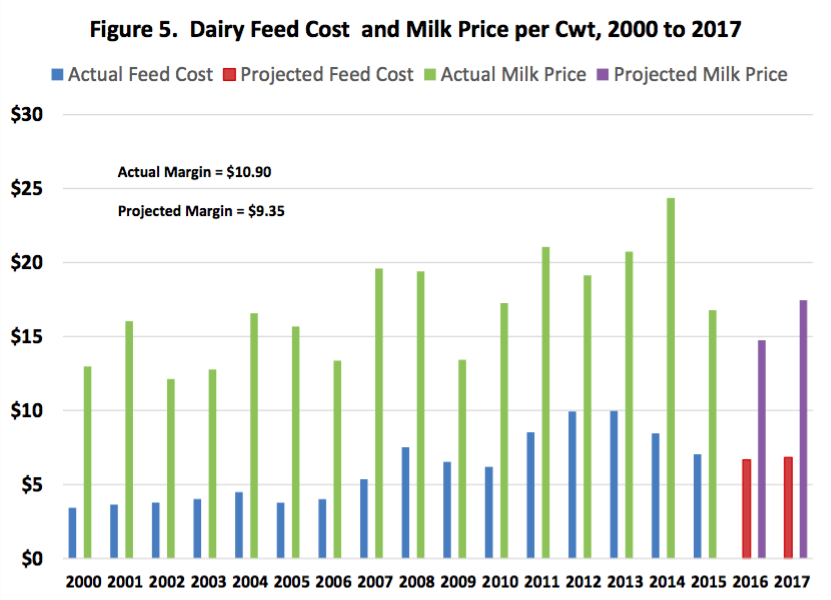
Figure 5. Dairy Feed Cost and Milk Prices per Cwt, 2000 to 2017
Conclusion
This article discussed recent trends in feed costs for a dairy cow enterprise. Feed costs have dropped substantially since early 2014. Current projections suggest that feed costs will remain slightly below or similar to the average for 2015 through the end of 2016. Information related to feed costs for other livestock species can be found on the web site for the Center for Commercial Agriculture.
![]()
![]()
![]()
![]()
![]()
TAGS:
TEAM LINKS:
RELATED RESOURCES
UPCOMING EVENTS
We are taking a short break, but please plan to join us at one of our future programs that is a little farther in the future.