June 26, 2020
Explaining Fluctuations in DDG Prices
by Michael Langemeier
![]()
![]()
![]()
![]()
![]()
Distiller’s dried grains (DDGs) are a co-product of dry-milled ethanol production. U.S. ethanol plants have the capacity to produce more than 14 billion gallons of ethanol and 41 million tons of DDG (Ag MRC). DDGs from corn contain, on average, 30 percent protein, 10 percent fat, and 7 percent fiber. Approximately 17 pounds of DDGs (10 percent moisture content) are produced from one bushel of corn. Because their protein content is higher than that of corn, DDGs can be substituted for corn and soybean meal in livestock diets. More information pertaining to the substitution of DDG for corn and soybean meal in the U.S. can be found in Hoffman and Baker (2011).
Given the substitutability of DDGs for corn and soybean meal; we would expect DDG prices to be significantly related to these feedstuffs. To help explain fluctuations in DDG prices, this article examines the relationship between DDG prices, and corn and soybean meal prices. Price data used below were obtained from monthly issues of Feed Outlook, which reports DDG, corn, and soybean meal prices for central Illinois.
Variability of DDG Prices and Other Feedstuffs
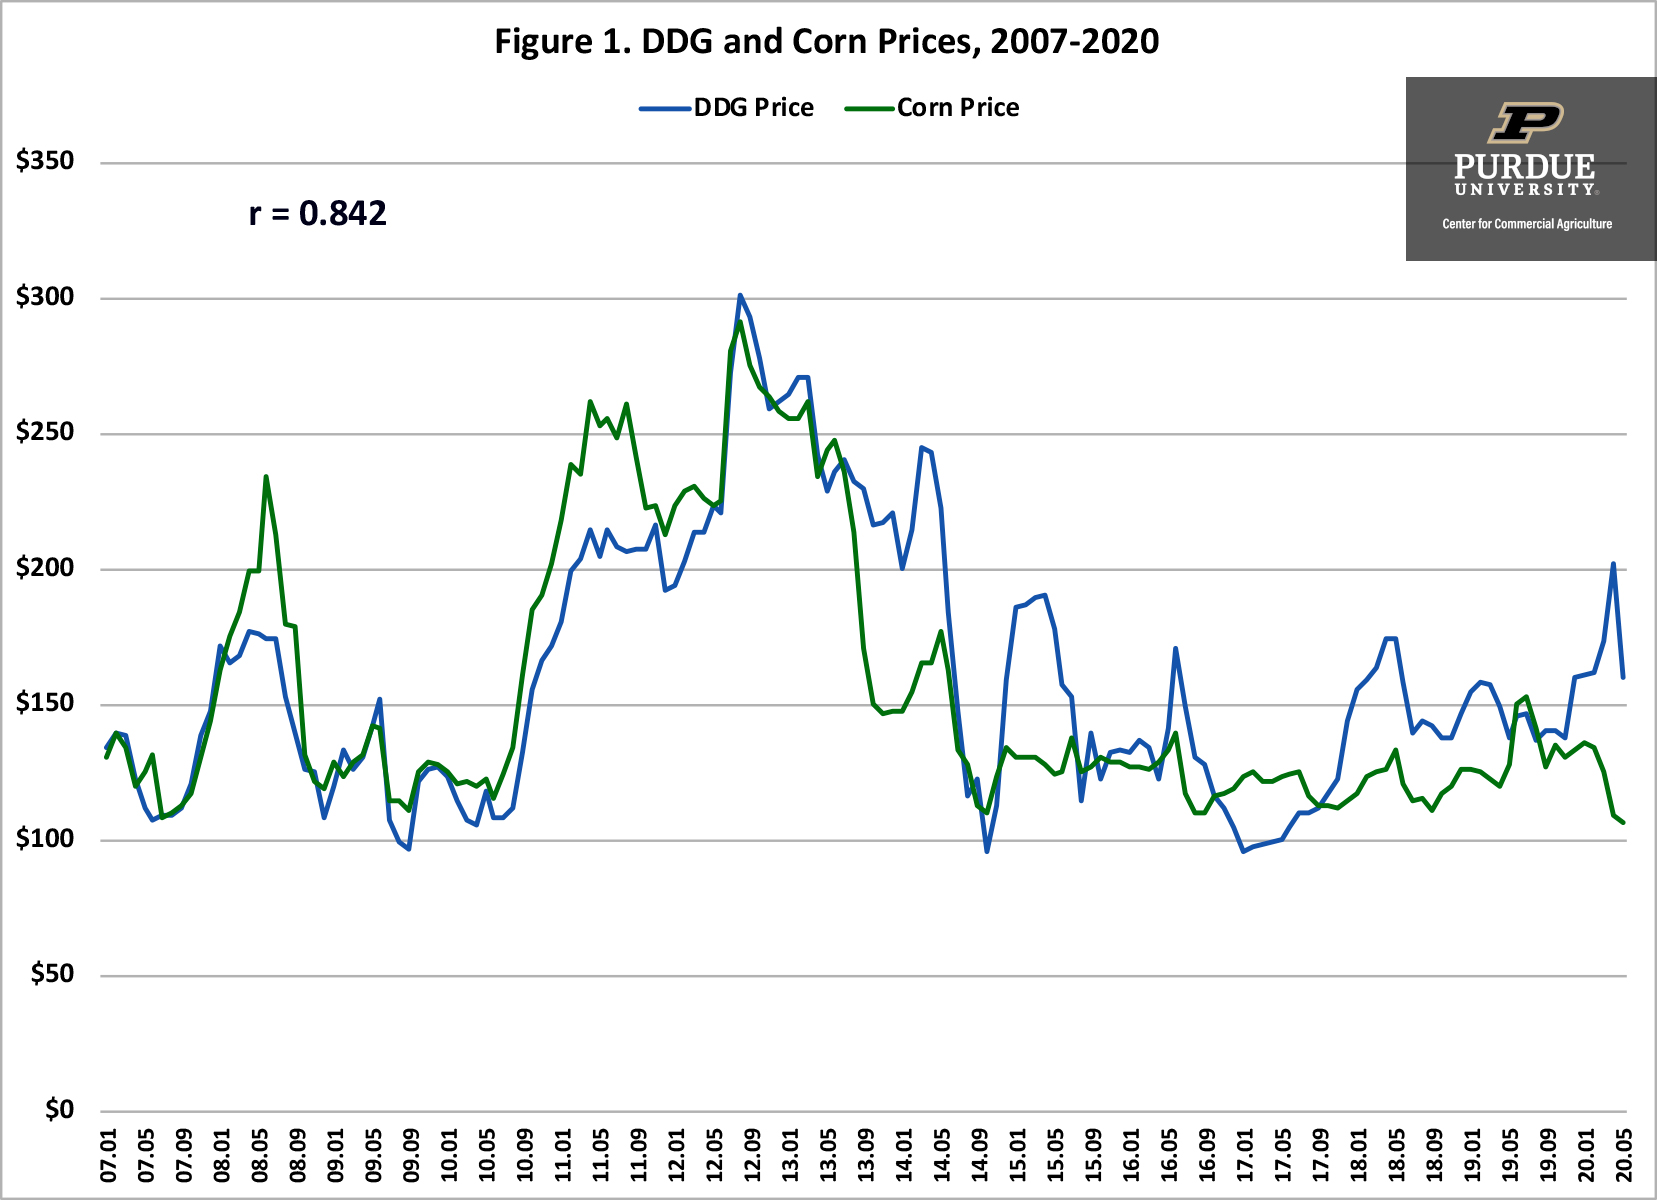
Figure 1 depicts monthly DDG and corn prices from January 2007 to May 2020. The average DDG and corn prices over this period were $161 per ton and $157 per ton, respectively. These two price series are highly correlated (r = 0.842). DDG and corn prices tend to move in the same direction. However, there are times when the two prices diverge. For example, from January 2017 to May 2017, corn prices were from $23 to $27 per ton higher than DDG prices. Due to capacity utilization issues in the ethanol industry, which had a detrimental impact on the supply of DDGs, corn prices were from $49 to $93 per ton lower than DDG prices in March, April, and May of 2020.
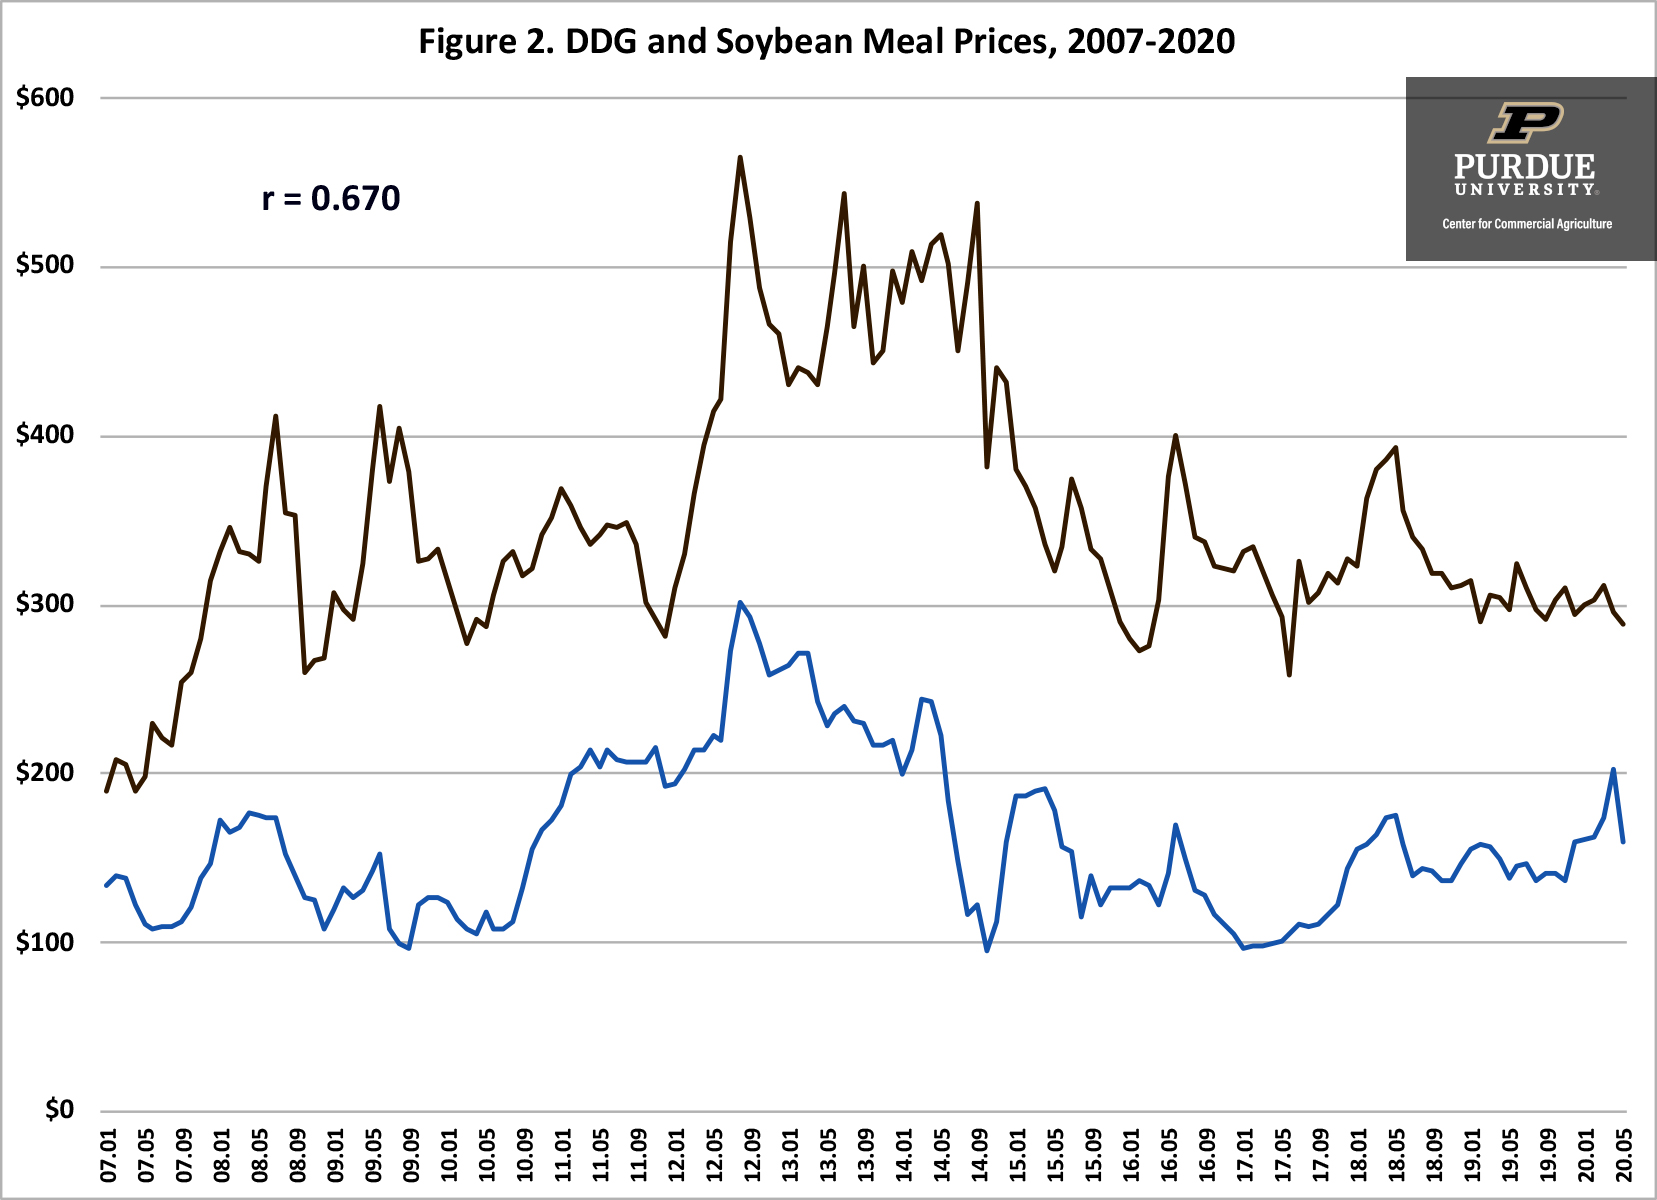
Monthly DDG and soybean meal prices are illustrated in figure 2. Average DDG and soybean meal prices over the period were $161 per ton and $351 per ton, respectively. On average, soybean meal prices were 129 percent higher than DDG prices. These two price series are highly correlated (r = 0.670). However, the correlation is lower than that for DDG prices and corn prices. The difference between soybean meal and DDG prices ranged from 35 percent in November 2011 to 338 percent in September 2014.
Factors Impacting DDG Prices
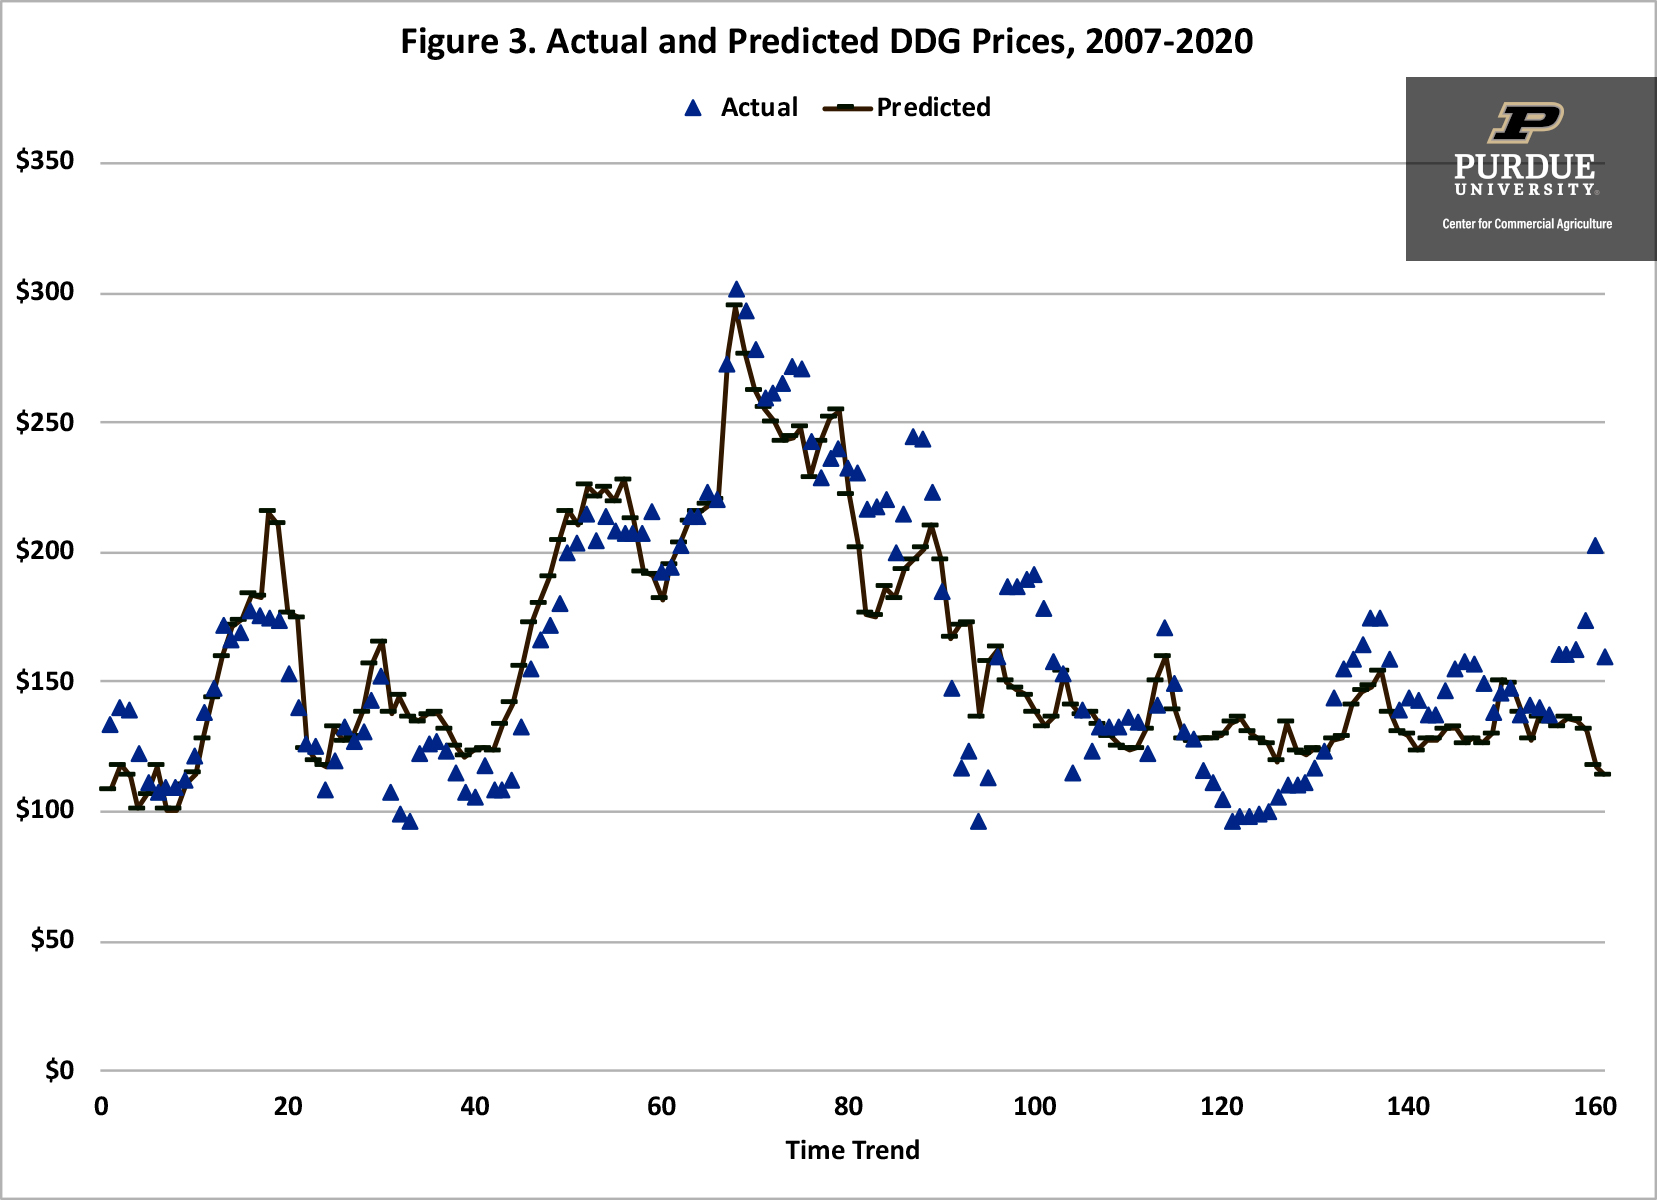
From the information above, it is evident that DDG prices are sensitive to changes in corn and soybean meal prices. Regression analysis using data from January 2007 to December 2019 for central Illinois was used to examine the relationship between these variables. Results are as follows: each $0.10 per bushel ($3.57 per ton) increase in corn price results in a $2.33 per ton increase in DDG prices, and each $10 per ton increase in soybean meal prices results in a $2.18 increase in DDG prices. Though both corn prices and soybean meal prices are significantly related to DDG prices, these two prices only explained approximately 80 percent of the variability in DDG prices. Figure 3 presents the actual and predicted DDG prices. There are times when the predicted DDG prices are either substantially below or above actual DDG prices, revealing the difficulty associated with predicting DDG prices with just corn price and soybean price information. In particular, predicted DDG prices have been substantially below actual levels since March of this year. As ethanol plants start producing at levels closer to capacity, actual prices are expected to more closely match predicted prices. Using projected corn and soybean prices for the remainder of this year, DDG prices are projected to range from $110 to $120 per ton during the second half of this year.
Summary and Conclusions
DDGs are an important feedstuff in the U.S. DDGs often substitute for both corn and soybean meal in livestock rations. Because DDG prices are not as readily available as corn and soybean meal prices, it can be difficult to gauge the impact of DDG prices on projected feed costs. This article examined fluctuations in DDG prices during the last ten years, and related movement in DDG prices to movements in corn and soybean meal prices. DDG prices were significantly correlated with corn prices and soybean meal prices.
References
Agriculture Marketing Resource Center, www.agmrc.org, accessed June 25, 2020.
“Feed Outlook,” United Department of Agriculture, Economic Research Service, various issues.
Hoffman, L.A. and A. Baker. “Estimating the Substitution of Distillers’ Grains for Corn and Soybean Meal in the U.S. Feed Complex.” FDS-11-I-01, United States Department of Agriculture, Economic Research Service, October 2011.
![]()
![]()
![]()
![]()
![]()
TAGS:
TEAM LINKS:

RELATED RESOURCES
UPCOMING EVENTS
We are taking a short break, but please plan to join us at one of our future programs that is a little farther in the future.