October 6, 2020
Operating Profit Margin Benchmarks
by Michael Langemeier and Elizabeth Yeager
![]()
![]()
![]()
![]()
![]()
This article examines trends in the operating profit margin for a sample of farms over a ten-year period and develops financial performance benchmarks. Specifically, using KFMA whole-farm data for farms with continuous data from 2010 to 2019, the operating profit margin ratio is computed for each farm and year. Also, the operating profit margin ratio and corresponding farm characteristics are compared across financial performance quartiles.
Variable Definitions and Summary Statistics
The operating profit margin ratio was computed by adding interest expense and subtracting unpaid family and operator labor from net farm income and dividing the result by value of farm production. In addition to the operating profit margin, other variables compared across profit margin quartiles included value of farm production, net farm income, interest, unpaid family and operator labor, total assets, total debt, total expense ratio, adjusted total expense ratio, economic total expense ratio, asset turnover ratio, debt to asset ratio, percent of farms with positive cash flow, percent of farms financially stressed, percent of farms with expense ratios below 1.00, and percent of farms in four value of farm production categories (i.e., less than $250,000 in value of farm production; value of farm production between $250,000 and $500,000; value of farm production between $500,000 and $1,000,000; and value of farm production greater than $1,000,000). The total expense ratio was computed by summing cash costs, accrual adjustments to costs, and depreciation, and dividing the result by value of farm production. The adjusted total expense ratio was computed by adding unpaid family and operator labor to the expenses included in the total expense ratio and dividing by value of farm production. An adjusted total expense ratio below 1.00 indicates that a farm was able to cover accrual expenses, depreciation, and unpaid family and operator labor. The economic total expense ratio was computed by adding the opportunity cost on net worth to the expenses in the adjusted total expense ratio and dividing by value of farm production. If the economic total expense ratio was below 1.00, the farm or group of farms was covering all accrual and opportunity expenses, and was earning an economic profit. A farm was considered financially stressed if it had an adjusted total expense ratio above 1.00 and had a debt to asset ratio above 0.70.

Table 1. Summary Statistics for 437 KFMA Farms with Continuous Data from 2010-2019.
Table 1 presents the summary statistics for the 437 KFMA farms with continuous data from 2010 to 2019. Value of farm production averaged $651,546 and net farm income averaged $127,473. The average profit margin was 0.113 or 11.3 percent while the average asset turnover ratio was 0.234. The average total expense ratio, adjusted total expense ratio, and economic total expense ratio were 0.804, 0.919, and 1.099, respectively. As indicated by the percent of farms with an adjusted total expense ratio below 1.00, approximately 64 percent of the farms covered accrual expenses, depreciation, and unpaid family and operator labor. Approximately 12 percent of the farms covered all accrual and opportunity costs and thus were earning an economic profit. Approximately 1.6 percent of the farms were, on average, financially stressed.
Profit Margin Quartiles
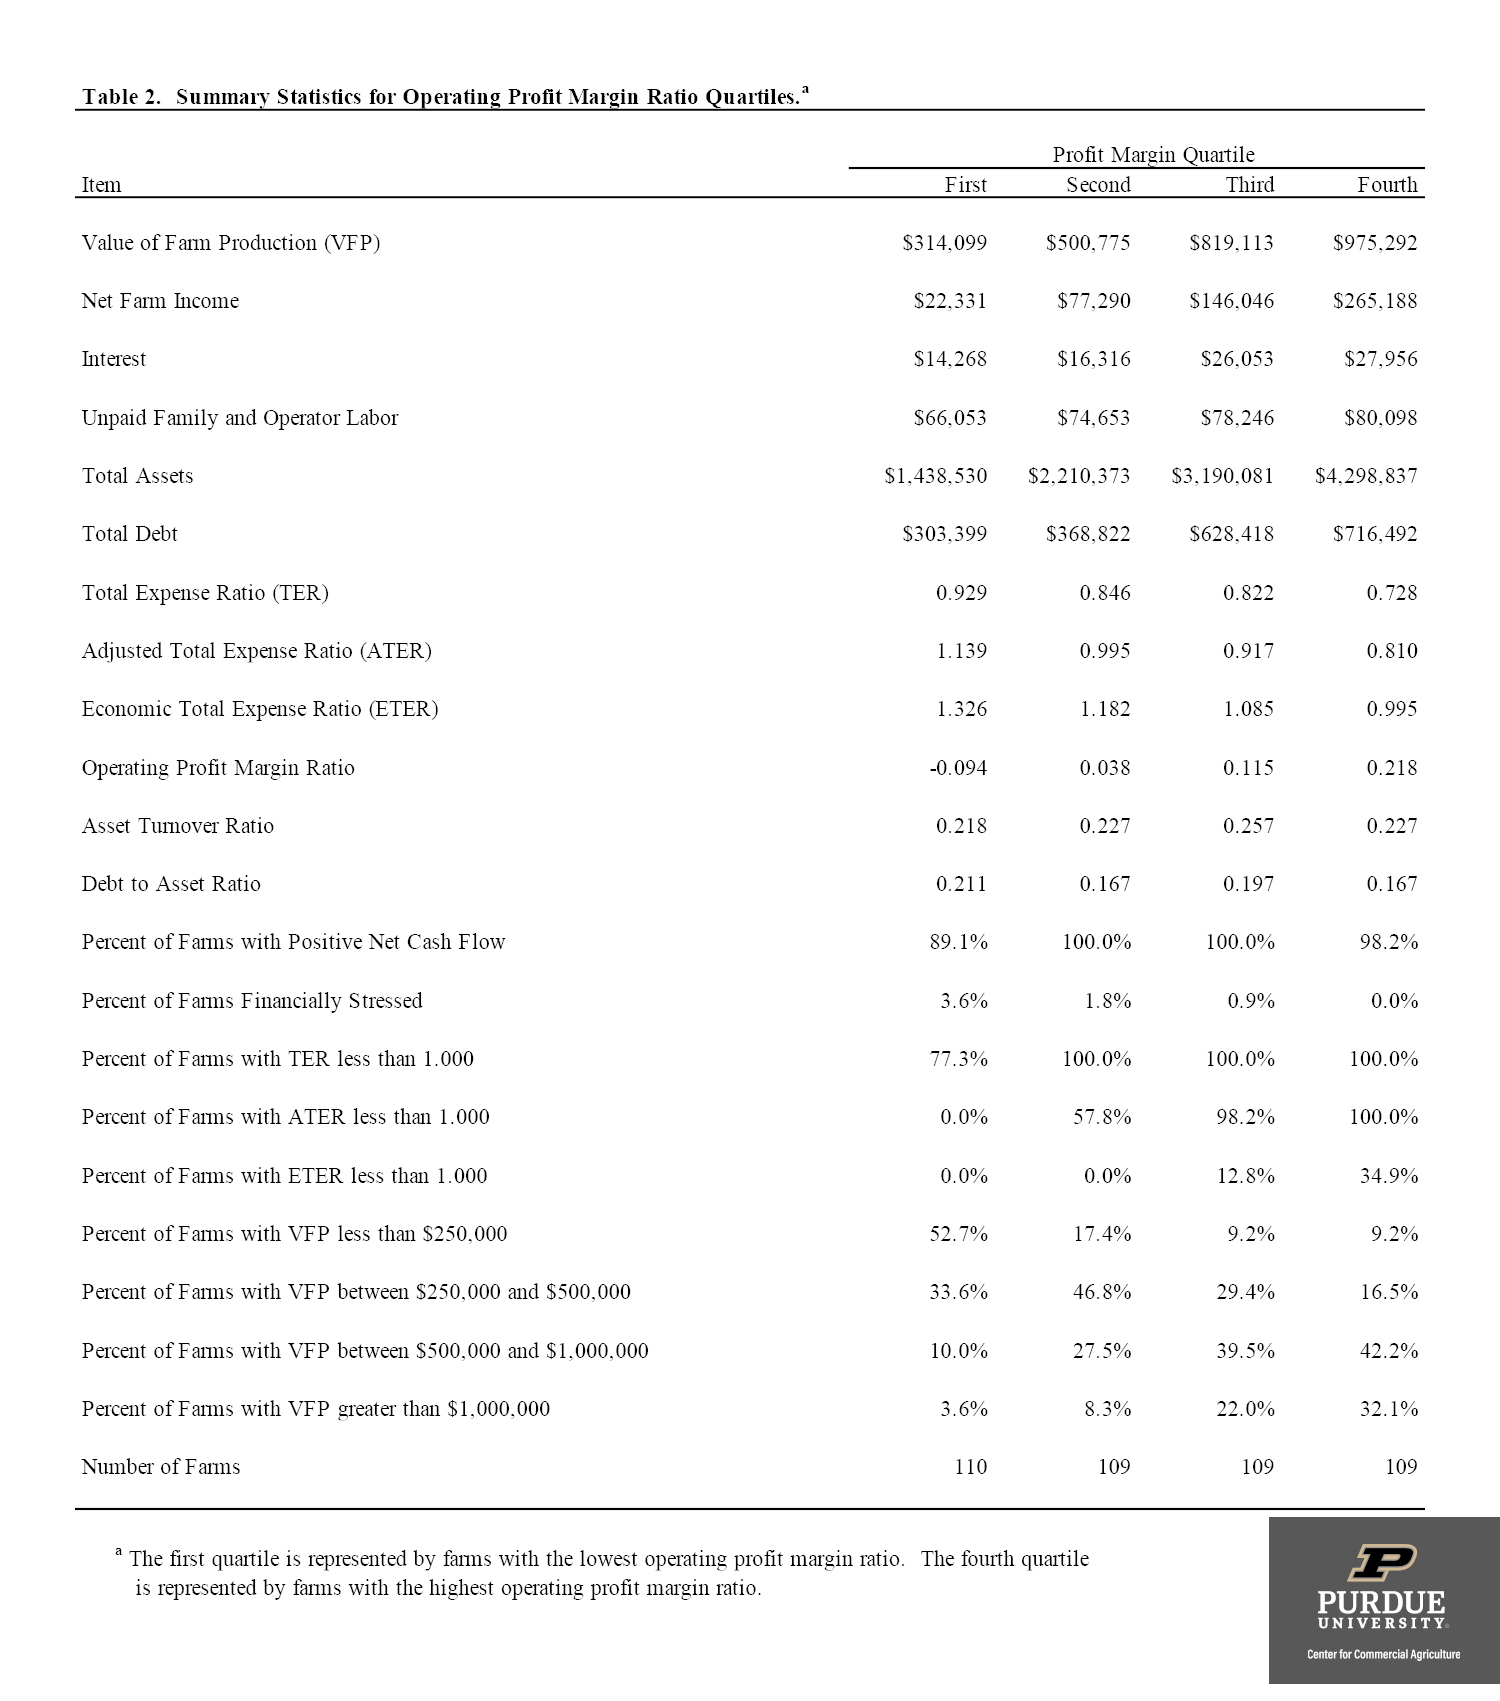
Table 2. Summary Statistics for Operating Profit Margin Ratio Quartiles.a
Table 2 presents the summary statistics for each profit margin ratio quartile. These tables were created using ten-year average data for each farm. The first quartile represents farms in the bottom quartile while the fourth quartile represents farms in the top quartile. The farms in the top profit margin quartile had an average operating profit margin ratio of 0.218 or 21.8 percent. In contrast, the farms in the bottom profit margin quartile had an average operating profit margin ratio of -0.094. The farms in the bottom profit margin quartile had relatively high expense ratios. In fact, none of the farms in the bottom profit margin quartile were able to cover accrual expenses, depreciation, and unpaid family and operator labor, and only 77 percent of the farms covered accrual expenses and depreciation (i.e., had a total expense ratio below 1.00). Though their performance was relatively low, only 3.6 percent of the farms in the bottom quartile were financially stressed. All of the farms in the top quartile covered accrual expenses, depreciation, and unpaid family and operator labor. Moreover, approximately 35 percent of the farms in the top profit quartile earned an economic profit. The farms in the top profit margin quartile tended to be larger than the farms in the bottom quartile. However, there were farms in each farm size category in the top quartile.
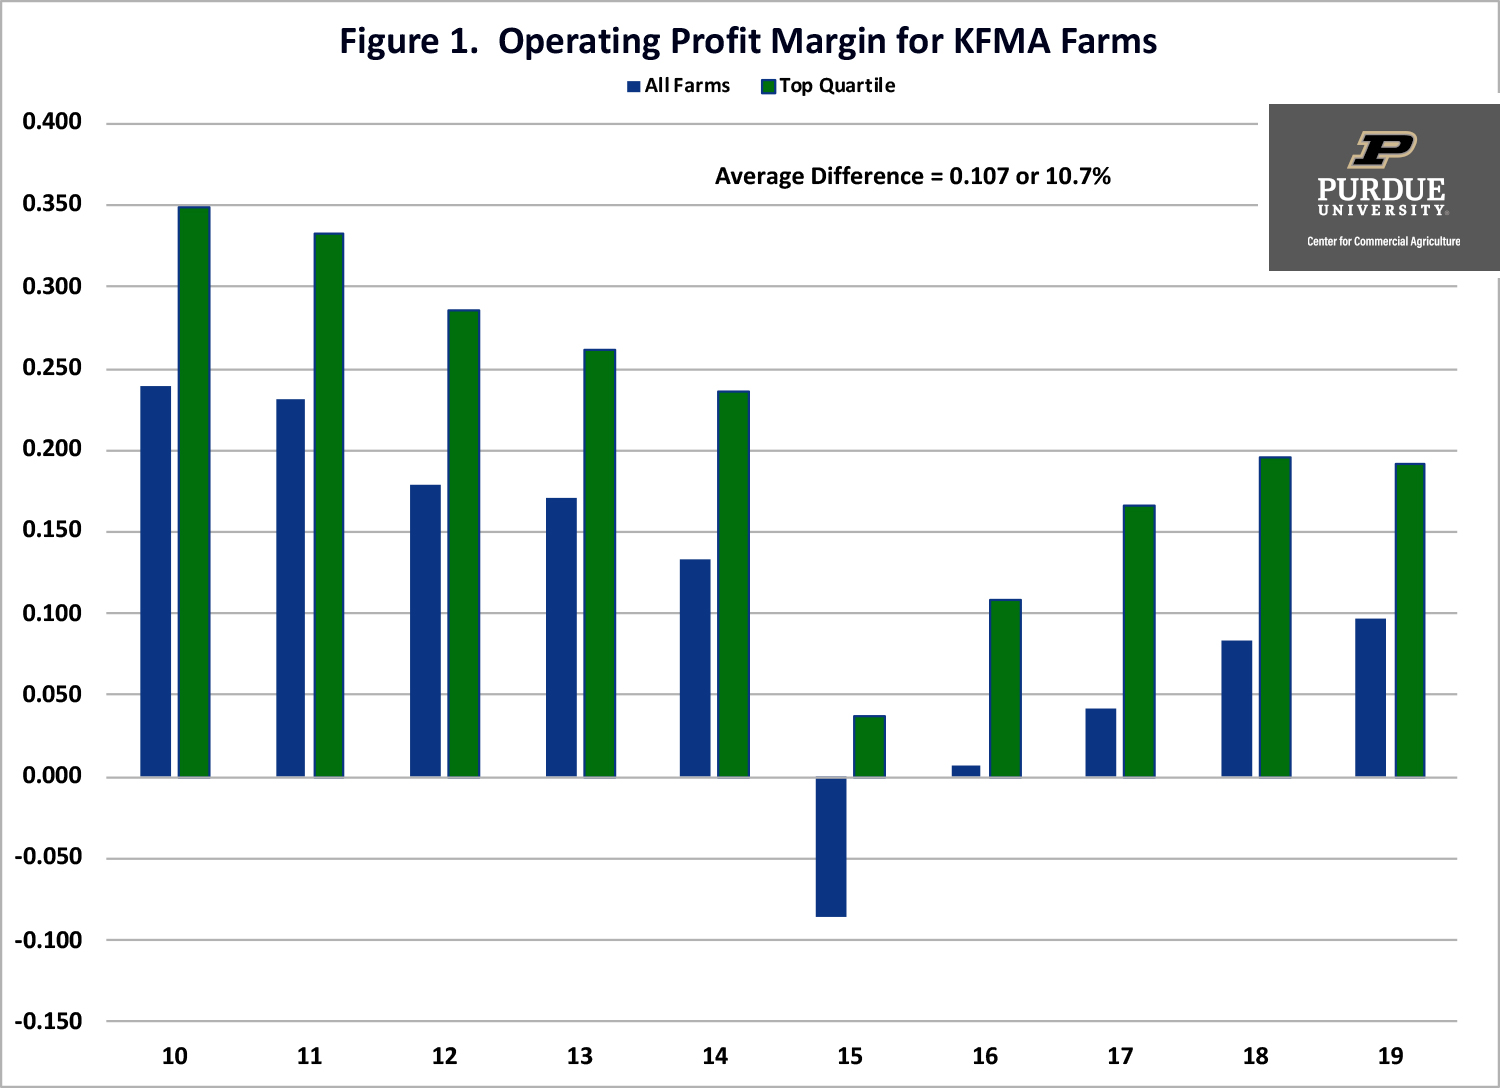
Figure 1. Operating Profit Margin for KFMA Farms
Figure 1 presents the average annual operating profit margin ratio for the entire sample of farms and for those farms in the top quartile. The average profit margin for the entire sample was negative in 2015, and close to zero in 2016. For farms in the top quartile, the average profit margin ranged from 3.7 percent in 2015 to 10.8 percent in 2016 for these same years. Figure 1 also stresses the importance of using multiple years to benchmark farms. For example, a 20 percent profit margin was relatively easy to attain in 2010 and 2011. From 2015 to 2017, this benchmark would have been very difficult to achieve.
The results in table 2 are consistent with FINBIN data (University of Minnesota, Center for Farm Financial Management). Rather than using quartiles, FINBIN reports use deciles. Using FINBIN data from 2010 to 2019, farms in the bottom 20 percent and 30 percent had average operating profit margin ratios of -11.5 and -4.3 percent, respectively. Farms in the top 30 percent and 20 percent had an average operating profit margin ratio of 25.7 and 32.7 percent.
Profit Margin Persistence
In addition to examining the profit margin quartiles for the ten-year period, we examined how common it was for farms in the bottom or top profit margin quartile from 2010 to 2014 to also be in the bottom or top profit margin quartiles from 2015 to 2019. For the ten-year period, there were 110 and 109 farms in the bottom and top profit margin quartiles, respectively. Approximately 56 percent and 53 percent of the farms in the bottom and top quartiles, respectively, were in the bottom and top profit margin quartiles for both of the five-year periods.
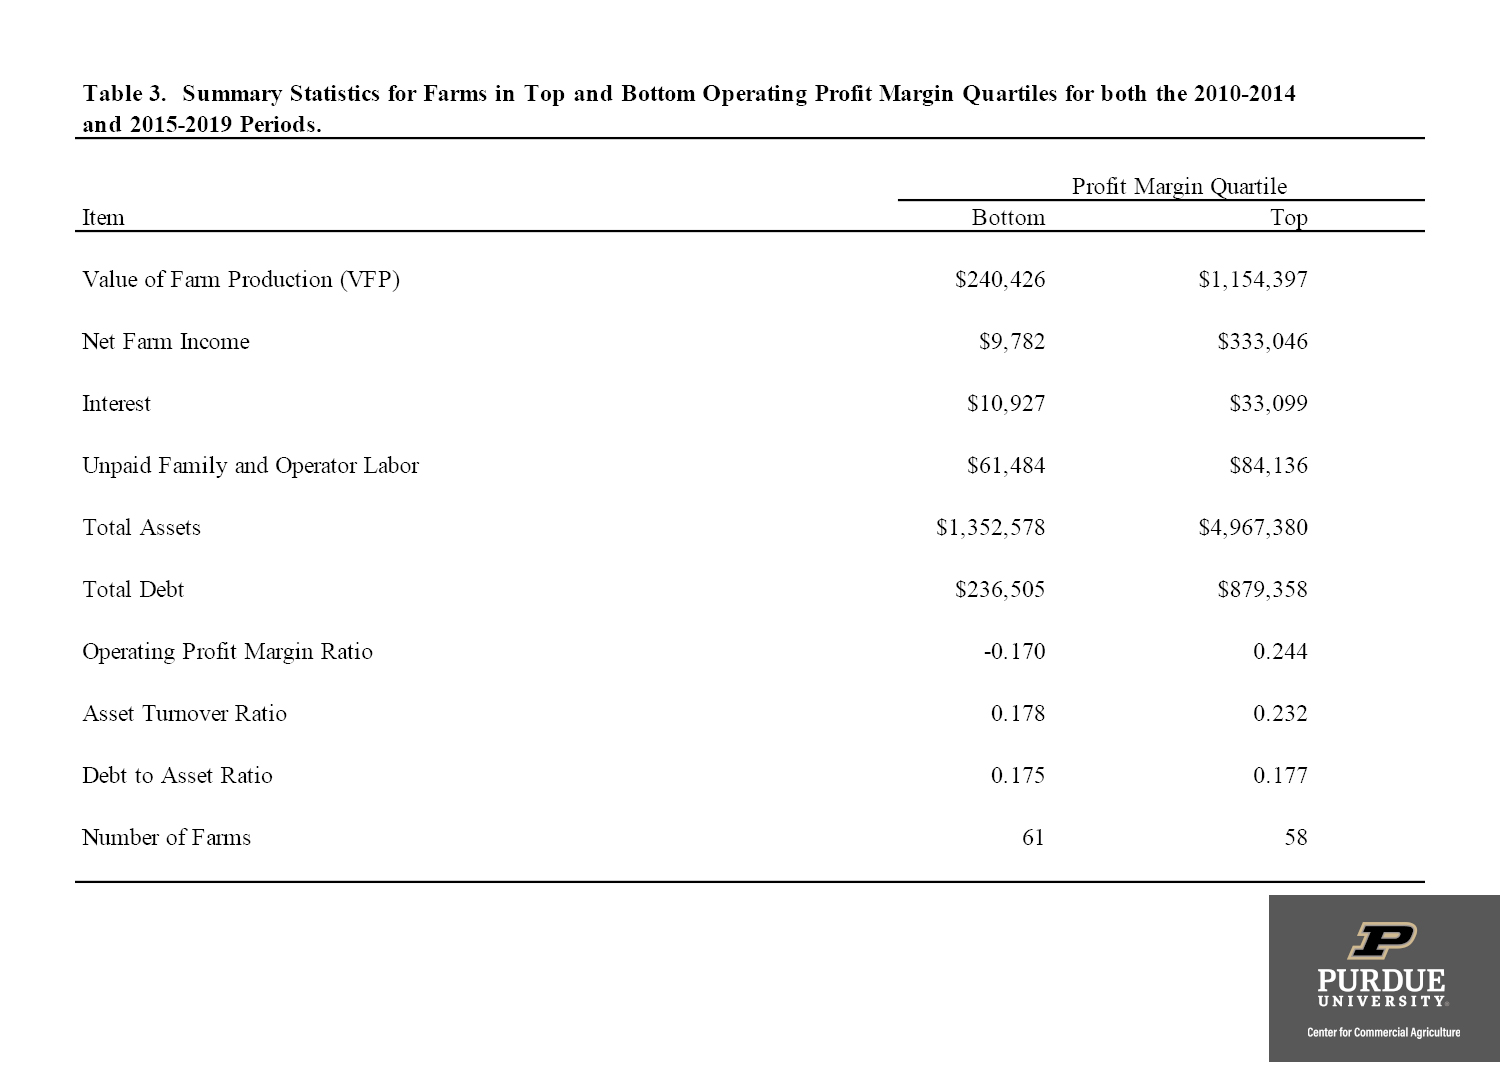
Table 3. Summary Statistics for Farms in Top and Bottom Operating Profit Margin Quartiles for both the 2010-2014
The characteristics of farms in the bottom and top profit margin quartiles from 2010 to 2014 and from 2015 to 2019 are presented in table 3. The operating profit margin for the farms that were consistently in the top profit margin was 0.244 or 24.4 percent. This group of farms tended to be larger, and to have a higher asset turnover ratio than the group of farms in bottom quartile for both five-year periods.
Concluding Comments
In summary, this paper examined the financial performance for a sample of KFMA farms over a ten-year period. Farms in the bottom quartile had a negative operating profit margin ratio indicating that they were not able to fully cover accrual expenses, depreciation, and unpaid family and operator labor. The average operating profit margin ratio for the sample of farms was 11.3 percent. In contrast, the average operating profit margin ratio for farms in the top profit margin quartile was 21.8 percent, or 10.5 percent higher than the average profit margin. For farms that were in the top quartile during the 2010 to 2014 and 2015 to 2019 periods, the average profit margin was 24.4 percent. Based on the results in this paper, farms are encouraged to use an operating profit margin ratio of at least 20 percent as their benchmark.
Results also stress the importance of using several years of data to benchmark financial performance and suggest that it is possible for farms to have a sustained competitive advantage. Given the wide variability of financial performance documented in this study, a further examination of the characteristics of the farms in the top profit margin quartile, including obtaining information pertaining to management styles, experience, and decision-making abilities, would be a fruitful area for further research.
![]()
![]()
![]()
![]()
![]()
TAGS:
TEAM LINKS:


RELATED RESOURCES
UPCOMING EVENTS
We are taking a short break, but please plan to join us at one of our future programs that is a little farther in the future.