April 4, 2024
International Benchmarks for Wheat Production (2024)
by Michael Langemeier
![]()
![]()
![]()
![]()
![]()
Examining the competitiveness of wheat production in different regions of the world is often difficult due to lack of comparable data and agreement regarding what needs to be measured. To be useful, international data needs to be expressed in common production units and converted to a common currency. Also, production and cost measures need to be consistently defined across production regions or farms.
This paper examines the competitiveness of wheat production for important international wheat production regions using 2018 to 2022 data from the agri benchmark network. An earlier paper examined international benchmarks for the 2015 to 2019 period (Langemeier, 2021). The agri benchmark network collects data on beef, cash crops, dairy, pigs and poultry, horticulture, and organic products. There are 20 countries with corn, soybean, and/or wheat data for 2022 represented in the cash crop network. The agri benchmark concept of typical farms was developed to understand and compare current farm production systems around the world. Participant countries follow a standard procedure to create typical farms that are representative of national farm output shares, and categorized by production system or combination of enterprises and structural features. Costs and revenues are converted to U.S. dollars so that comparisons can be readily made. Data from ten typical farms with wheat enterprise data from Argentina, Australia, Canada, Germany, Poland, Ukraine, and United States were used in this paper. It is important to note that wheat enterprise data is collected from other countries. These seven countries were selected to simplify the illustration and discussion.
The farm and country abbreviations used in this paper are listed in table 1. All of the farms had data for each year from 2018 to 2022. While the farms may produce a variety of crops, this paper only considers wheat production. Typical farms used in the agri benchmark network are defined using country initials and hectares on the farm. To fully understand the relative importance of the wheat enterprise on each typical farm, it is useful to note all of the crops produced. The typical farm in Argentina produced corn, sweet corn, soybeans, sunflowers, and winter wheat in 2022. Wheat was produced on approximately 14 percent of the typical farm’s acreage during the five-year period. The typical farm in Australia produced malting barley, winter rapeseed, and summer wheat in 2022. Wheat was produced on approximately 41 percent of the typical farm’s acreage. The Canadian farm in the Red River Valley produced corn, summer rapeseed, soybeans, and summer wheat in 2022 with wheat representing 20 percent of the farm’s acreage during the five-year period. The typical farm in Saskatoon produced summer rapeseed, peas, and summer wheat in 2022 with wheat representing approximately 42 percent of the farm’s acreage during the five-year period. The German farm produced winter barley, corn silage, winter rapeseed, and winter wheat in 2022. During the five-year period, wheat was planted on 51 percent of the typical farm’s acreage. The farm in Poland produced summer and winter barley, corn, winter rye, winter rapeseed, beans, sugar beets, and winter wheat in 2022 with wheat representing 46 percent of the farm’s acreage during the five-year period. The smaller farm in the Ukraine produced corn, soybeans, sunflowers, and winter wheat with wheat representing approximately 16 percent of the typical farm’s acreage during the five-year period. Crops produced on the larger farm in the Ukraine in 2022 included winter rapeseed, sunflowers, and winter wheat. Wheat was produced on approximately 14 percent of the typical farm’s acreage during the five-year period. There are three U.S. farms with wheat in the network. The typical farms in North Dakota and Kansas are represented in this study. The typical farm in North Dakota produced corn, soybeans, and summer wheat in 2022. Wheat was produced on approximately 17 percent of the typical farm’s acreage during the five-year period. The typical farm in Kansas produced corn and winter wheat. Wheat was produced on approximately 36 percent of the typical farm’s acreage during the five-year period.
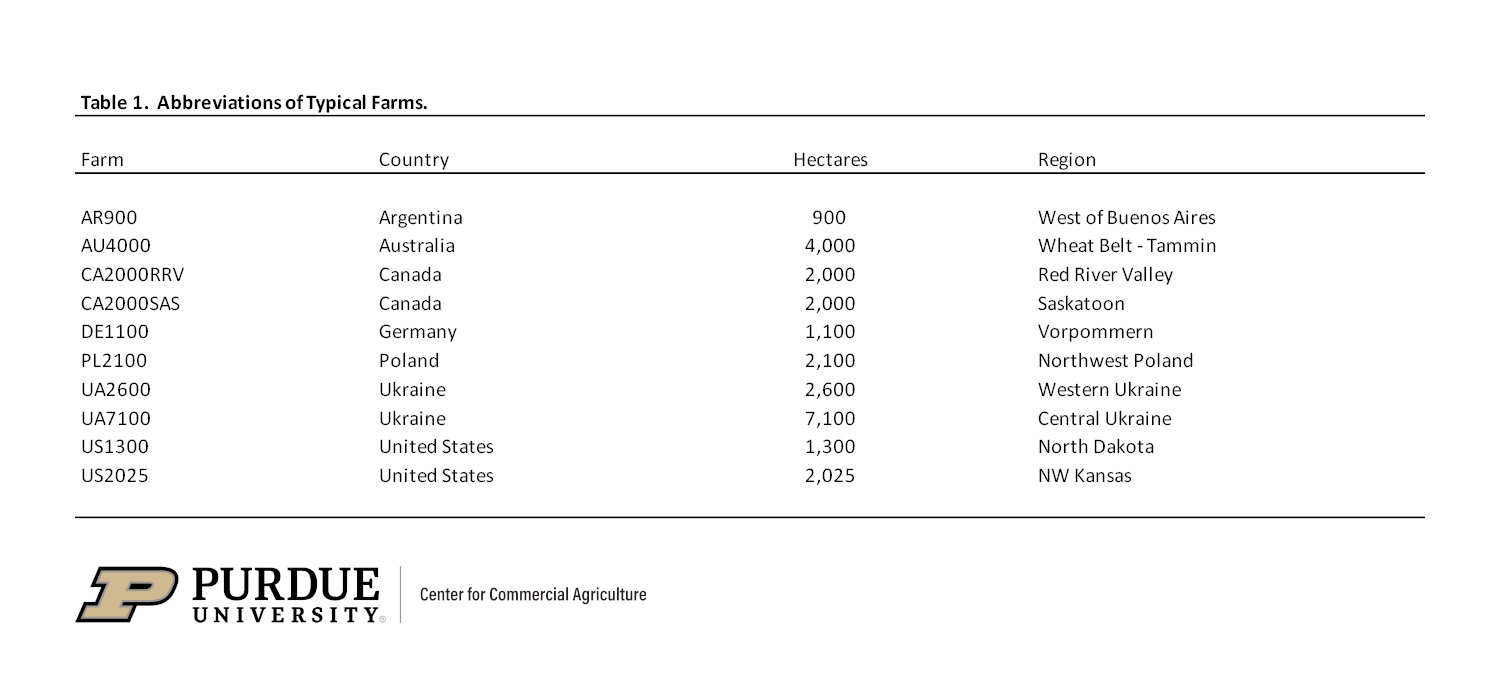
Table 1. Abbreviations of Typical Farms.
Wheat Yields
Although yield is only a partial gauge of performance, it reflects the available production technology across farms. Average wheat yield for the farms in 2018 to 2022 was 4.36 metric tons per hectare (64.9 bushels per acre). Average farm yields ranged from approximately 1.94 metric tons per hectare (28.9 bushels per acre) for the typical farm in Australia to 7.94 metric tons per hectare (118.1 bushels per acre) for the typical farm in Germany. Figure 1 illustrates average wheat yield for each typical farm. The farms in North Dakota and Kansas had average yields of 52.8 and 45.8 bushels per acre (3.55 and 3.08 metric tons per hectare), respectively.
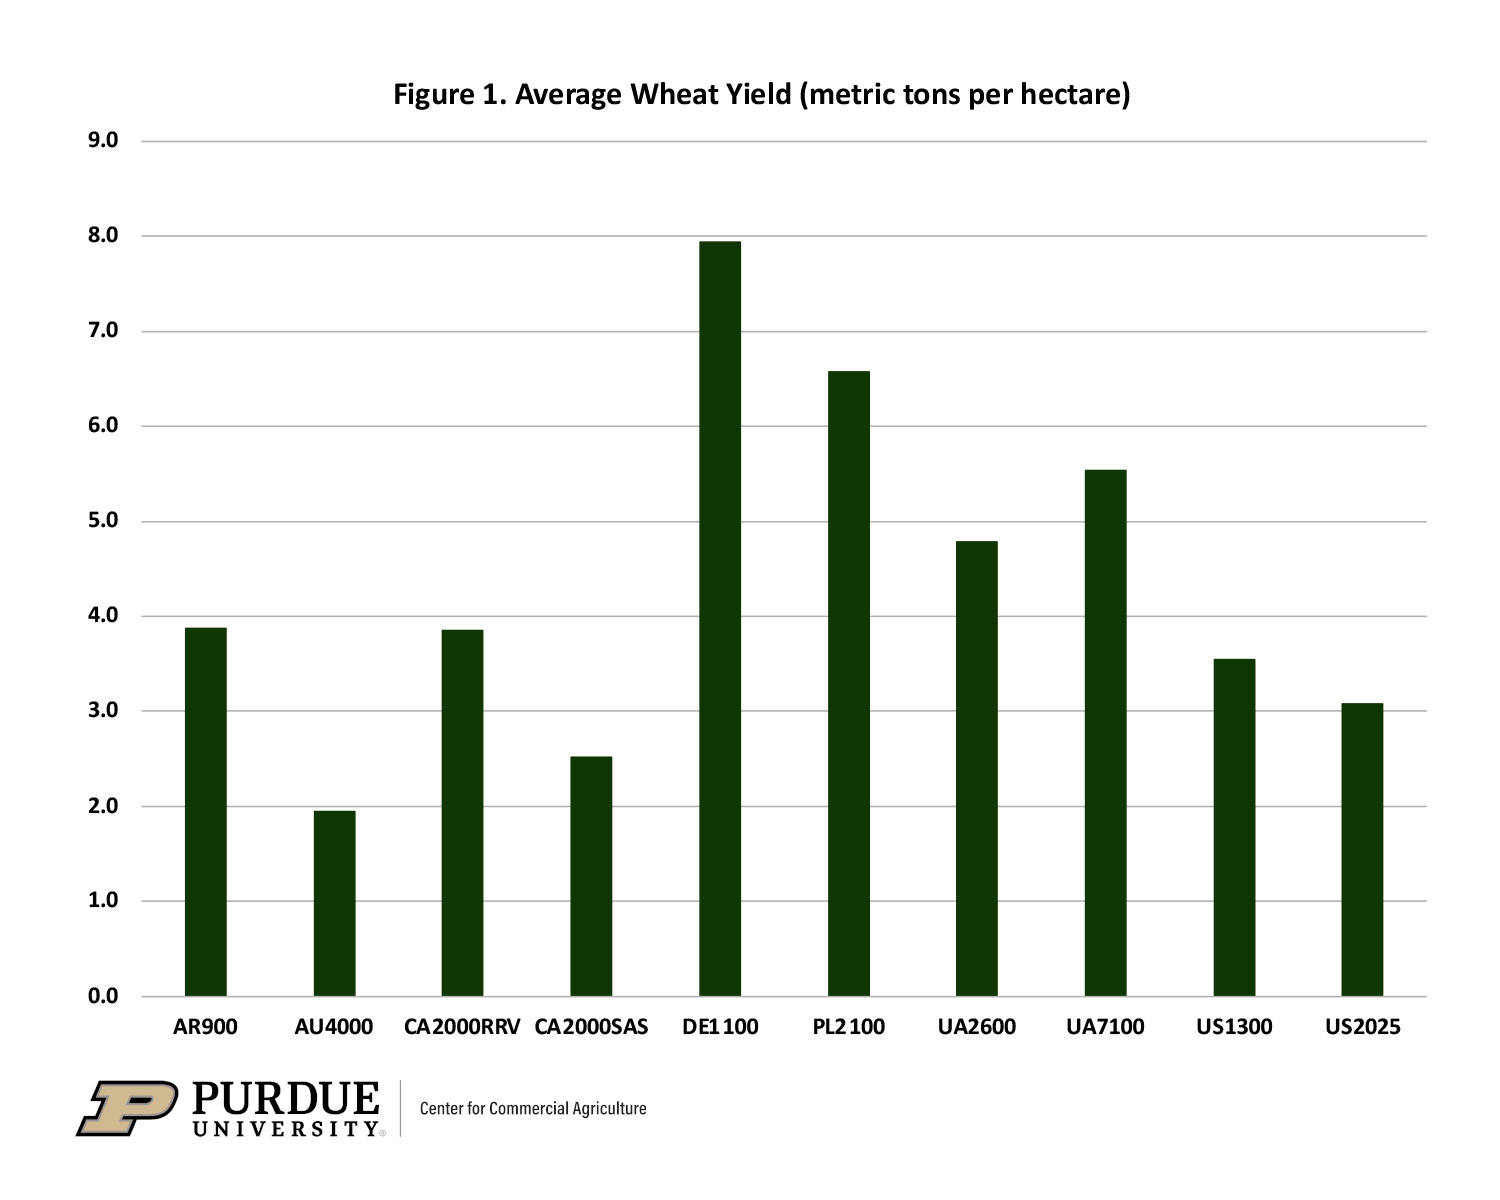
Figure 1. Average Wheat Yield (metric tons per hectare)
Input Cost Shares
Due to differences in technology adoption, input prices, fertility levels, efficiency of farm operators, trade policy restrictions, exchange rate effects, and labor and capital market constraints, input use varies across wheat farms. Figure 2 presents the average input cost shares for each farm. Cost shares were broken down into three major categories: direct costs, operating costs, and overhead costs. Direct costs included seed, fertilizer, crop protection, crop insurance, and interest on these cost items. Operating cost included labor, machinery depreciation and interest, contractor cost, fuel, and repairs. Overhead cost included land, building depreciation and interest, property taxes, general insurance, and miscellaneous cost.
The average input cost shares were 34.0 percent for direct cost, 36.6 percent for operating cost, and 29.4 percent for overhead cost. The typical farms in the Ukraine had the lowest cost shares for direct cost which includes crop establishment costs pertaining to seed, fertilizer, and pesticides. The typical farms in Argentina and in North Dakota had the lowest cost shares in terms of operating cost. Labor costs as a proportion of total costs were relatively higher for the typical farms in the Ukraine and the typical farm in Germany. Overhead costs as a proportion of total costs were relatively higher in Argentina, Germany, and Poland. In general, overhead costs are driven by land cost.
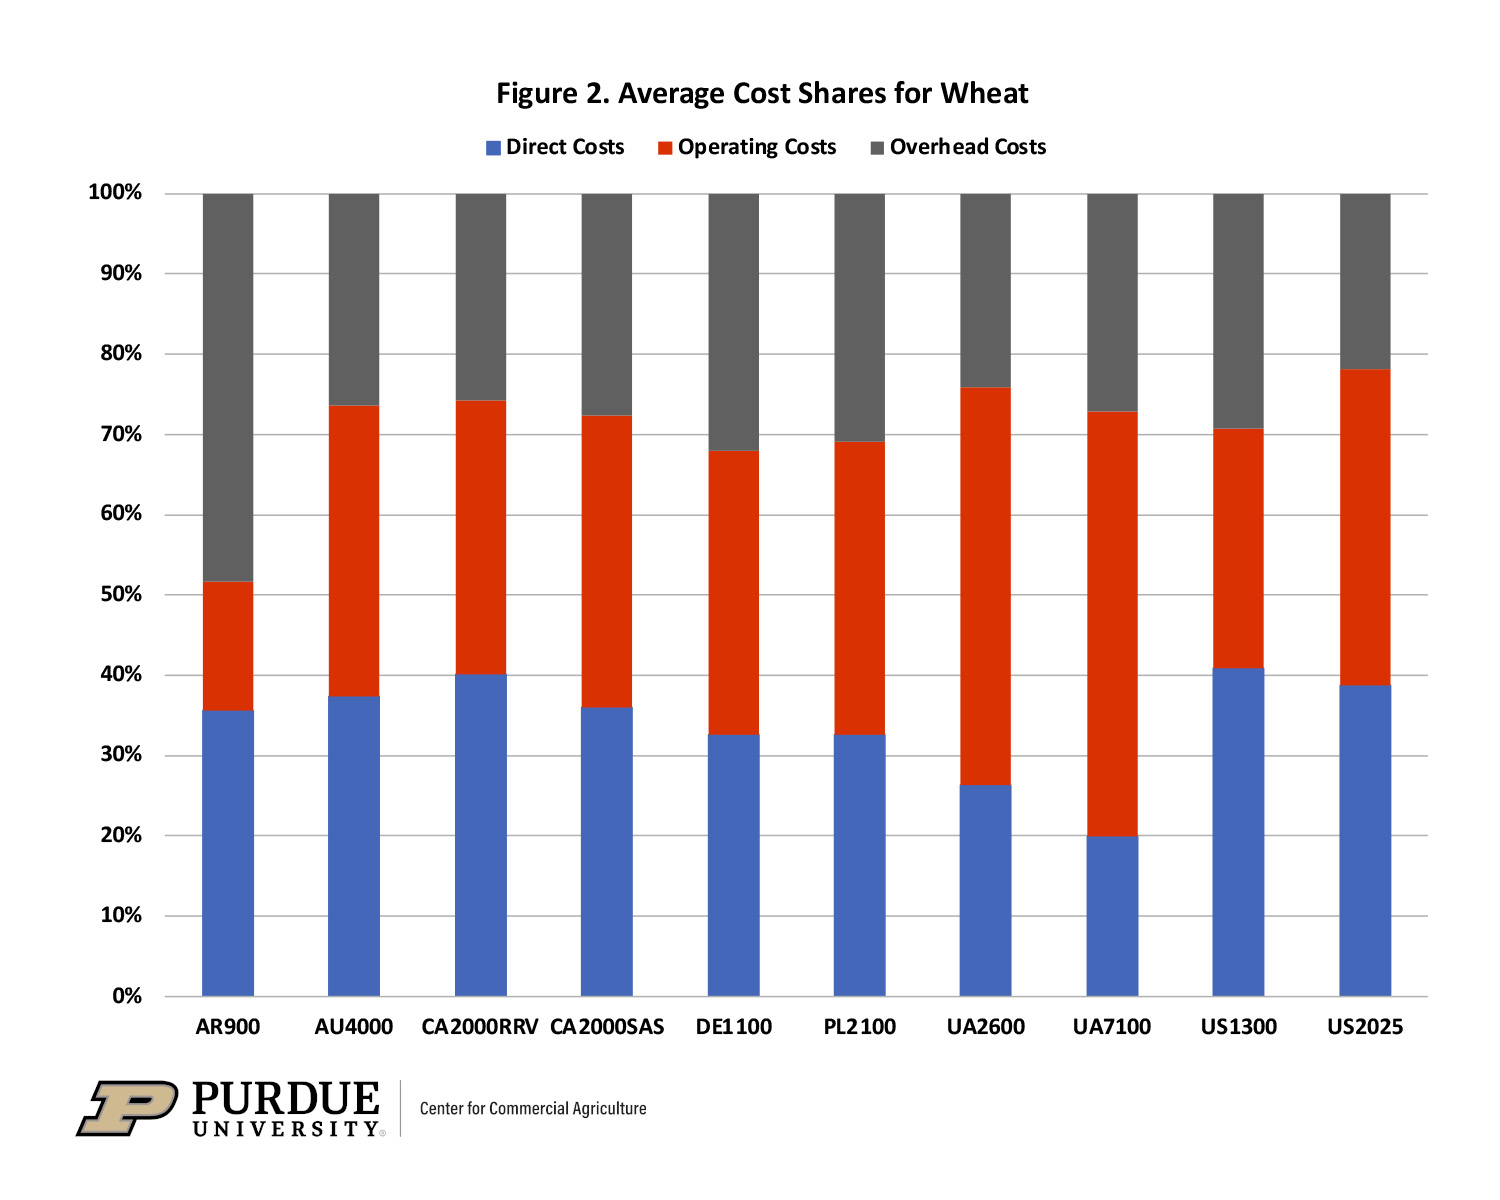
Figure 2. Average Cost Shares for Wheat
Revenue and Cost
Figure 3 presents average gross revenue and cost for each typical farm. Gross revenue and cost are reported as U.S. dollars per hectare. It is obvious from figure 3 that gross revenue per hectare is substantially higher for the typical farms in Germany and Poland. However, cost is also substantially higher for these two farms. The average profit per hectare for all of the farms during the 2018 to 2022 period was $10. The typical farms from Australia, Germany, Poland, and North Dakota exhibited economic profit during the five-year period. Average losses per hectare for the other typical farms ranged from a loss of $161 per hectare for the Canadian farm by Saskatoon to a loss of $42 per hectare for the farm in Central Ukraine. The average loss for the farm in northwest Kansas during the five-year period was $63 per hectare.
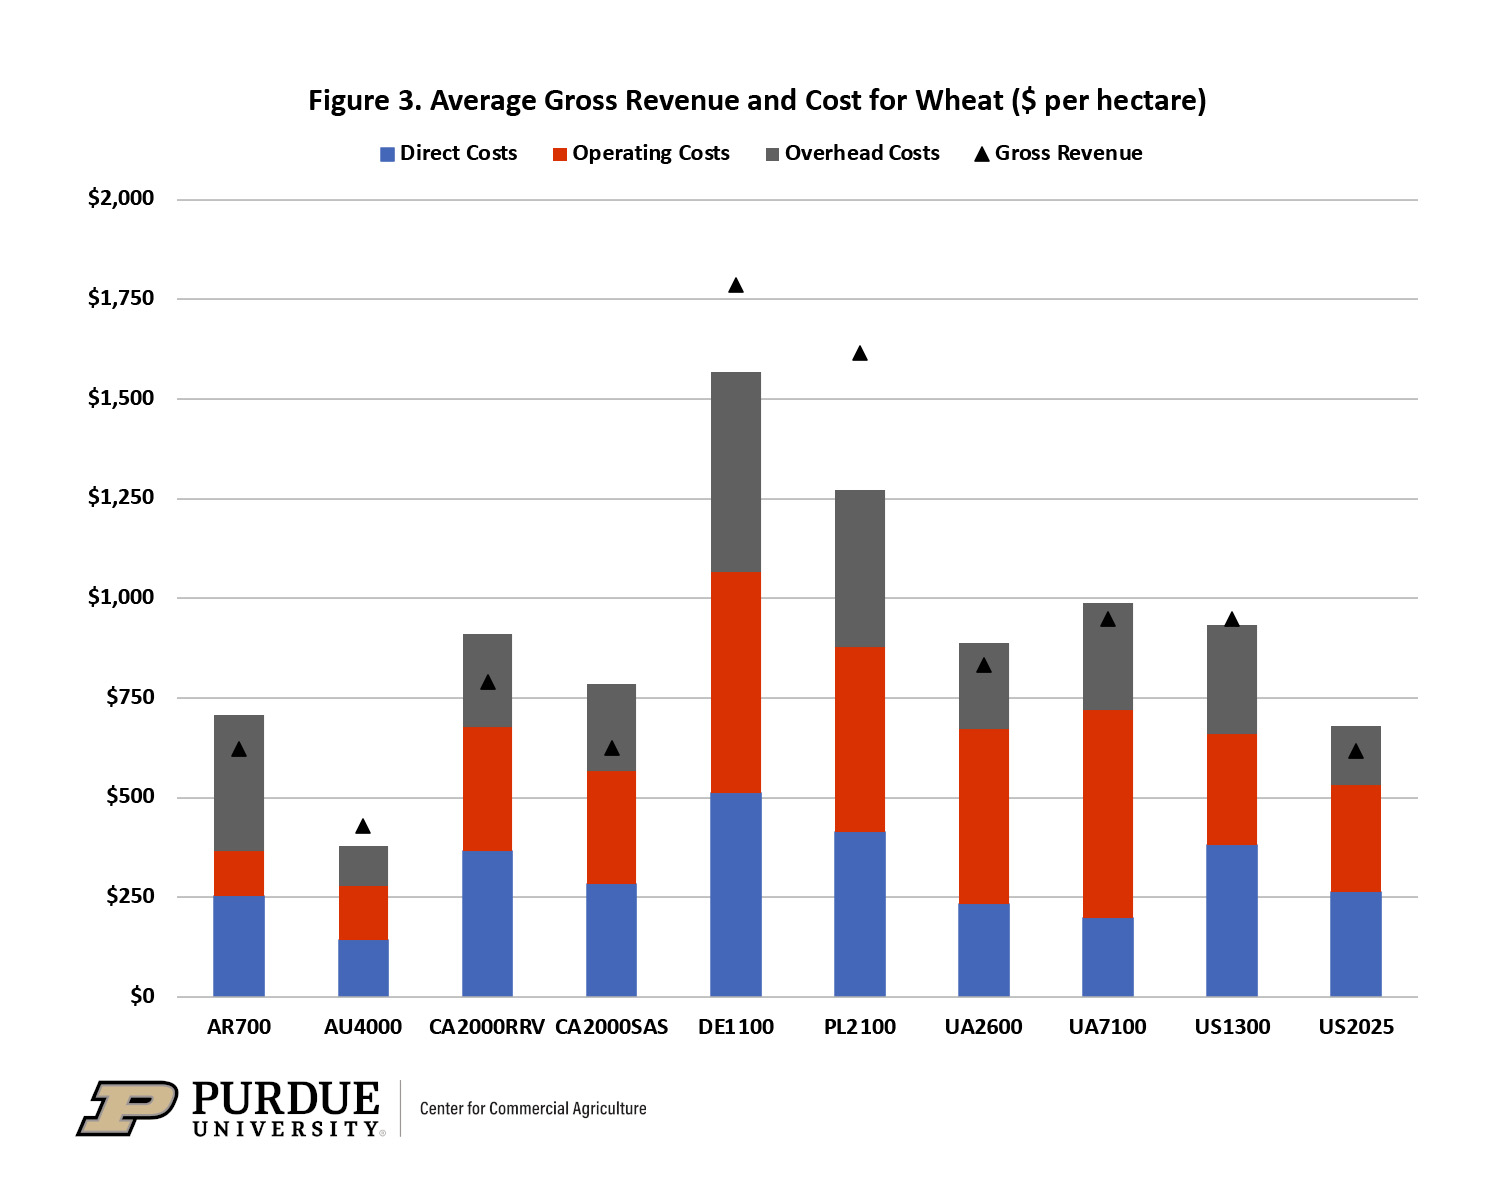
Figure 3. Average Gross Revenue and Cost for Wheat ($ per hectare)
Figure 4 presents average gross revenue and cost for wheat on a per ton basis. Gross revenue per ton was relatively higher for the typical farms in Saskatoon, in Poland, and in North Dakota. The highest costs per ton were exhibited by the Canadian and U.S. farms. Economic profit per ton for the five-year period was the highest for the typical farms in Australia, Germany, and Poland.
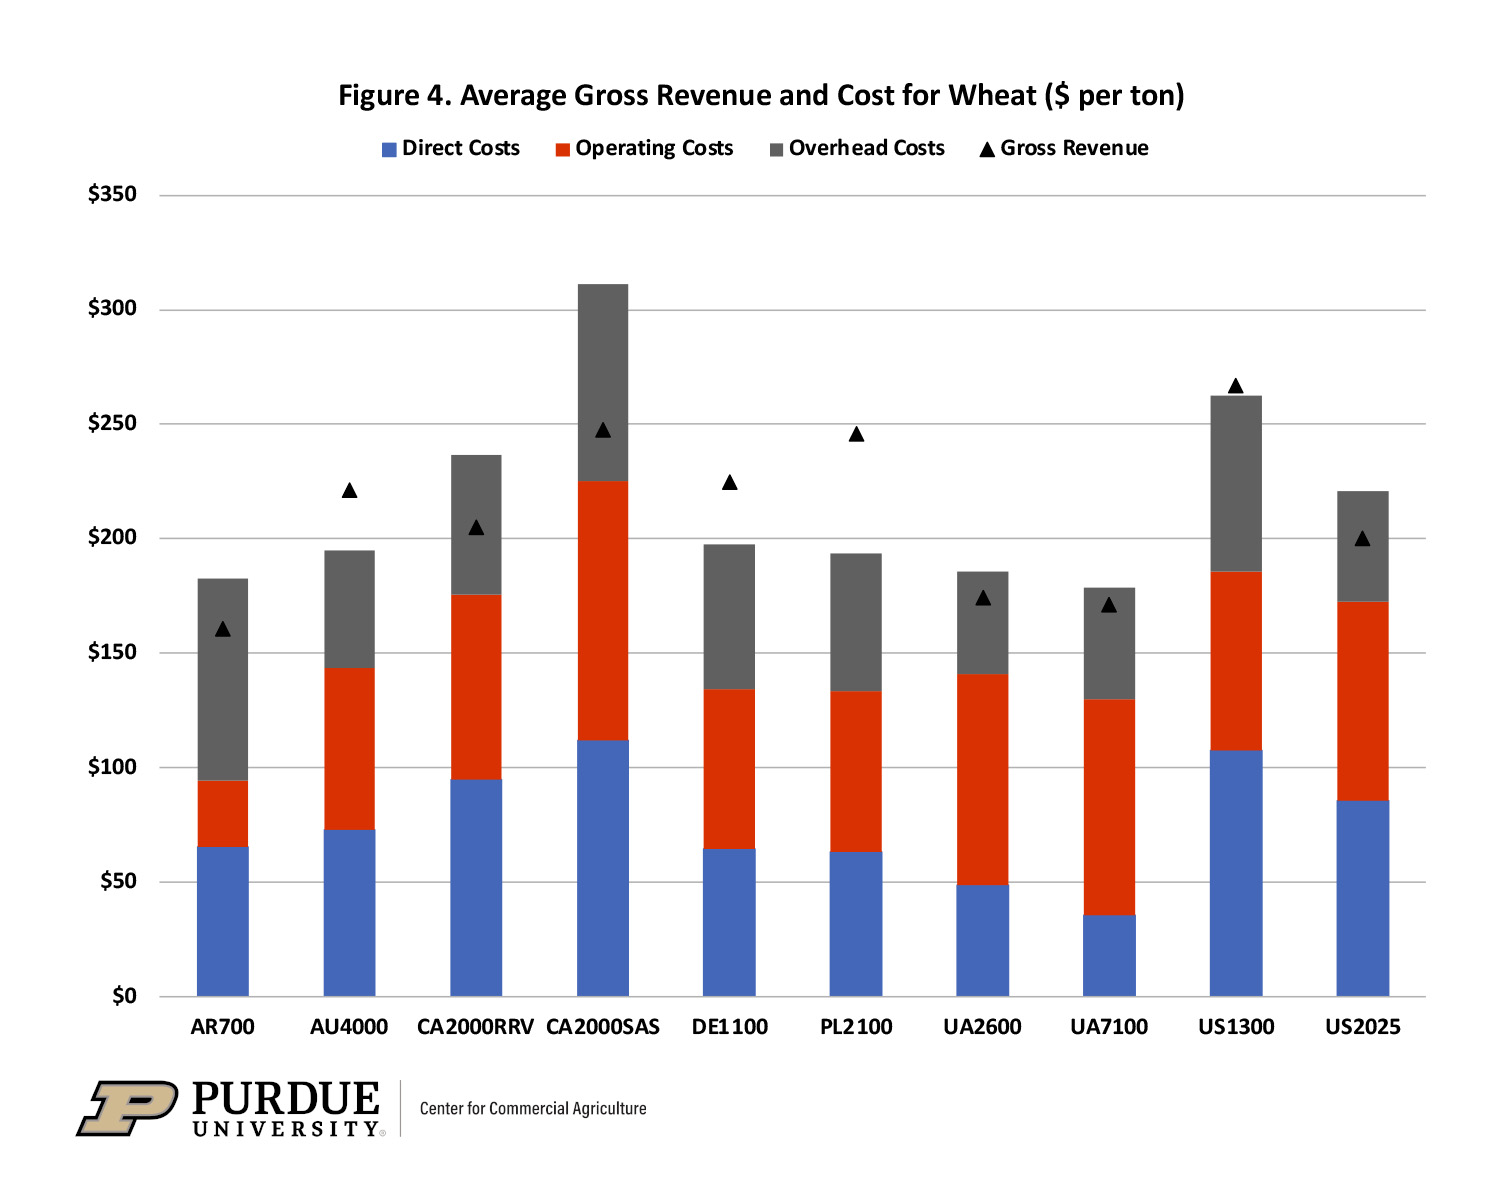
Figure 4. Average Gross Revenue and Cost for Wheat ($ per ton)
Conclusions
This paper examined yield, gross revenue, and cost for farms in the agri benchmark network from Argentina, Australia, Canada, Germany, Poland, the Ukraine, and the United States with wheat enterprise data. The German farm had the highest yield. The typical farms in Australia, Germany, Poland, and North Dakota exhibited a positive average economic profit during the 2018 to 2022 period.
References
agri benchmark. http://www.agribenchmark.org/home.html. Accessed on December 27, 2023.
Langemeier, M. “International Benchmarks for Wheat Production.” Center for Commercial Agriculture, Purdue University, July 26, 2021.
![]()
![]()
![]()
![]()
![]()
TAGS:
TEAM LINKS:

RELATED RESOURCES
UPCOMING EVENTS
We are taking a short break, but please plan to join us at one of our future programs that is a little farther in the future.