November 12, 2024
Long-Term Trends in Pigs per Litter
by Michael Langemeier
![]()
![]()
![]()
![]()
![]()
Key performance metrics for swine production include feed conversion, litters per sow per year, pigs per litter, and pounds of pork produced per sow per year. All of these metrics have improved dramatically over time. A recent article by Franken (2024), noted that pigs per litter reached another record in September. Improvements in production performance are critical to controlling production costs and for the industry to remain competitive in comparison to swine producers in other countries and competing meats. This article examines long-term trends in pigs per litter.
Pigs per litter data for the U.S. are available from USDA-NASS on a monthly, quarterly, and annual basis. Figure 1 illustrates actual and predicted pigs per litter for the last 30 years, 1994 to 2023. A simple linear trend was used to predict pigs per litter for each year. The annual growth rate in pigs per litter was 0.107 pigs or 1.1 percent per year. This may seem small, however, over the 30-year period, this equates to an increase of 3.11 pigs per litter or an increase of approximately 37.4 percent over the 1994 to 2023 period.
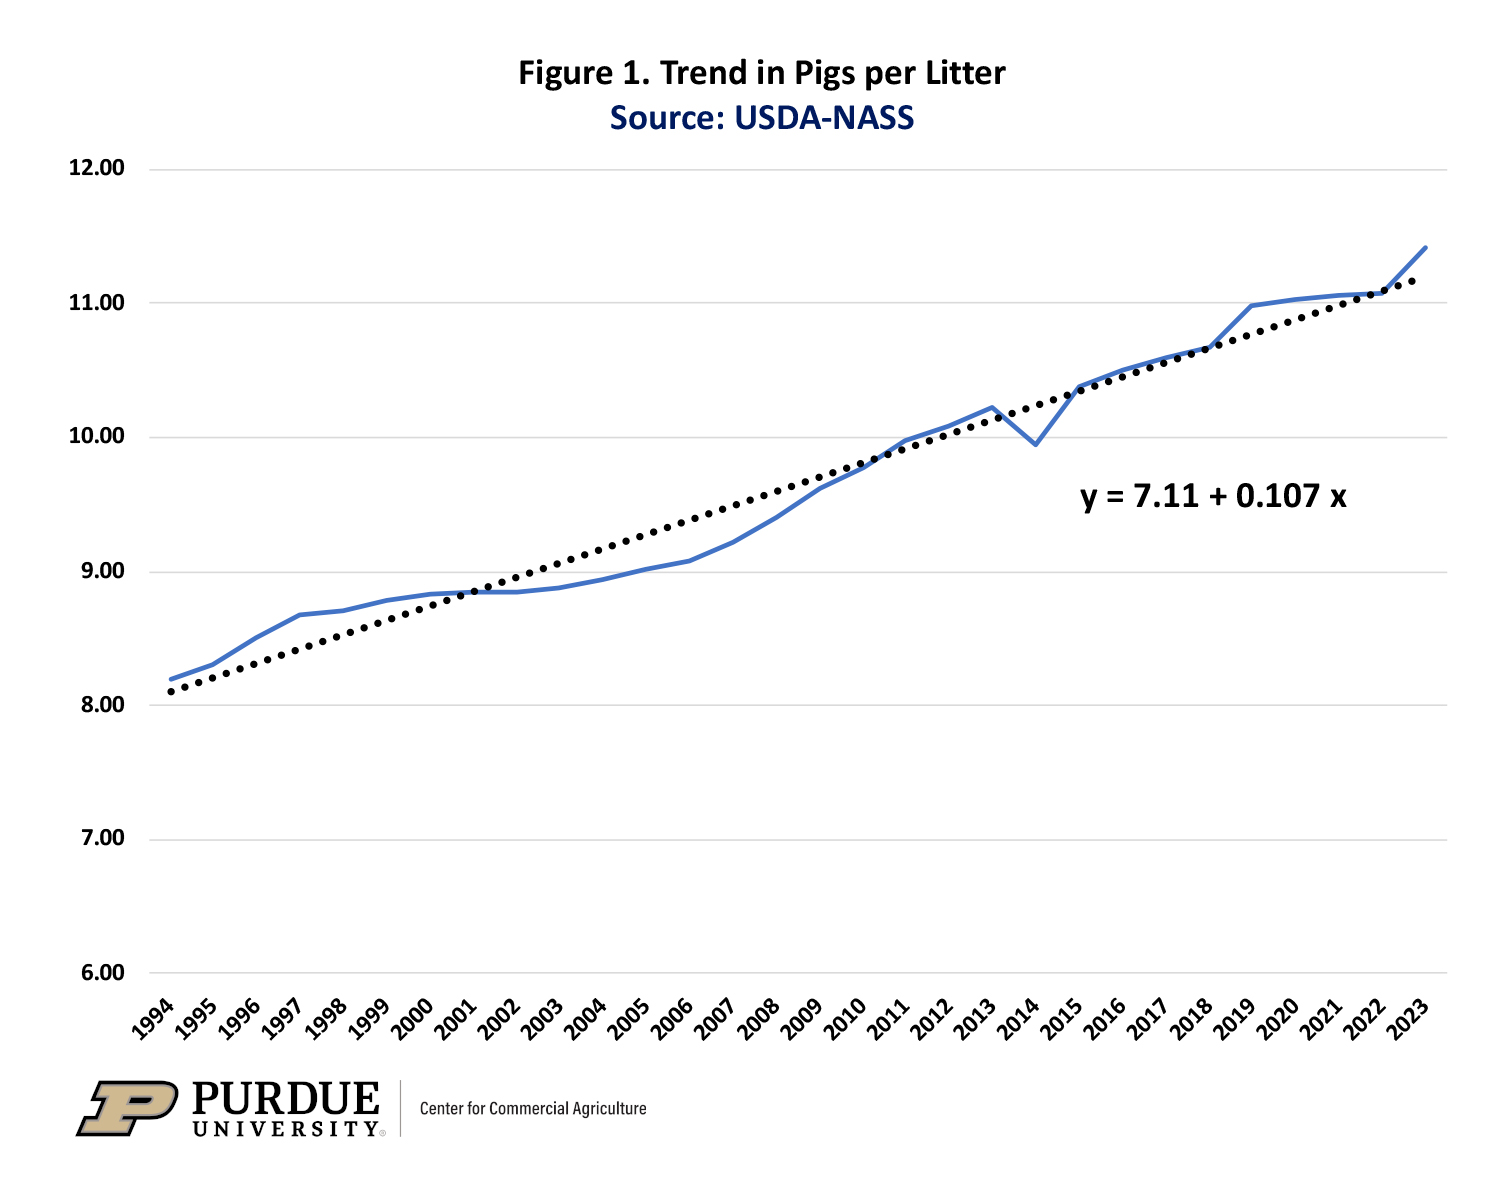
Figure 1. Trend in Pigs per Litter
Production performance, measured using pigs per litter, has been particularly strong in the last few years. As evident in figure 1, since 2015, pigs per litter have been above the trend line. This was particularly true for 2019 and 2023. Actual and predicted pigs per litter were 10.98 and 10.78 in 2019, and 11.42 and 11.21 in 2023. In other words, pigs per litter were approximately 0.2 pigs above the long-run trend for these two years.
Improvements in production performance, such as litters per sow per year and pigs per litter, have impacts on the number of sows needed to supply the domestic and export markets. Obviously, if pigs per litter had not increased over the last few decades, we would need a much larger sow herd. In addition to production performance, the increasing market weight of barrows and gilts has impacted the size of the sow herd needed to supply our markets. To provide some perspective on the importance of production performance and market weights, we will contrast the growth rates in sows farrowed, pig crop, and swine production in pounds (USDA-NASS). The annual growth rate in the U.S. sow herd during the 1994 to 2023 period is only 0.17 percent per year. In contrast, the annual growth rate in the U.S. pig crop (1994 to 2023) and U.S. swine production (1994 to 2023) are 1.28 percent and 2.07 percent, respectively. In 1994, the pig crop (swine production) was 101.5 million head (24.4 billion pounds). The pig crop in 2023 was 135.8 million head, and swine production totaled 42.6 billion pounds. To summarize, we have increased U.S. swine production by 74 percent by increasing the number of sows by only 5.2 percent. In terms of per sow production, pounds produced per sow increased from 1,972 in 1994 to 3,580 in 2023.
In closing, pigs per litter has increased at a rate of 0.107 pigs per year since 1994. Another way of stating the same thing, the annual growth rate of pigs per litter in the U.S. was 1.1 percent from 1994 to 2023. Continued improvements in production performance will help ensure the U.S. swine industry remains competitive.
Citation
Franken, J. “Record Pigs per Litter Starting to Sound Like a Broken Record?” farmdoc daily (14):177, Department of Agricultural and Consumer Economics, University of Illinois at Urbana-Champaign, September 30, 2024.
United States Department of Agriculture, National Agricultural Statistics Service. Quick Stats, https://www.nass.usda.gov/Quick_Stats/, accessed October 23, 2024.
![]()
![]()
![]()
![]()
![]()
TAGS:
TEAM LINKS:

RELATED RESOURCES
UPCOMING EVENTS
We are taking a short break, but please plan to join us at one of our future programs that is a little farther in the future.