November 23, 2021
Pork Belly Price Strength Leads the Way Among Pork Cuts
by James Mintert
![]()
![]()
![]()
![]()
![]()
The pandemic disrupted food production, processing, distribution, and consumption across the board. As a result, dramatic shifts in price relationships have become commonplace. Examining changes in these price relationships can provide clues to shifting interest among consumers for food items, including various pork cuts.
Each day USDA publishes the Pork Carcass Cutout value, which provides an estimate of the value of a 55-56% lean, 215-pound hog carcass. Current prices for wholesale sub-primal pork cuts are used to estimate the carcass value. Weekly averages of the daily cutout value are often used to smooth some of the daily price swings to make examination of longer-term trends possible. Through mid-November the 2021 weekly average of estimated wholesale pork carcass cutout values published by USDA was nearly $107 per cwt., 35% higher than the corresponding pre-pandemic average from 2015-2019. Was the dramatic increase in wholesale pork values during 2021 compared to the pre-pandemic era spread evenly across various pork sub-primals or is there evidence of a preference shift among both domestic and export consumers based on shifting price relationships?
One way to examine shifting price relationships is to examine pork sub-primal values relative to the pork carcass cutout value. The ratio of the various sub-primals’ price quotes to the pork carcass cutout value provides some insight into domestic consumers’ and importers preferences. The single biggest increase in 2021 appears to be a rise in the ratio of pork belly prices to the estimated pork cutout value when compared to the week-by-week averages from 2015-2019. The belly/cutout price averaged 7% stronger in 2021 than from 2015-2019 with the biggest increases taking place in the spring, followed by late summer and early fall. Picnic values relative to the carcass cutout value also showed signs of strengthening during the pandemic compared to earlier, averaging 6% stronger in 2021 than during 2015-2019. Somewhat similar to pork bellies, picnic values showed the most strength compared to history in late winter-early spring and again from mid-summer into early fall.
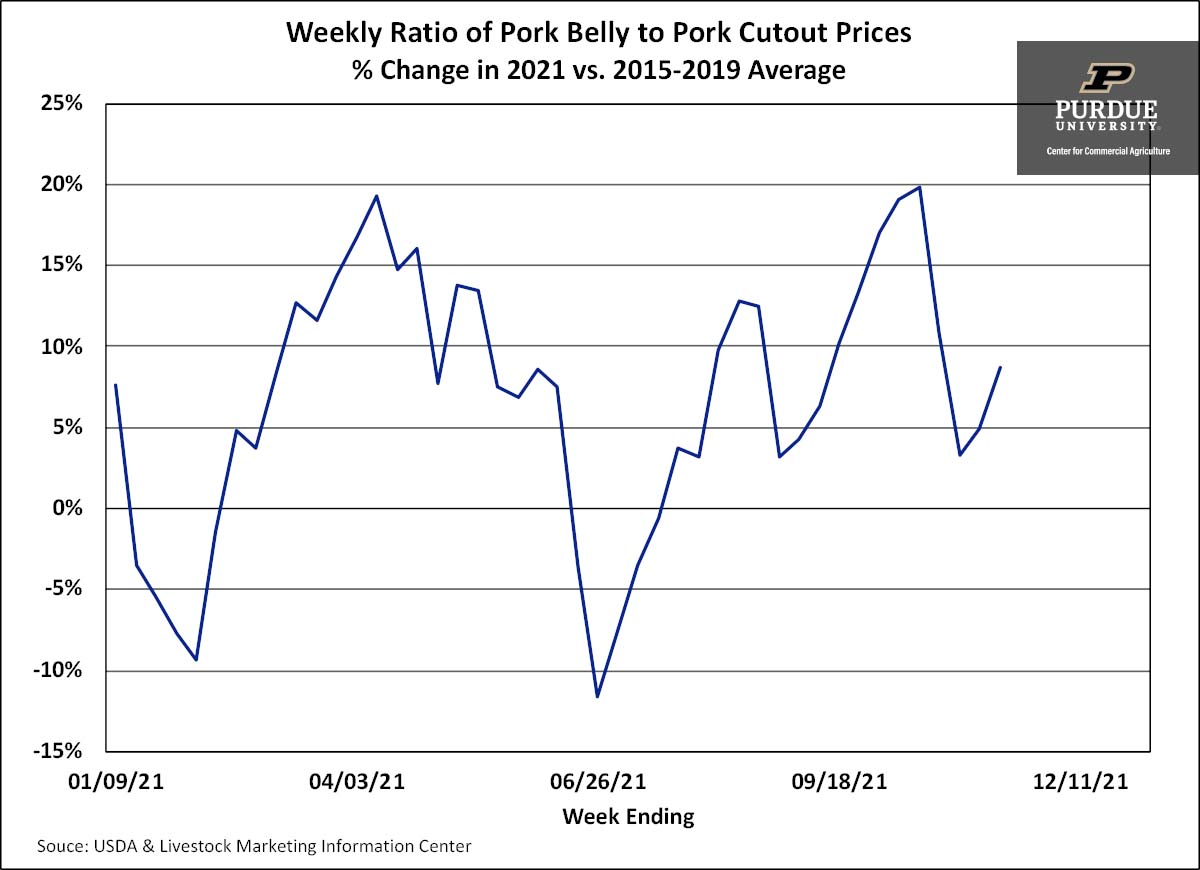
Figure 1. Weekly Ratio of Pork Belly to Pork Cutout Prices, % Change in 2021 vs. 2015-2019 Average
Pork sub-primals that lost ground compared to the pork cutout were pork butts and pork ribs. The ratio of pork butt prices to the cutout averaged 7% lower in 2021 than during 2015-2019 and would have fallen even farther below the pre-pandemic average were it not for just five weeks of price strength in June. Rib values during 2021 averaged 5% below their 2015-2019 average and would have fallen further compared to their 2015-2019 track record were it not for significant price strength from late April through mid-June.
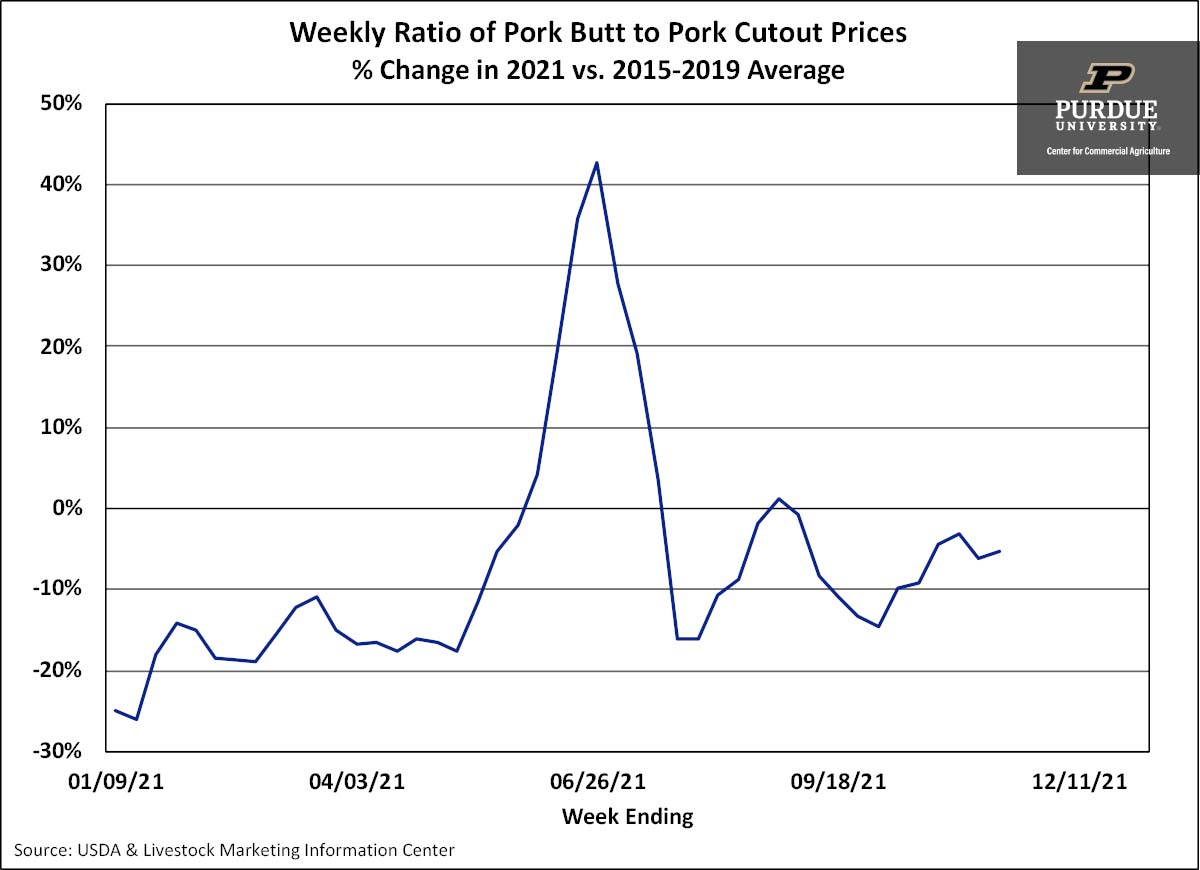
Figure 2. Weekly Ratio of Pork Butt to Pork Cutout Prices, % Change in 2021 vs. 2015-2019 Average
Pandemic related upheavals in consumption and purchasing patterns have altered some important pork price relationships. Although it’s too soon to say how permanent some of these shifts might be, the evolving price relationships are worth monitoring to see if industry led efforts to improve utilization of some pork cuts are warranted.
![]()
![]()
![]()
![]()
![]()
TAGS:
TEAM LINKS:

RELATED RESOURCES
UPCOMING EVENTS
We are taking a short break, but please plan to join us at one of our future programs that is a little farther in the future.