February 4, 2022
Benchmarking Labor Efficiency and Productivity
by Michael Langemeier
![]()
![]()
![]()
![]()
![]()
Labor costs are one of the most prevalent costs on a farm. As such, farm managers need to evaluate whether they are utilizing labor efficiently and productively. One way to evaluate this issue is to use benchmarks created using data from similar farms. Labor benchmarks should include family and operator labor as well as hired labor. In this article, labor efficiency and productivity measures are illustrated for a case farm in west central Indiana and compared to benchmark targets. In doing so, this article updates information contained in Langemeier (2015, 2018).
Labor Benchmarks
This article focuses on two labor benchmarks: labor efficiency (a cost measure) and labor productivity (an output measure). Labor efficiency is computed by dividing total labor cost (hired labor plus family and operator labor) by gross revenue. Hired labor cost and gross revenue can be found on the farm’s income statement. Family and operator labor can be represented by family withdrawals, which can be found on the farm’s sources and uses of funds statement. Labor productivity is computed by dividing gross revenue by the number of workers. If all of the employees, including the operator or operators, are fully employed, it is relatively easy to compute the number of workers. It is relatively more difficult to compute this figure when employing part-time or seasonal workers. If some of the hired labor is seasonal or part-time, the total months worked by all hired and seasonal employees should be summed and then divided by 12 to arrive at the number of workers.
If labor cost in relation to gross revenue is relatively high and labor productivity is relatively low, it may indicate that the farm is going to have difficulty supporting all of the farm employees. Timeliness of operations should be incorporated into the evaluation of whether a farm has excess labor. Conversely, if labor cost in relation to gross revenue is relatively low and labor productivity is relatively high, it is important to check the efficiency of machinery use. Sometimes a farm will be efficient with respect to labor, but have relatively high machinery cost and investment benchmarks, or be inefficient with respect to labor, but have relatively low machinery benchmarks. Ideally, a farm would like to be competitive with respect to both labor and machinery.
In addition to analyzing whole-farm labor efficiency and productivity, it is common to also evaluate labor cost per unit for specific enterprises. For crop enterprises, we can use labor cost per acre and labor hours per acre, while for livestock enterprises we can use dollars per animal and labor hours per animal (e.g., dollars per beef cow and labor hours per beef cow).
Case Farm Example
Labor efficiency and productivity for a case farm in west central Indiana is presented in table 1. This case farm has 1500 acres of corn and 1500 acres of soybeans. The number of workers represents the operator, one full-time hired employee, and several part-time employees. Labor efficiency for this farm is approximately 4.0 percent. Gross revenue per worker is approximately $1,390,000 for the case farm. Information available from farm management association programs in Illinois, Kansas, and Minnesota suggest that for this size and type of farm, labor efficiency should be below 10 percent and labor productivity should be above $500,000 per worker. The benchmark values for the case farm achieved these targets. As noted above, this farm should also check its machinery benchmarks to determine whether it is doing a good job of controlling both machinery and labor costs.
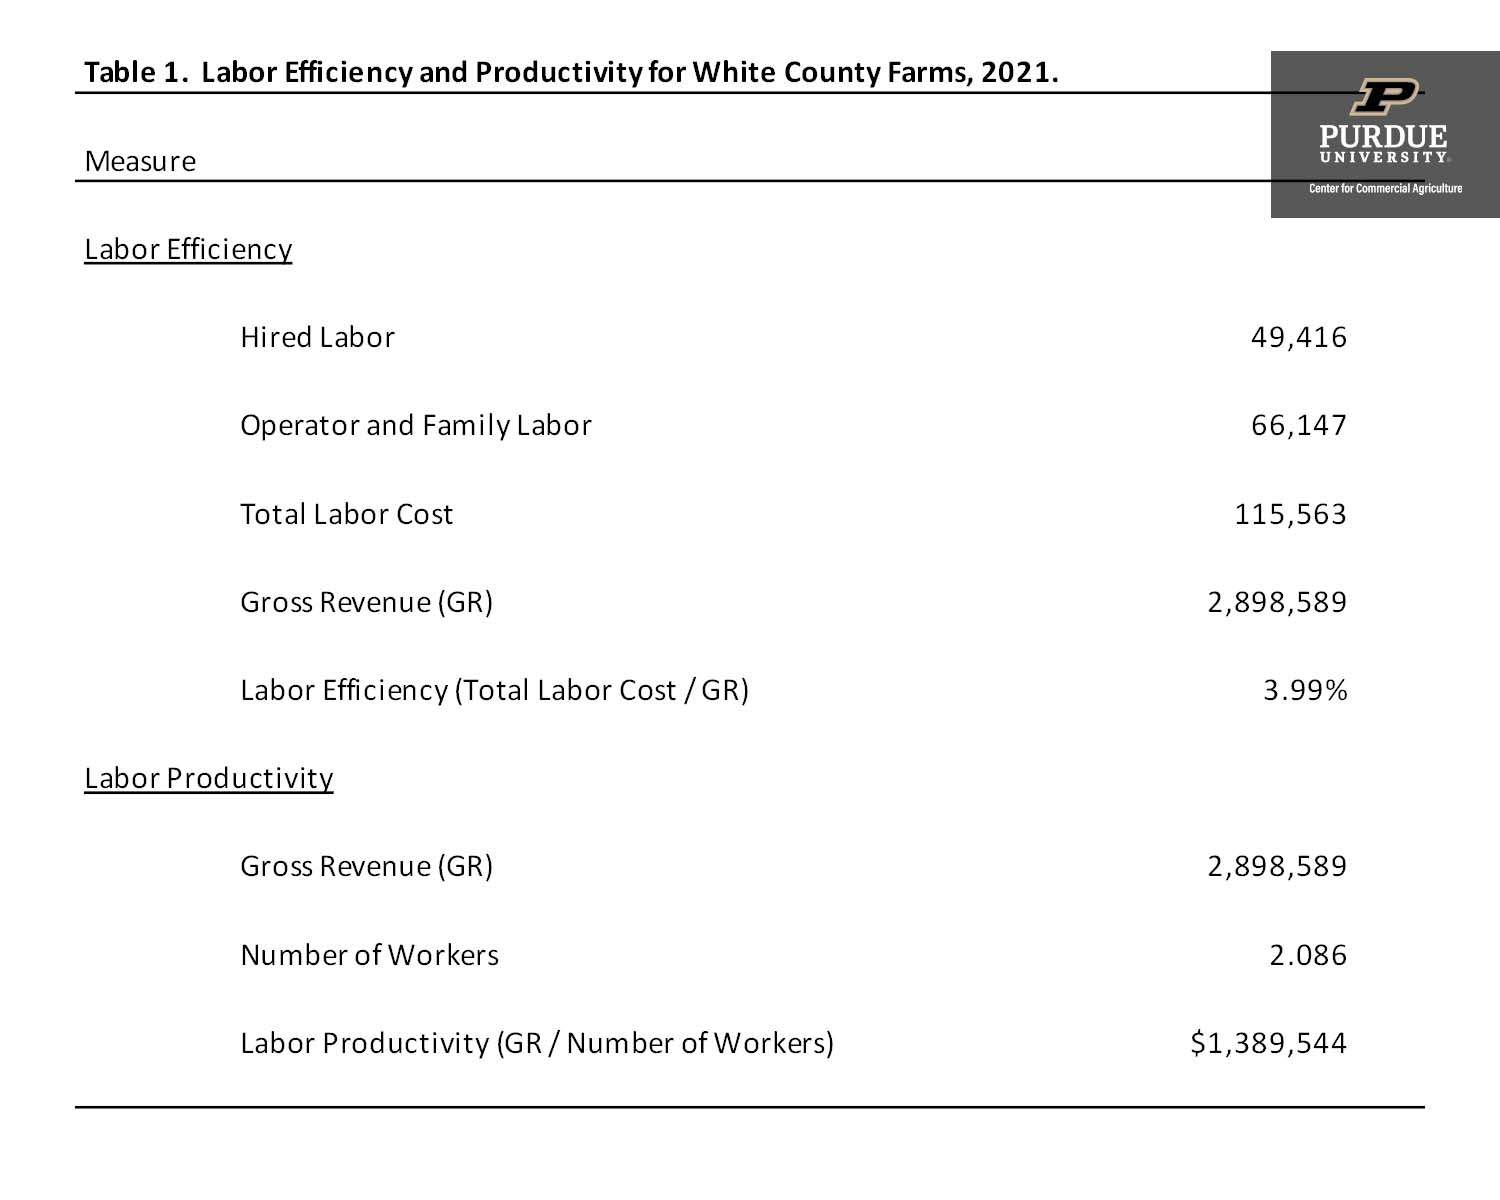
Table 1. Labor Efficiency and Productivity for White County Farms, 2021.
Using the total labor cost in table 1 and dividing by 3,000 acres, labor cost per crop acre was approximately $38.50 for the case farm. Using FINBIN data (University of Minnesota) for 2020, the average labor cost per acre for corn and soybeans were $68.50 and $44.75, respectively. If we average the FINBIN values for corn and soybeans, we obtain an average labor cost per crop acre of $56.60. Using the FINBIN data, average estimated labor hours for corn and soybeans were approximately 2.1 hours. In summary, the per acre labor costs for the case farm were below the FINBIN benchmarks.
Summary
This article defined, described, and illustrated labor efficiency and productivity measures for a case farm. The case farm had labor benchmarks that met the specified targets. It would be prudent for the case farm to also evaluate crop machinery benchmarks. For some farms, labor benchmarks are solid because of the relatively high investment in machinery and equipment, and facilities. For more discussion of crop machinery benchmarks see Langemeier (2021).
Citations
Center for Farm Financial Management, University of Minnesota, FINBIN web site, accessed January 28, 2022.
Langemeier, M. “Benchmarking Labor Efficiency and Productivity.” farmdoc daily (5):163, Department of Agricultural and Consumer Economics,” University of Illinois at Urbana-Champaign, September 4, 2015.
Langemeier, M. “How Can I Improve Labor Productivity?” Center for Commercial Agriculture, Department of Agricultural Economics, Purdue University, September 12, 2018.
Langemeier, M. “Benchmarking Crop Machinery Cost and Investment.” Center for Commercial Agriculture, Department of Agricultural Economics, Purdue University, October 28, 2021.
![]()
![]()
![]()
![]()
![]()
TAGS:
TEAM LINKS:

RELATED RESOURCES
UPCOMING EVENTS
We are taking a short break, but please plan to join us at one of our future programs that is a little farther in the future.