April 19, 2022
Trends in General Inflation and Farm Input Prices
by Michael Langemeier
![]()
![]()
![]()
![]()
![]()
Most of the recent discussion involving input price changes in U.S. production agriculture has focused on fertilizer prices. For example, a recent article (Schnitkey et al., 2022) discussed high fertilizer prices in the context of the Ukraine-Russia conflict. Numerous factors are responsible for the surge in fertilizer prices. Each input used in production agriculture and in other industries has its own set of supply and demand fundamentals. However, input prices can also be affected by changes in general inflation. This article compares and contrasts trends in general inflation with input price changes in U.S. production agriculture.
Long-Term Relationships
Before discussing long-term relationships between general inflation and farm input prices, it is important to define key terms. Inflation represents the decline in purchasing power of a currency over time (Investopedia, 2022). Quantitative estimates of the rate of inflation are typically made by examining the increase or decrease in the price levels of a basket of selected goods. Inflation measures include the consumer price index and implicit price deflators. Though computed using different methodologies, inflation measures are highly correlated over time. Most economists would agree that an increase in the supply of money is the root cause of inflation. Inflation mechanisms can be classified into three types: demand-pull inflation, cost-push inflation, and built-in inflation (Investopedia, 2022). When an increase in the money supply increases overall demand more than the productive capacity of an economy, we have demand-pull inflation. When production costs increase prices, we have cost-push inflation. Quality improvements and technological change are often incorporated into cost-push inflation. Quality improvements would increase prices while technological change tends to reduce prices. Finally, when individuals expect current inflation rates to continue in the future, we have built-in inflation. In general, the longer above average inflation rates persist, the more important built-in inflation becomes. All three of these types of inflation mechanisms are contributing to the recent surge in inflation. It is important to note that inflation has been particularly high in the U.S. compared to other countries. A recent publication from the Federal Reserve Bank of San Francisco discusses why this is the case (Jorda et al., 2022). According to the authors of the article, recent increases in inflation in the U.S. are due to problems with global supply chains and changes in spending patterns due to COVID-19 as well as fiscal support measures designed to counteract the economic effect of the pandemic (i.e., demand-pull inflation).
As noted above, input price changes in production agriculture and other industries are due to general inflation and its mechanisms as well as supply and demand fundamentals specific to a particular input. Having said that, some inputs are more closed aligned or correlated with general inflation than other inputs.
Using information for the 1973 to 2021 period from the Federal Reserve Bank of St. Louis on inflation rates and farm input price indices from USDA-NASS, we examined the correlation between the implicit price deflator for personal consumption expenditures and agricultural production items (i.e., general input price index for production agriculture), feed, seed, fertilizer, fuels, labor, and machinery. The correlation coefficient between the implicit price deflator and agricultural production items was 0.594. The average annual rate of change over the period was similar for the implicit price deflator and agricultural production items (approximately 3.5 percent). The average annual price changes for labor (4.4 percent) and machinery (5.1 percent) were significantly higher than the average increase in the implicit price deflator. In terms of the six specific input categories examined, the only correlation between the implicit price deflator and the input price change that was not significantly different from zero was the correlation between the implicit price deflator and feed prices. The correlations between the implicit price deflator and labor and machinery were relatively higher than the correlation between the implicit price deflator and general farm price index (i.e., agricultural production items). This is an important result because it suggests that input prices for labor and machinery more closely follow trends in general inflation than input prices for items such as feed, seed, fertilizer, and fuels.
Relative variability can be measured using the coefficient of variation which is computed by dividing the standard deviation by the average. The coefficient of variation for the rate of change in agricultural production items was almost double the coefficient of variation for the implicit price deflator. The coefficients of variation for feed, fertilizer, and fuels were higher than the coefficient of variation for the more general farm input price index (i.e., agricultural production items). The input price index for labor was smaller than the coefficient of variation for general inflation.
Historical Trends in General Inflation and Farm Input Prices
This section will compare and contrast the 1-year, 5-year, and 10-year averages for the implicit price deflator for personal consumption expenditures and farm input prices. Data for the implicit price deflator was obtained from the Federal Reserve Bank of St. Louis. Data for all of the farm inputs except fertilizer and diesel were obtained from USDA-NASS. Fertilizer and diesel price data were obtained from USDA-AMS.
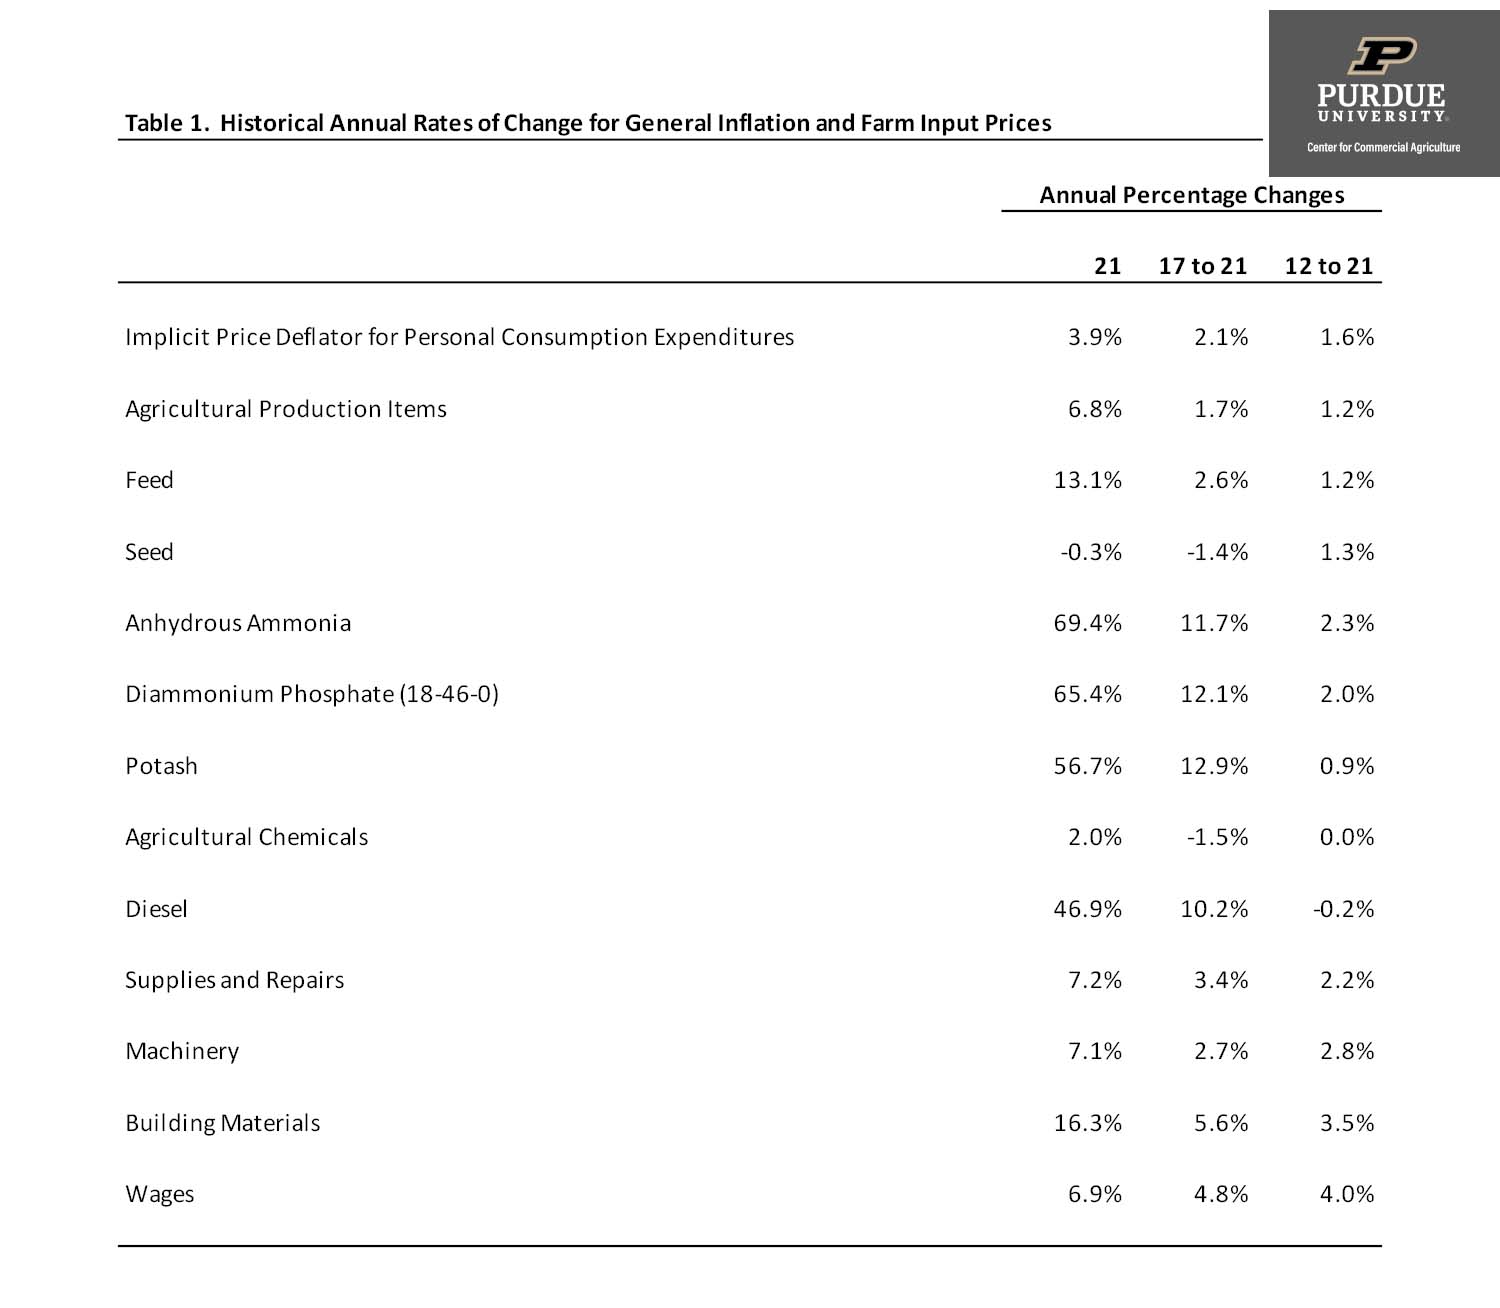
Table 1. Historical Annual Rates of Change for General Inflation and Farm Input Prices
Table 1 presents the average price changes for inflation and farm inputs for the 2012 to 2021 period, for the 2017 to 2021 period, and for 2021. The first thing that becomes immediately apparent is how much higher inflation was in 2021 compared to the 5-year and 10-year averages. The 10-year average inflation rate was only 1.6 percent.
Now let’s compare the rate of general inflation to annual farm input price changes. For the annual change from 2020 to 2021 (labeled 2021 in table 1), the input price changes for all of the farm inputs except for seed and agricultural chemicals were higher than the annual change in the implicit price deflator for personal consumption expenditures. Annual price changes for energy and fertilizer were particularly large. The annual price change for diesel was 47 percent. The annual price changes for fertilizer ranged from 57 percent for potash to 70 percent for anhydrous ammonia. Turning to the 10-year averages, the only farm inputs with price changes exceeding that of the implicit price deflator were those corresponding to anhydrous ammonia, diammonium phosphate, supplies and repairs, machinery, building materials, and wages. Except for 10-year average price changes for building materials (3.5 percent) and wages (4.0 percent), none of the 10-year average price changes exceeded 3 percent. The results in table 1 illustrate how much of an outlier the price changes in 2021 were compared to the long-run averages.
Recent Trends in General Inflation and Farm Input Prices
Due to surges in prices in the last few months, the averages for 2021 in the previous section underestimate recent phenomena. To compensate for this fact, we computed average price changes using the latest available 12 months of data for inflation and the farm inputs discussed in the previous section. The results are illustrated in figure 1. All of the price changes illustrated in figure 1 were computed using data from February 2021 and February 2022. The percentage change in the implicit price deflator was 6.4 percent. We have not experienced this level of inflation in the U.S. since 1981. The price changes for seed and wages were below the annual price change for the implicit price deflator. The price changes for the other farm inputs displayed in figure 1 were greater than 10 percent, with anhydrous ammonia leading the charge with a year to year increase of 179 percent. A 100 percent increase represents a doubling of price, thus the prices of anhydrous ammonia and potash more than doubled in the last 12 months. The results in figure 1 can be used to help explain why the breakeven prices for corn and soybeans are expected to increase approximately 25 and 15 percent, respectively, from 2021 to 2022.
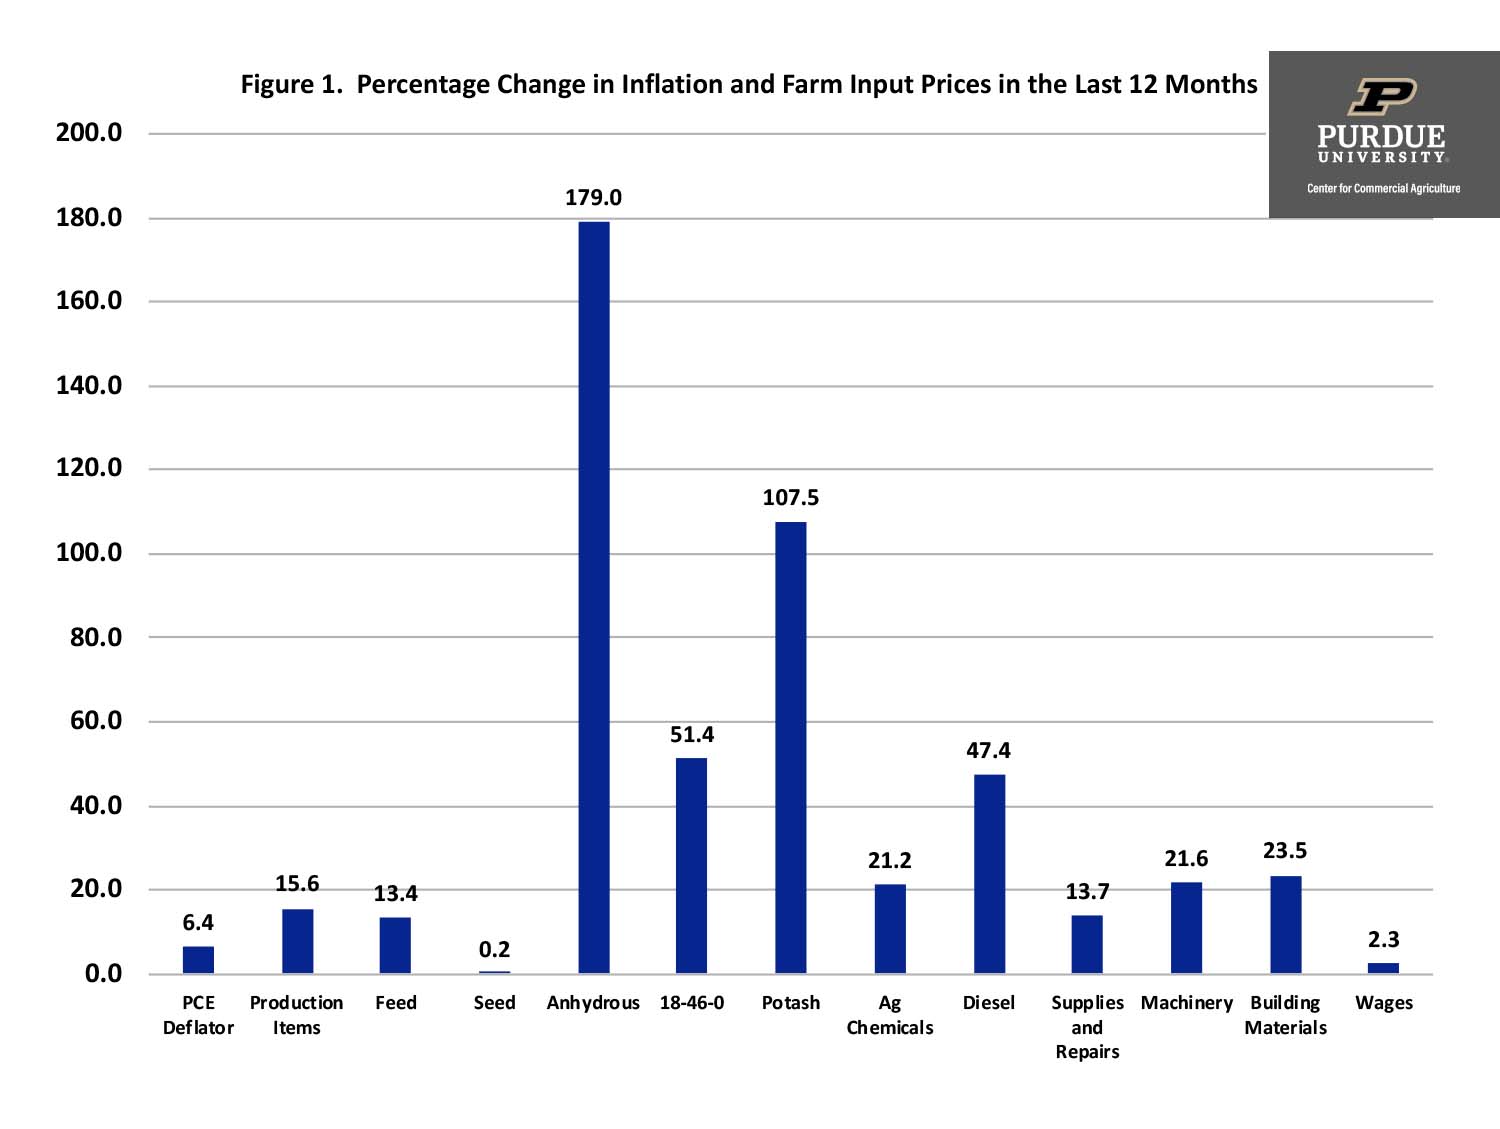
Figure 1. Percentage Change in Inflation and Farm Input Prices in the Last 12 Months
Concluding Comments
This article discussed trends in general inflation and farm input prices. Over long periods of time, farm input prices are significantly correlated with general inflation. However, farm input prices are by no means perfectly correlated with general inflation. Each input has its own supply and demand fundamentals. Farm input price indices for machinery and labor were more correlated with general inflation than feed, seed, fertilizer, and fuels.
Of the input prices examined, only seed and wages had a rate of change during the last 12 months that was lower than the rate of change for general inflation. Agricultural production items, a general index for farm input prices, increased 15.6 percent or more than double the general inflation rate. Input prices changes for energy and fertilizer products were particularly large. During the last 12 months, diesel prices increased 47 percent. Increases in fertilizer prices ranged from 51 percent for diammonium phosphate to 179 percent of anhydrous ammonia.
Citations
Federal Reserve Bank of St. Louis. FRED Economic data, accessed on April 15, 2022. https://fred.stlouisfed.org/
Fernando, J., M.J. Boyle, and P. Rathburn. “Inflation.” Investopedia, Updated January 12, 2022. https://www.investopedia.com/terms/i/inflation.asp
Jorda, O., C. Liu, F. Nechio, and F. Rivera-Reyes. “Why is U.S. Inflation Higher than in Other Countries?” Federal Reserve Bank of San Francisco, Economic Letter, 2022-07, March 28, 2022.
Schnitkey, G., N. Paulsen, K. Swanson, J. Colussi, J. Balz, and C. Zulauf. “Nitrogen Fertilizer Prices and Supply in Light of the Ukraine-Russia Conflict.” farmdoc daily. (12):45, Department of Agricultural and Consumer Economics, University of Illinois at Urbana-Champaign, April 5, 2022.
USDA-AMS. Illinois Production Reports, accessed on April 15, 2022. https://fred.stlouisfed.org/
USDA-NASS. Quick Stats, accessed on April 15, 2022. https://quickstats.nass.usda.gov/
![]()
![]()
![]()
![]()
![]()
TAGS:
TEAM LINKS:

RELATED RESOURCES
UPCOMING EVENTS
We are taking a short break, but please plan to join us at one of our future programs that is a little farther in the future.