October 6, 2022
U.S. Farm Sector Balance Sheet
by: Michael Langemeier
![]()
![]()
![]()
![]()
![]()
U.S. farm equity in 2022 is 27.7% higher than it was in 2017 and 42.7% higher than it was in 2012. During the last 10 years, net farm income was above the long-run average (i.e., average from 2007 to 2022) from 2012 to 2014, and in 2021 and 2022, but below the long-run average from 2013 to 2020. Thus, the increase in farm equity is due to more than relatively high net farm income. This article discusses changes in in the U.S. farm sector balance sheet as well as liquidity and solvency ratios.
Trends in Real Assets and Debt
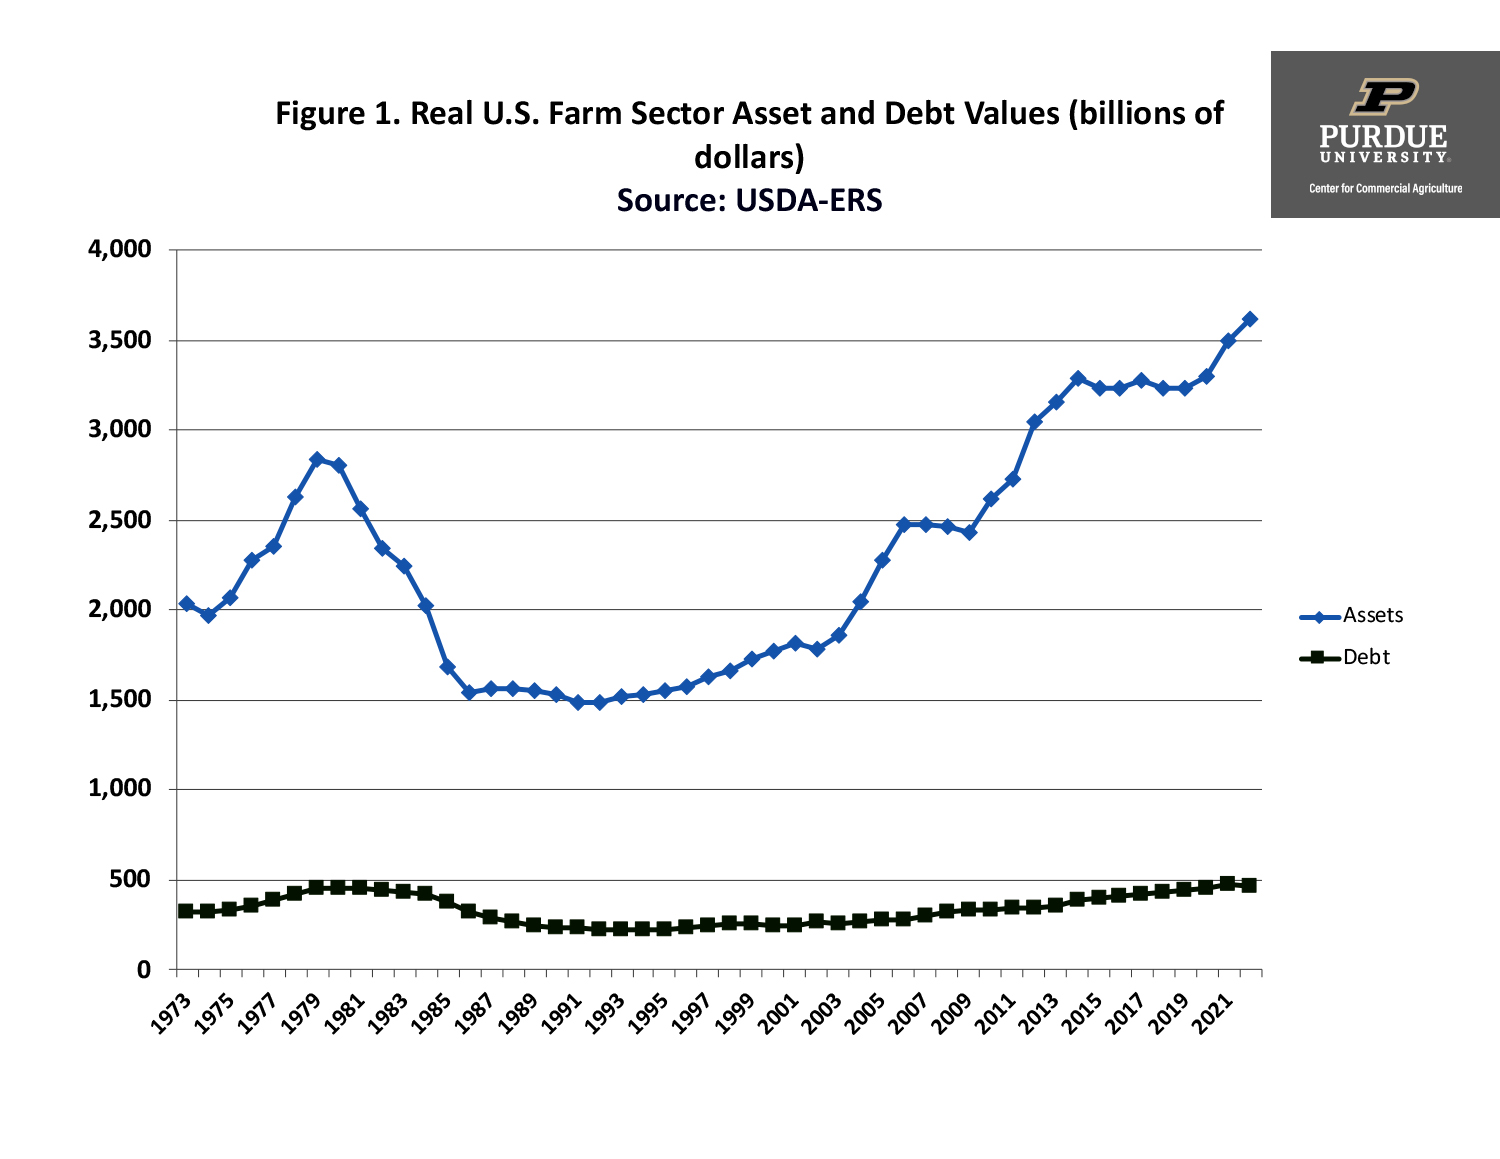
Figure 1. Real U.S. Farm Sector Asset and Debt Values (billions of dollars)
Before analyzing the farm sector’s current balance sheet, we will review trends in real assets and real debt. Figure 1 presents real U.S. farm sector assets and debt values using 2021 as the base year. With the exception of 2022, the values for each year represent end of year values. Prior to 2012, the peak in real assets occurred in 1979 at a value of $2.837 trillion. In 2012, real assets for the farm sector totaled $3.048 trillion. Since 2012, real assets have exceeded $3 trillion. Real assets are projected to reach a new peak at $3.618 trillion in 2022. This represents a 3.4% increase from the previous peak in 2021.
Real farm sector debt in 2022 is projected to be $467.9 billion, a decrease of 1.3% from the year before. If realized, the decline in real farm debt in 2022 would represent the first decline in total debt since 2012. Current farm sector debt is 36.1% higher than the value in 2012 and 10.0% higher than the value in 2017.
Projected farm sector equity in 2022 is $3.150 trillion, which represents a 4.2% increase from the year before. Real farm sector equity in 2022 is 16.5% higher than the value in 2012 and 10.6% higher than the value in 2017.
Farm Sector Balance Sheet
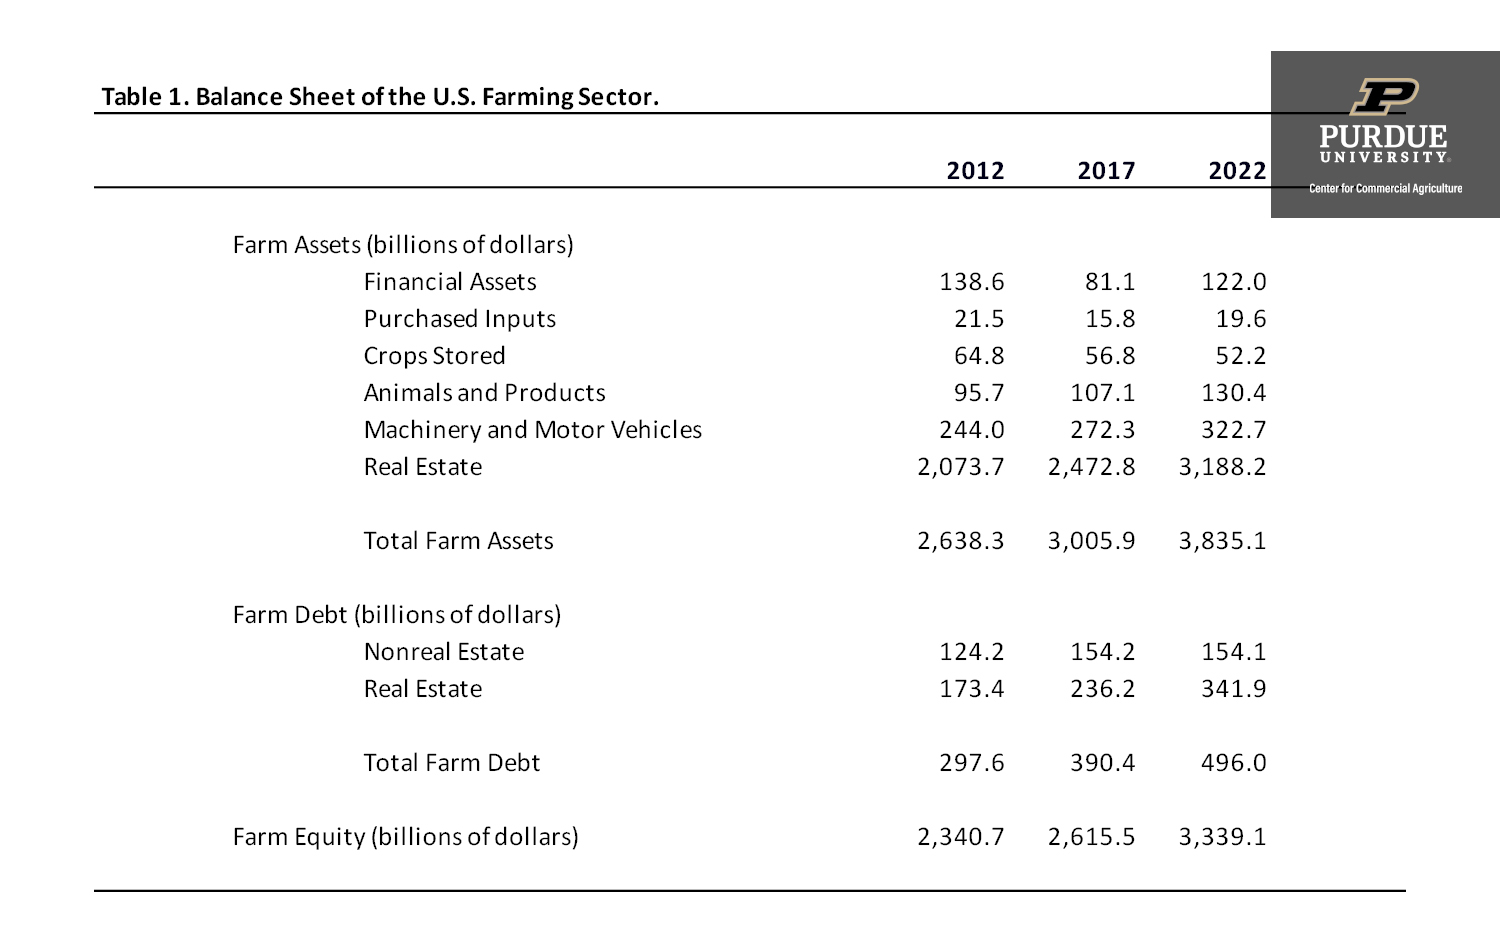
Table 1. Balance Sheet of the U.S. Farming Sector.
Table 1 presents the U.S. farm sector balance sheet for 2012, 2017, and 2022. The values in table 1 represent nominal values rather than inflation-adjusted values. The 2012 and 2017 balance sheets represent end of the year balance sheets. The 2022 balance sheet represents forecasted values, which were updated on September 1, 2022.
Projected 2022 values for animals and products, machinery and motor vehicles, and real estate were higher than their respective values in 2012 and 2017. In contrast, the values for financial assets, purchased inputs, and crops stored were higher in 2012 than they were in 2022. The increase in real estate values during the last 10 years is particularly noteworthy. The value of real estate was 53.7% higher in 2022 than it was in 2012.
Total farm debt in 2022 was 66.7% higher than total farm debt in 2012. Most of the increase can be attributed to an increase in real estate debt, which grew by 97.2%. Despite the fact that net farm income from 2013 to 2020 was below the long-run average, farm equity in 2022 was 42.7% higher than it was in 2012.
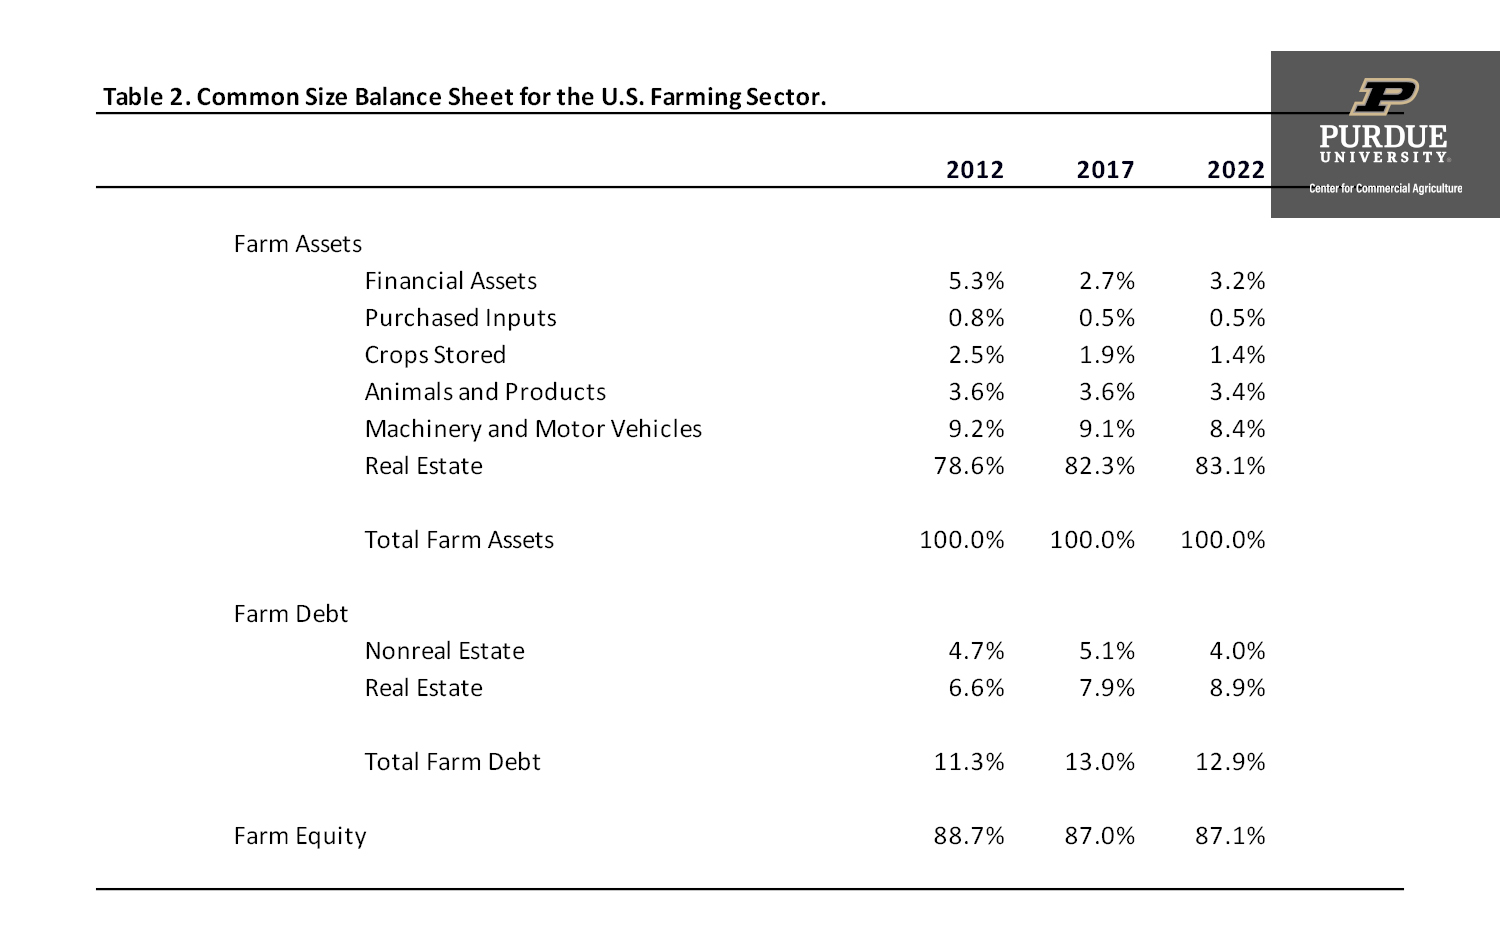
Table 2. Common Size Balance Sheet for the U.S. Farming Sector.
A common size balance sheet for the U.S. farm sector is presented in table 2. Common size balance sheets use percentages rather than actual dollars and are useful when comparing balance sheets across farms or years. The percentage of assets accounted for by financial assets, purchased inputs, crops stored, and animals and products were 12.2% in 2012, 8.7% in 2017, and 8.5% in 2022. Machinery and motor vehicles were from 8.4% to 9.2% of total assets in 2012, 2017, and 2022. Currently, real estate makes up approximately 83% of total assets.
Nonreal estate debt as a percent of total assets in 2022 was smaller than it was 2012. Conversely, real estate debt in 2022 was quite a bit higher as a percent of total assets than it was in both 2012 and 2017. Nonreal estate debt as a proportion of nonreal estate assets is currently 23.8% while real estate debt as a proportion of real estate assets is 10.7%. Total farm debt as percentage of total assets (i.e., the debt to asset ratio) in table 2 ranged from 11.3% in 2012 to 13.0% in 2017. Long-term trends in the debt to asset ratio for the U.S. farm sector will be further discussed below.
Liquidity Ratios
USDA-ERS has been reporting the average current ratio and the average working capital to value of farm production since 2009. Working capital is computed by subtracting current liabilities such as operating debt and the current portion of term debt from current assets such as financial assets, inventories of purchased inputs, and crop and market livestock inventories.
The average current ratio for the farm sector declined from 2.87 in 2012 to 1.59 in 2016, and then increased from 1.63 in 2017 to 2.37 in 2021. The projected current ratio for 2022 is 2.16. A commonly used benchmark for the current ratio is 2. The average working capital to value of farm production ratio declined from 0.37 or 37 percent in 2012 to 0.16 in 2016, 2017, and 2018, and then increased from 0.18 in 2019 to 0.25 in 2021. The projected working capital to value of farm production ratio for 2022 is 0.21 or 21 percent. A commonly used benchmark for this ratio is 20%. Though not extremely high, liquidity ratios in 2022 are much better than the ratios experienced from 2015 to 2020.
Solvency Ratios
Solvency ratios, such as the debt to asset ratio, provide an indication of the farm’s ability to repay all financial obligations if all assets are sold, as well as indication of the ability to continue operations as a viable farm business after a financial adversity, such as drought.
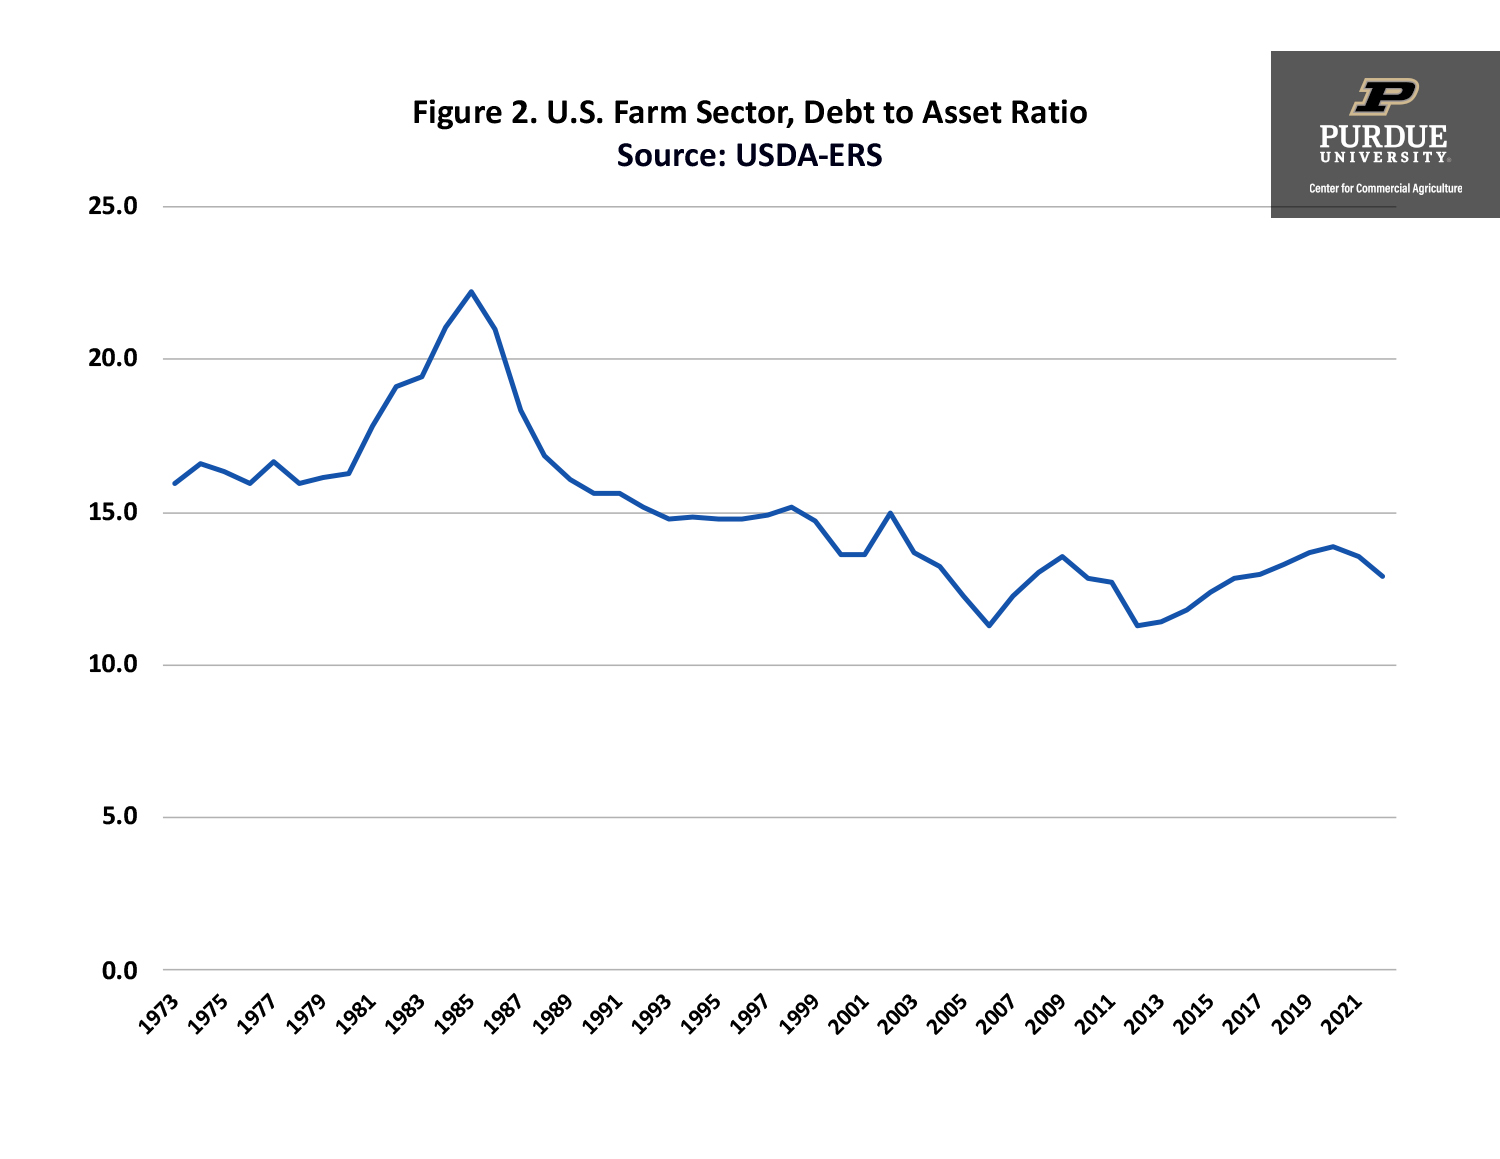
Figure 2. U.S. Farm Sector, Debt to Asset Ratio
Figure 2 illustrates the debt to asset ratio for the U.S. farm sector since 1973. The debt to asset ratio peaked in 1985 at 22.2%. The debt to asset ratio has been below 15% since 1999. The 2022 ratio debt to asset ratio at 12.9% is a full percentage point lower than the debt to ratio in 2020, which represented the highest debt to asset ratio since 2002.
Conclusions
The balance sheet for the U.S. farm sector represents a marked improvement compared to the balance sheet in 2020. The primary reasons for the improved financial conditions are the strong net farm income experienced in 2021 and 2022, and recent increases in land values. At the current time, both liquidity and solvency for the U.S. farm sector are relatively strong.
This article focused on the U.S. balance sheet for the farm sector. Regional changes in the balance sheet are likely quite different than changes at the national level. Differences in regional and the national balance sheet reflect differences in how land values have adjusted over the last several years, and regional differences in enterprise mix. A future article will compare common size balance sheets at the U.S. with those for full-time farms.
References
USDA-ERS. “Farm Income and Wealth Statistics.” www.ers.usda.gov/data-products/farm-income-and-wealth-statistics/, accessed September 19, 2022.
![]()
![]()
![]()
![]()
![]()
TAGS:
TEAM LINKS:

RELATED RESOURCES
UPCOMING EVENTS
We are taking a short break, but please plan to join us at one of our future programs that is a little farther in the future.