November 1, 2022
Prospects for Swine Feed Costs in 2023
by: Michael Langemeier
![]()
![]()
![]()
![]()
![]()
Due to numerous supply and demand factors, projected corn and soybean meal prices for 2022 are substantially higher than those experienced in 2021. Specifically, corn prices are 25 percent higher and soybean meal prices are 11 percent higher. Given that many of the supply and demand factors impacting the 2022 crop are going to persist way into 2023, what are the prospects for feed costs for farrow-to-finish and swine finishing production in the upcoming year? This article examines trends in feed costs as well as the impact of corn and soybean meal prices on feed costs for farrow-to-finish and swine finishing operations.
It is important to note that the swine finishing enterprise represented in this article assumes the finishing of an early-weaned pig. The rations for the farrow-to-finish and swine finishing enterprises consist of corn, soybean meal, dry distillers’ grain, and supplements. Corn prices represent averages for Indiana as reported by USDA-NASS. Soybean meal and distillers’ grain prices are obtained from Feed Outlook, published monthly by USDA-ERS. Information from Agricultural Prices, a monthly USDA-NASS publication, was used to compute supplement prices. Early November futures prices for corn and soybean meal were used to project feed indices through for 2023. Feed cost indices are reported on a closeout month rather than a placement month basis.
Corn and Soybean Meal Prices
Figures 1 and 2 report monthly corn and soybean meal prices from January 2007 to September 2022. Corn price averaged $4.65 per bushel from 2007 to the current month. Soybean meal price averaged $357 per ton from 2007 to the current month. Obviously, current corn and soybean meal prices are well above the long-run average. Corn prices in 2023 are expected to remain relatively high, but are expected to be 5 to 10 percent lower than the average corn price in 2022. Similarly, soybean meal prices are expected to remain above the long-run average. Soybean meal prices in 2023 are expected to drop more than corn prices (i.e., 10 to 15 percent).
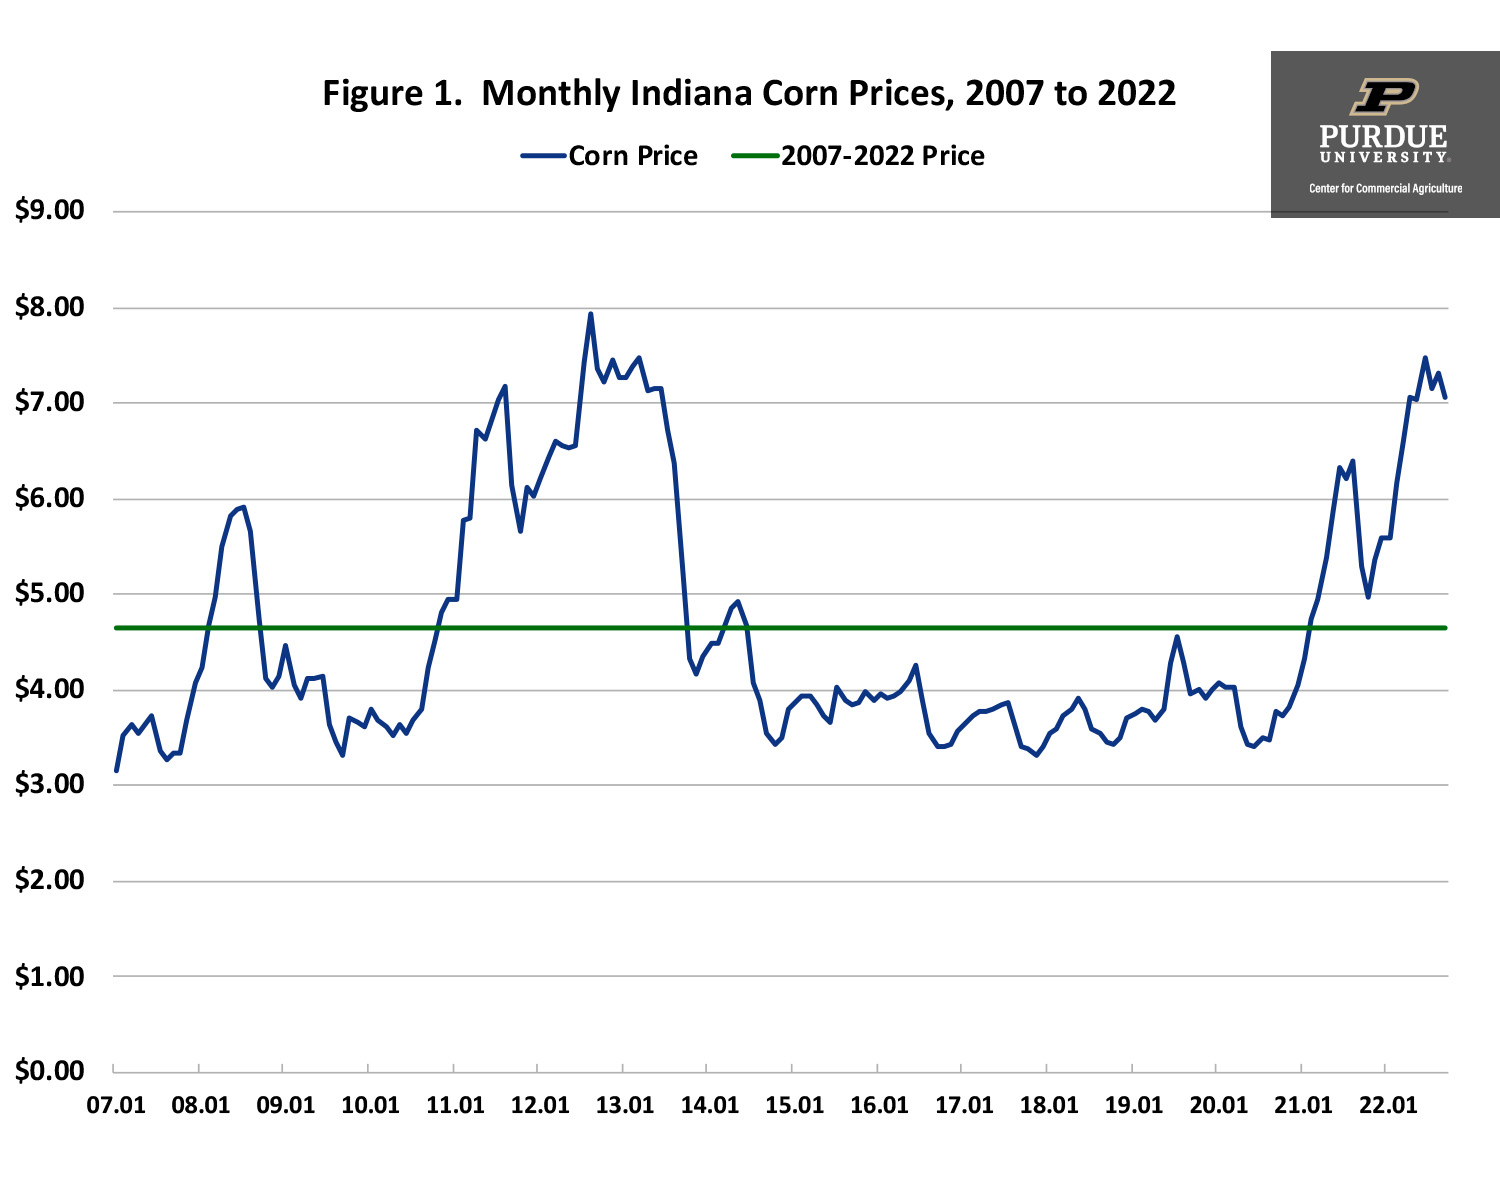
Figure 1. Monthly Indiana Corn Prices, 2007 to 2022
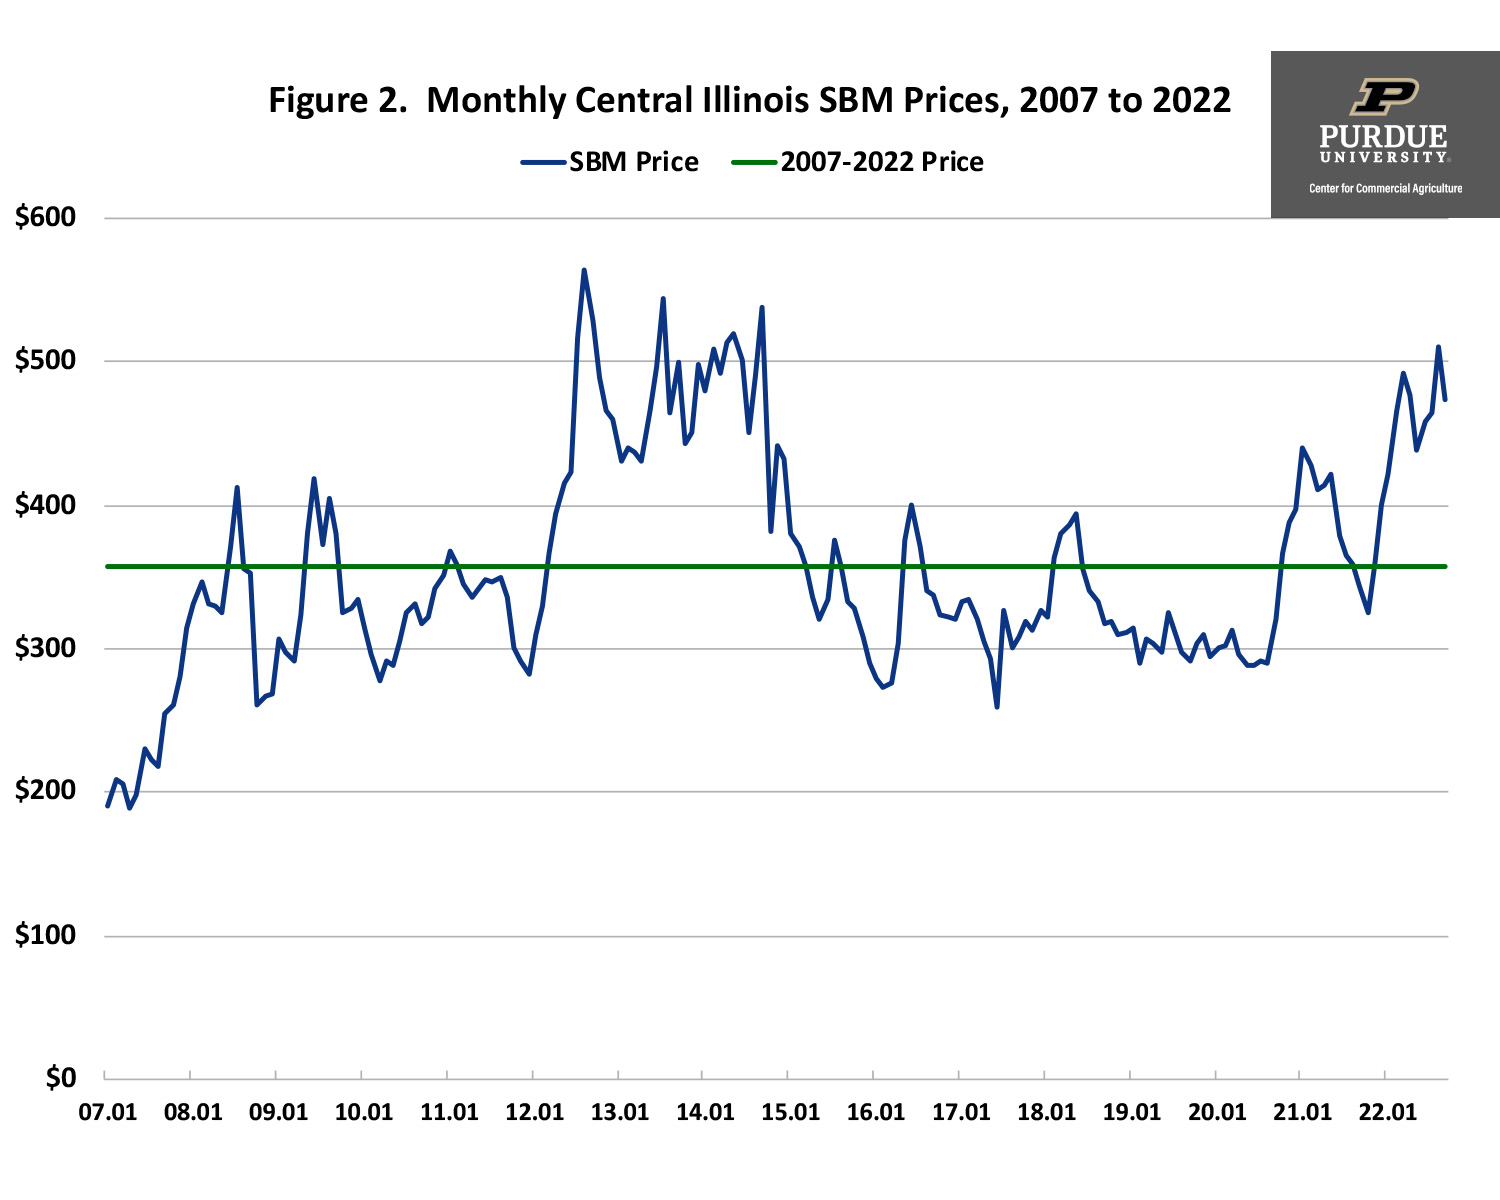
Figure 2. Monthly Central Illinois SBM Prices, 2007 to 2022
Farrow-to-Finish Enterprise
Figure 3 presents monthly farrow-to-finish feed cost indices from January 2007 to October 2022. The latest full year of indices, 2021, has an index of 100 so all indices outside of this year are expressed in relative terms. The average feed cost index since 2007 was 90.9. The projected feed index for 2022 is 123.3, with the average feed cost index during the last quarter of 2022 is expected to range from 134 to 136. The average feed cost index is expected to drop from approximately 131 in the first quarter of 2023 to approximately 126 in the second and third quarters, and 122 in the fourth quarter.
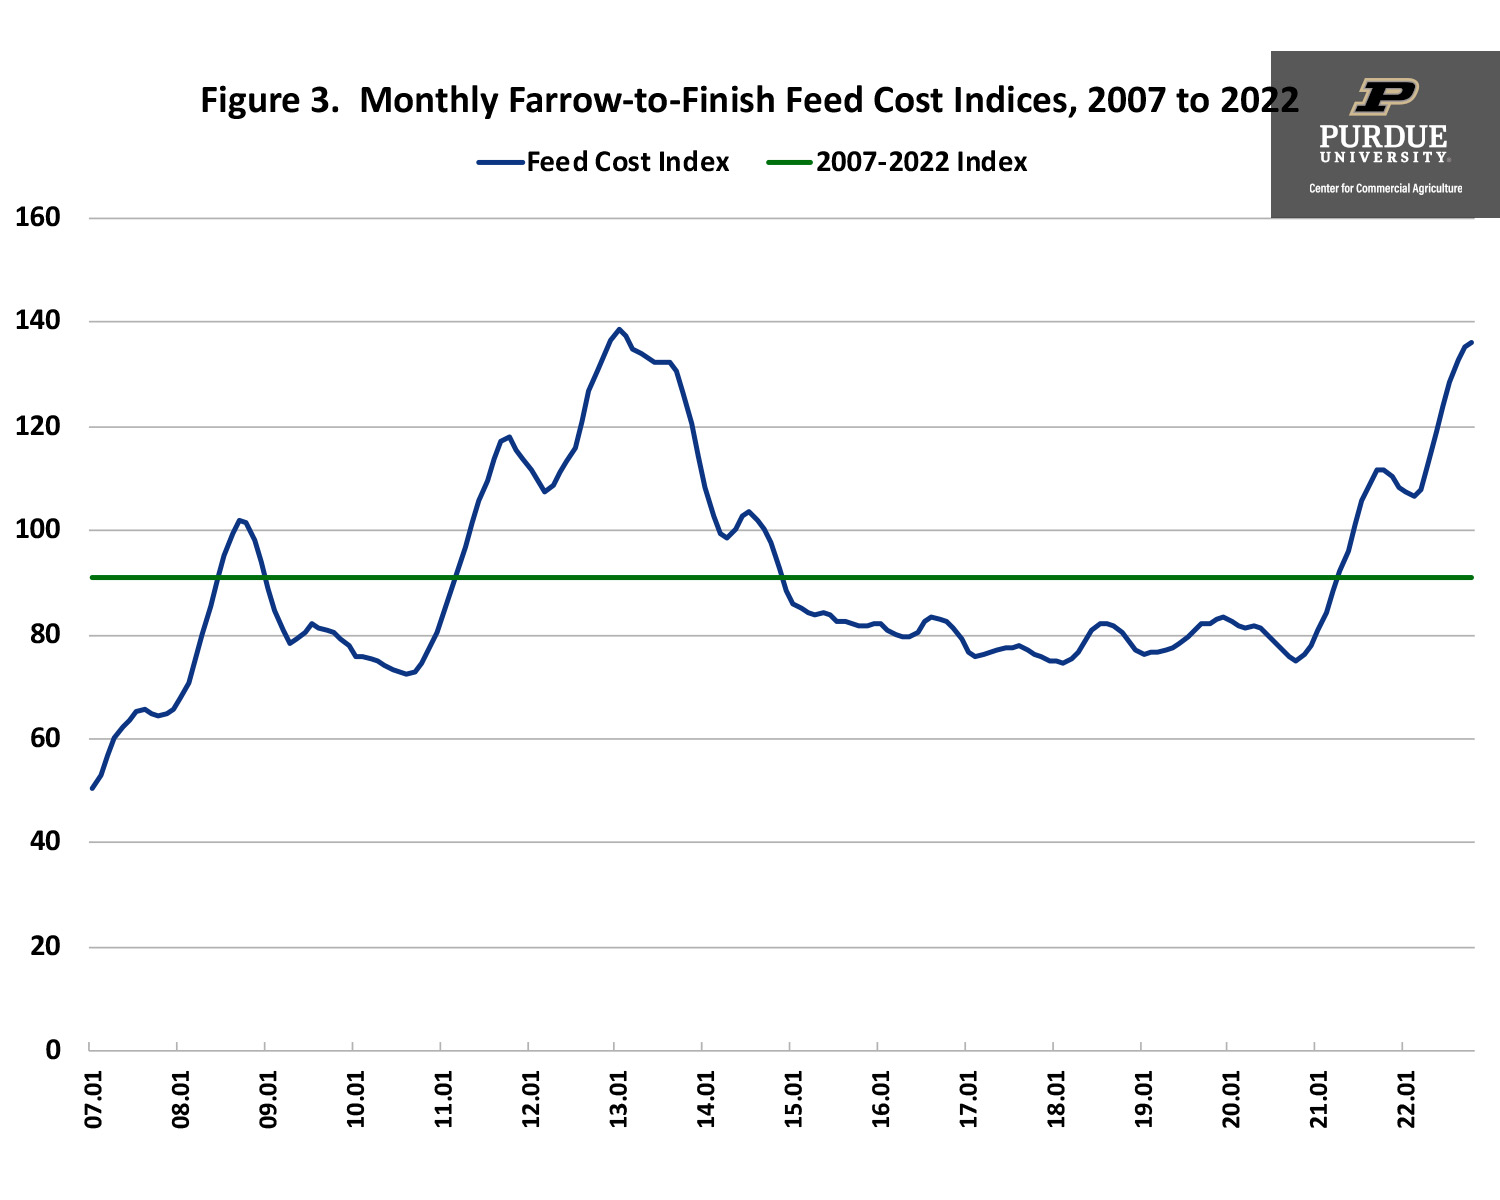
Figure 3. Monthly Farrow-to-Finish Feed Cost Indices, 2007 to 2022
Annual farrow-to-finish feed cost indices are presented in figure 4. The projection for 2023 used corn and soybean meal futures prices in early November. The projected feed cost index for 2023 is 126.4, which indicates that feed costs in 2023 are expected to be 2.5 percent above those experienced in 2022 or 26.4 percent above the average feed costs in 2021. Why is the average feed cost index for 2023 above the average for 2022? To answer this question, we need to remember that corn prices in late 2021 and early 2022, which were used to compute the feed cost indices for the first half of 2022, were substantially lower than current and projected corn prices.
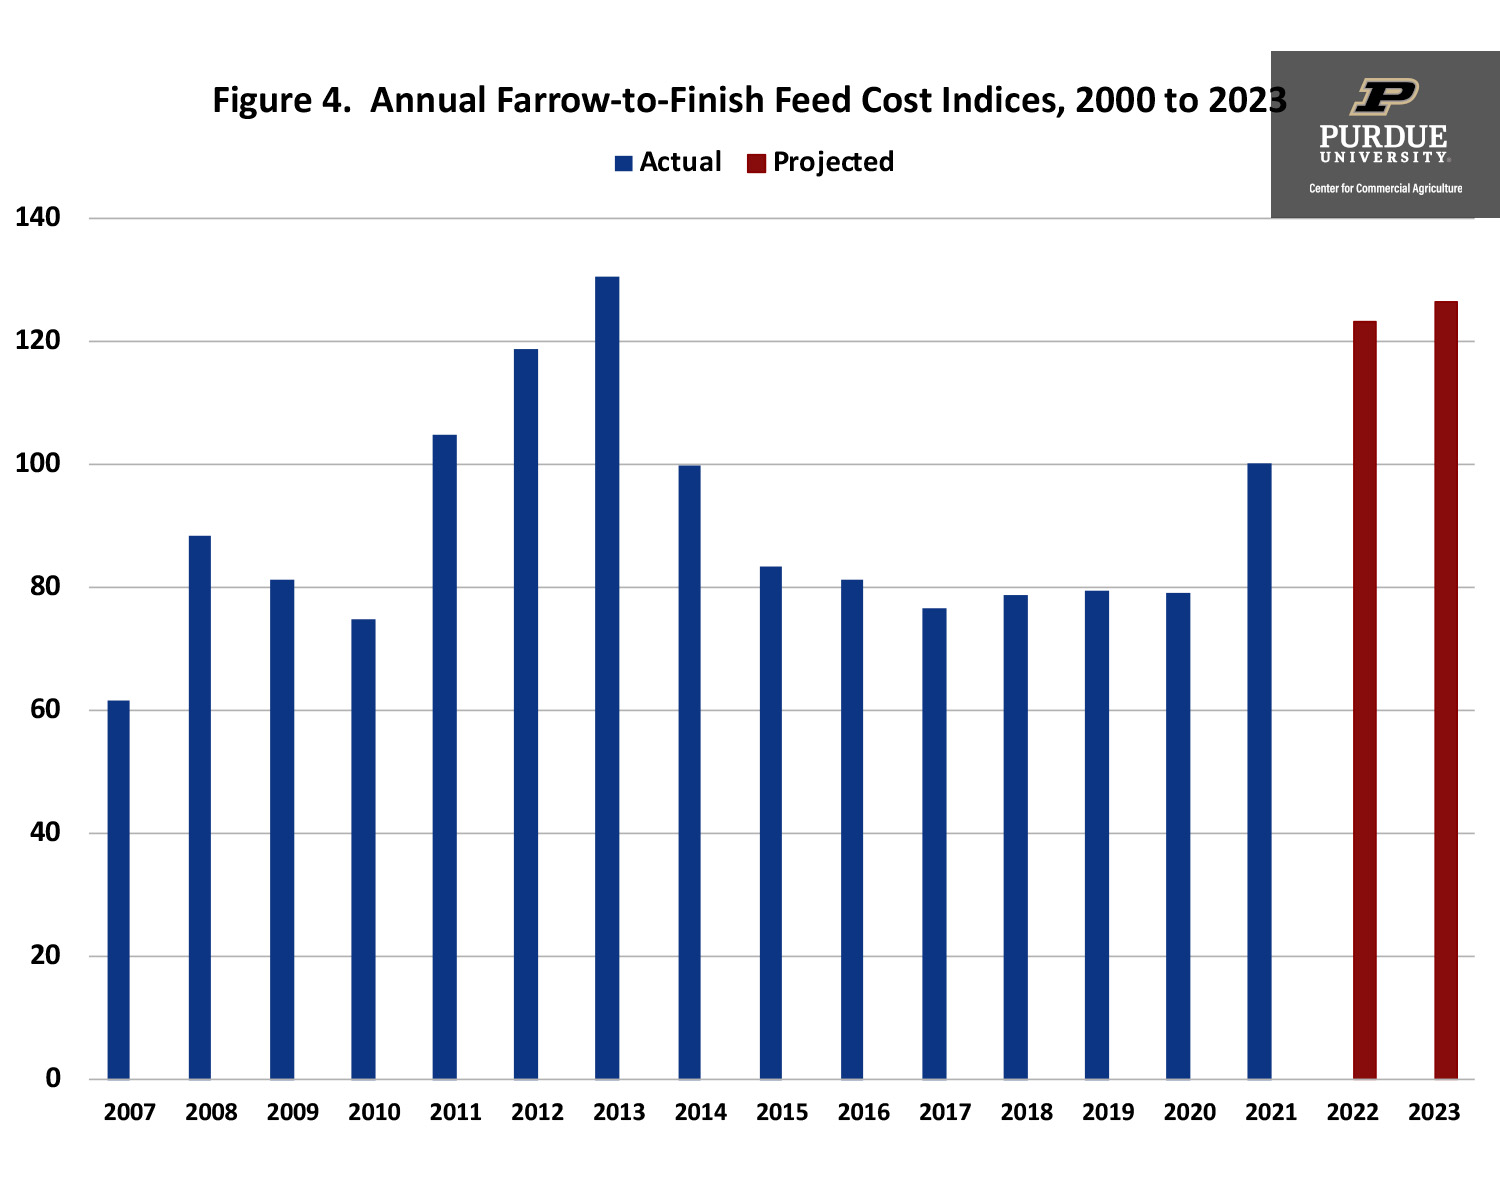
Figure 4. Annual Farrow-to-Finish Feed Cost Indices, 2000 to 2023
Swine Finishing Enterprise
Figure 5 illustrates monthly swine finishing feed cost indices for the January 2007 to October 2022 period. The latest full year of indices, 2021, has an index of 100 so all indices outside of this year are expressed in relative terms. The average index for the period beginning in 2007 was 89.5. The average index for 2022 is projected to be 121.8, with the fourth quarter indices ranging from 131 to 133. Similar to the feed cost index for farrow-to-finish production, the swine finishing feed cost index for 2023 is expected to peak in the first quarter (i.e., index of 127) and drop throughout the rest of the year. The expected index for the fourth quarter of 2023 is approximately 119.
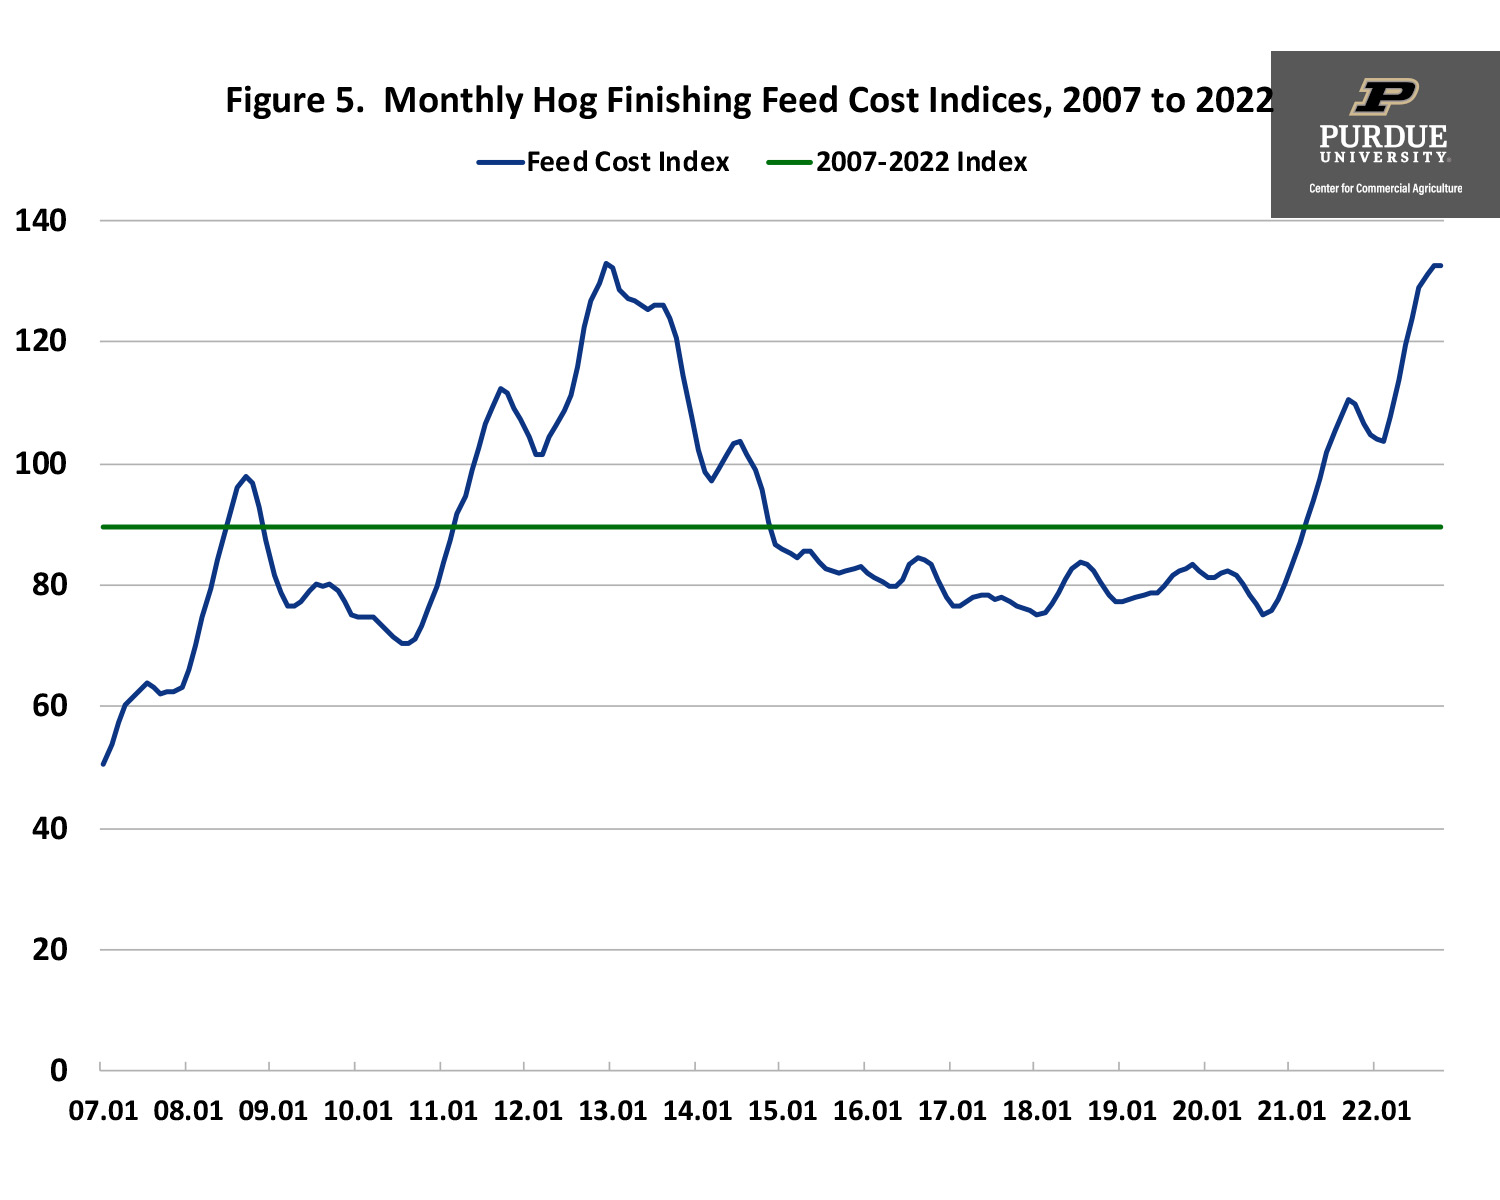
Figure 5. Monthly Hog Finishing Feed Cost Indices, 2007 to 2022
Annual swine finishing feed cost indices are presented in figure 6. The projection for 2023 used corn and soybean meal futures prices in early November. The projected feed cost index is 123.0, so feed costs in 2023 are expected to be 23.0 percent (1.0 percent) above those experienced in 2021 (2022).

Figure 6. Annual Hog Finishing Feed Cost Indices, 2007 to 2023
Using the iFarm price distribution tool, the probability of the corn futures price for July 2023 being below (above) $5.88 ($7.74) was 25 percent on November 2. This represents a spread of more the $2.10 per bushel! The median expected corn price was $6.75 per bushel. Feed costs are very sensitive to changes in corn and soybean meal prices. Regression analysis was used to examine the relationship between swine finishing feed cost, and corn and soybean meal prices during the January 2007 to December 2021 time period. Results are as follows: each 0.10 increase in corn prices increases feed cost per cwt. by $0.41, and each $10 increase in soybean meal prices increases feed cost per cwt. by $0.35. Obviously, a $0.50 increase or decrease in corn price would have a large impact on feed cost per cwt.
Current feed cost is approximately $52.50 per cwt. Table 1 presents feed cost per cwt. for corn prices ranging from $6.50 to $7.50 per bushel, and soybean meal prices ranging from $375 to $475 per ton. This range of prices reflects the range of expected prices for the first 6 months of 2023. At the lower range of prices, feed cost per cwt. would be approximately $44. At the higher range of prices, feed cost per cwt. would be approximately $51.50.
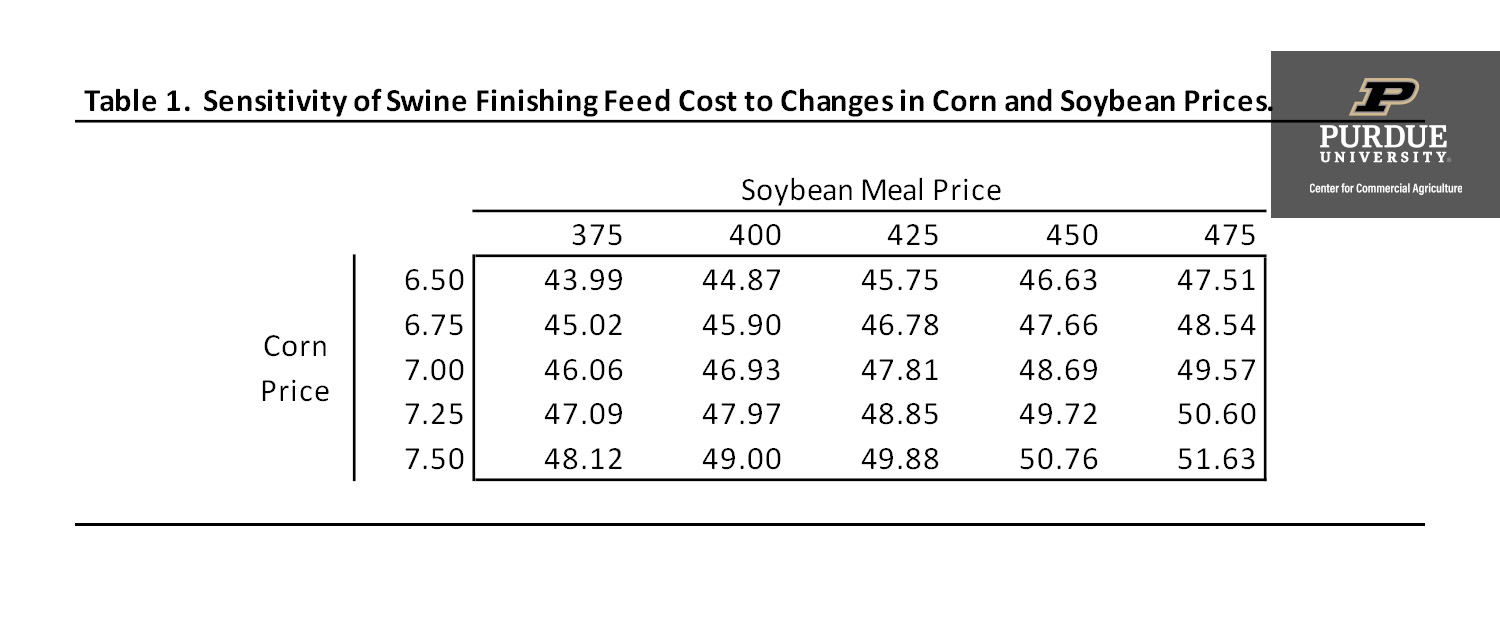
Table 1. Sensitivity of Swine Finishing Feed Cost to Changes in Corn and Soybean Prices.
Conclusions
This article discussed recent trends in feed costs for farrow-to-finish and swine finishing enterprises, and provided projections for 2023. Feed costs in 2023 are expected to be approximately 1 to 3 percent above those experienced in 2022. However, current projections have a wide band around them. Current projections use corn prices, depending on the month, ranging from $6.00 to $6.75, and soybean meal prices ranging from $400 to $475 per ton. Corn and soybean prices will be determined by planted acreage as well as other supply and demand factors. This article also examined the impact of changes in corn and soybean meal prices on swine finishing feed cost. Each $0.10 per bushel change in corn price, changes feed cost by $0.41 per cwt. Similarly, each $10 per ton change in soybean meal price, changes feed cost by $0.35 per cwt.
References
2022 iFarm Price Distribution Tool, University of Illinois, accessed on November 2, 2022.
USDA-NASS. Quick Stats, accessed on November 2, 2022.
![]()
![]()
![]()
![]()
![]()
TAGS:
TEAM LINKS:

RELATED RESOURCES
U.S. farm income in 2026 appears stable, but increased government payments are masking weaker livestock receipts and rising costs. Indiana faces a sharper decline, with net farm income projected to fall 28%, highlighting tighter margins and growing financial pressure heading into 2027.
READ MOREUPCOMING EVENTS
We are taking a short break, but please plan to join us at one of our future programs that is a little farther in the future.