November 23, 2022
River Levels and Barge Rates Impacting Corn and Soybean Basis
by: Nathan Thompson
![]()
![]()
![]()
![]()
![]()
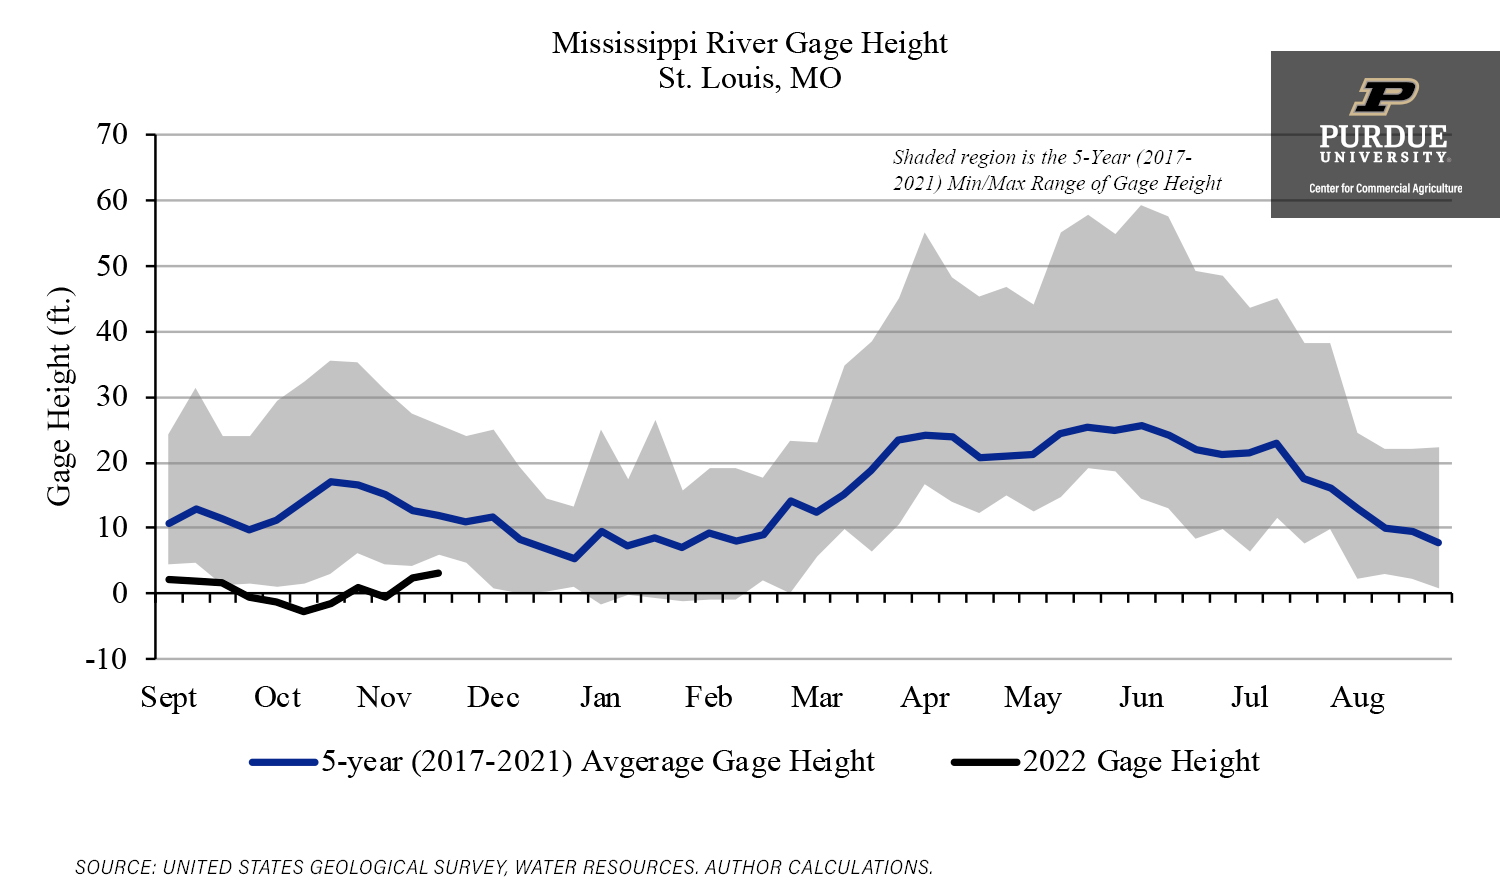
Crop basis levels in many areas have been on a wild ride this fall. Several related factors have contributed to large swings in basis. Most notably, dry conditions in many areas have caused Mississippi River levels to drop. Given that the Mississippi River is the largest US export channel for corn and soybeans, this has big implications for commodities.
For perspective, the gage height of the Mississippi River in St. Louis, MO in October and November has averaged between +10 and +16 feet the past 5 years. During October and November of 2022 gage height at St. Louis has been between -2 and +3 feet. Not only is this lower than the 5-year average, but it is also the lowest level observed in the past 5 years. Similarly, the gage height of the Mississippi River in Memphis, TN in October and November has averaged between +4 and +15 feet the past 5 years. During October and November of 2022 gage height at Memphis has been between -10 and 0 feet. Again, this is the lowest level observed in the past 5 years.

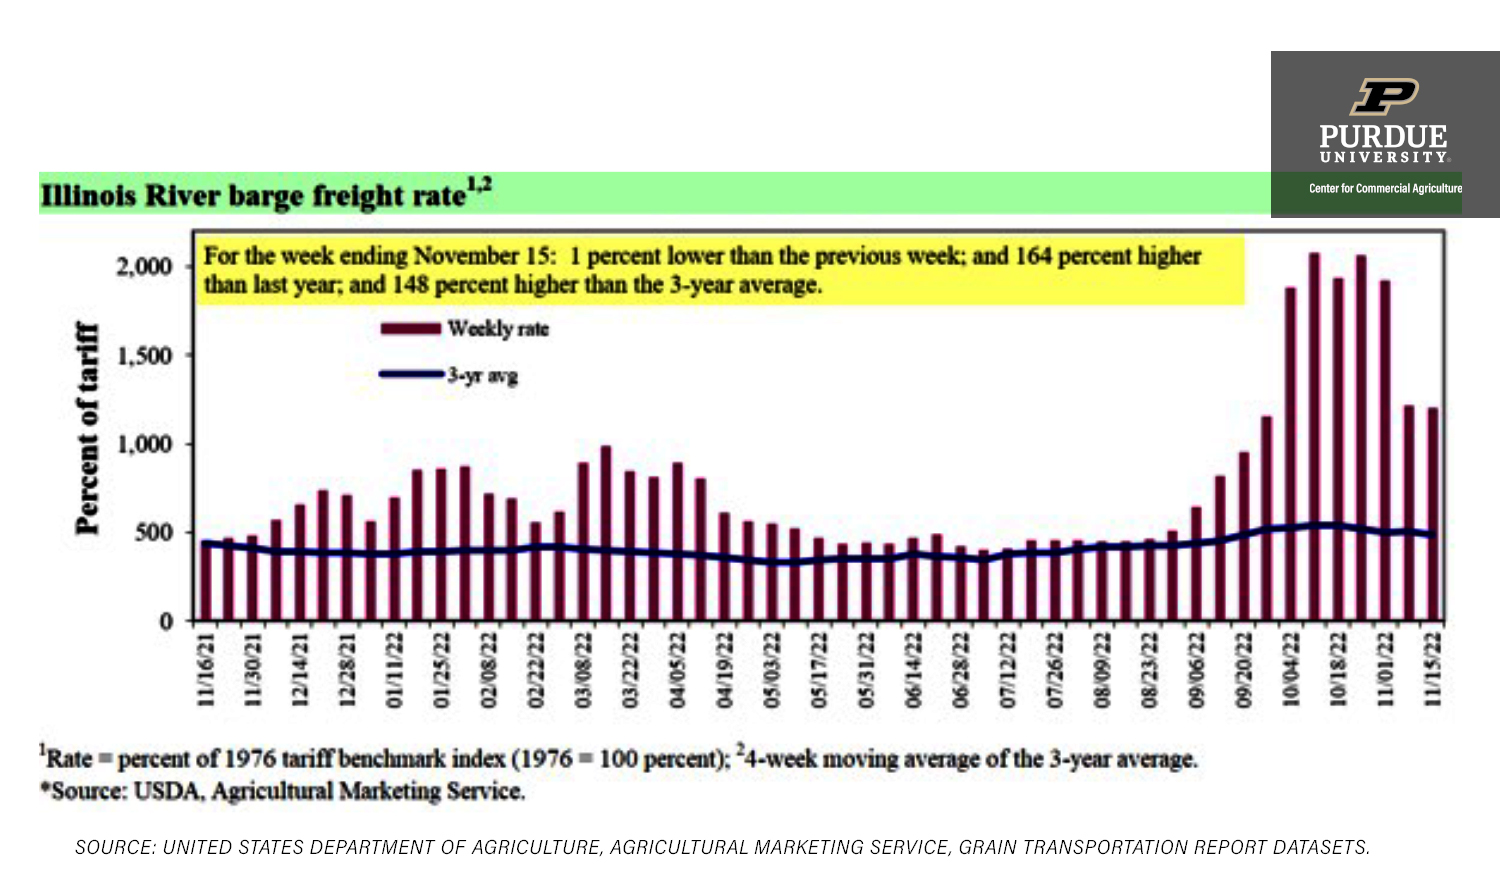
When river levels drop this low, barge navigation is impacted. As a result, barges are loaded at below normal levels to improve draft and navigability. In turn, this means that the cost of transporting grain increases because it takes more barges to transport the same amount of grain. According to USDA, the 3-year average barge freight rate is slightly below 486% of the 1976 tariff benchmark rate (or around $22/ton). However, barge rates rose rapidly at the end of September and into October, reaching levels as high as 2075% of the benchmark rate (or $96/ton). That is over 4 times the 3-year average barge rate.
While river levels have only improved slightly, barge rates have dropped in recent weeks. In the first two weeks of November, barge rates have been slightly over 1200% of the benchmark rate (or $55/ton). However, this is still more than double the 3-year historical average barge rate.
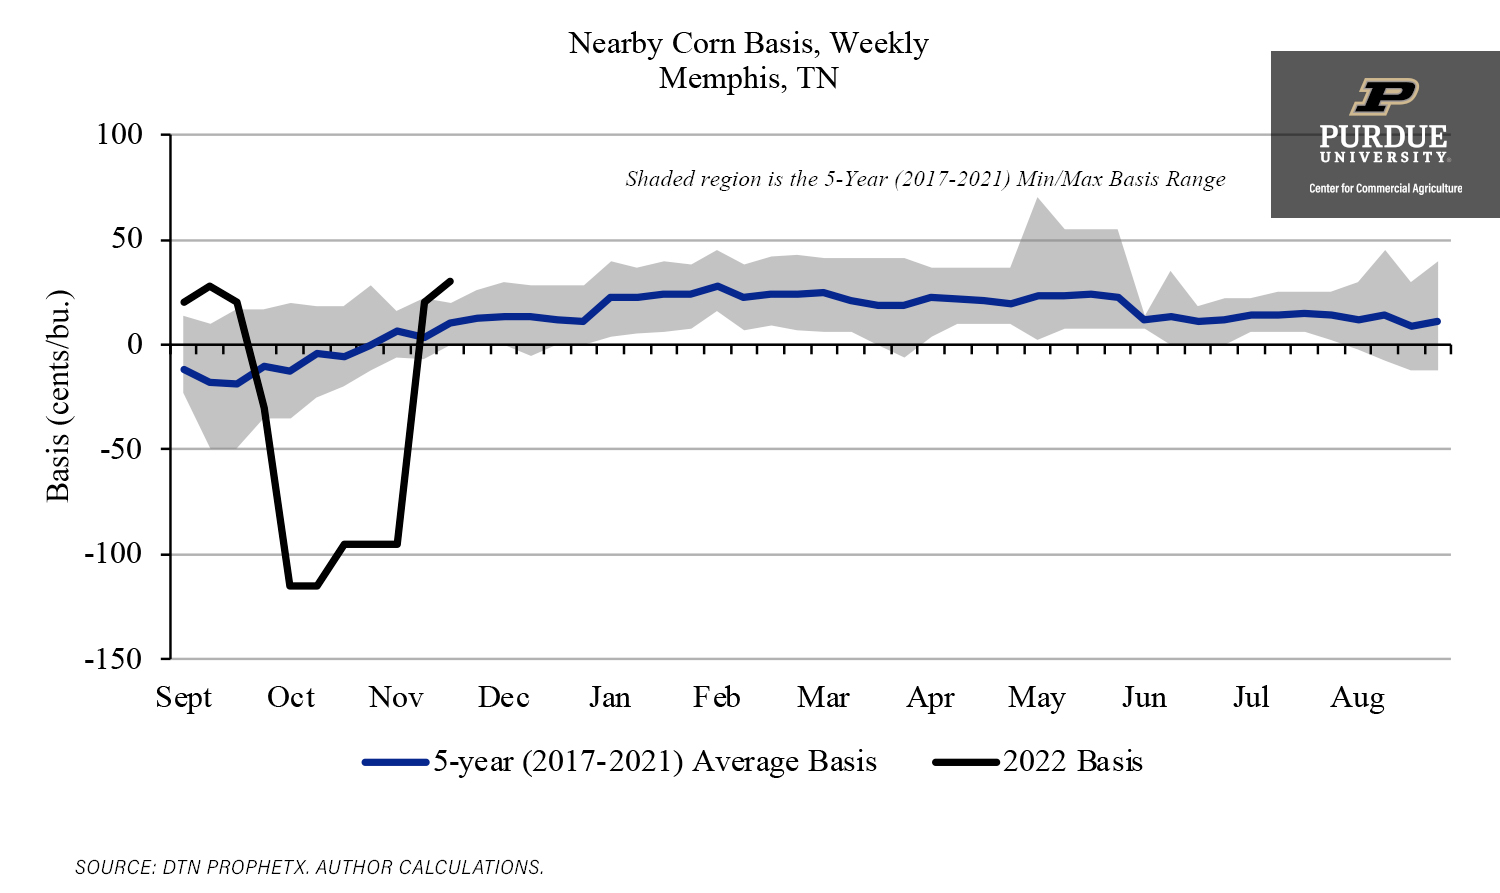
So, what are the implications of this for crop basis levels? Basis illustrates local supply and demand. Therefore, if river terminals cannot move grain, or can only move grain at substantially higher transportation costs, it will impact their demand for corn and soybeans which will be reflected in weaker basis bids.
For example, corn basis in Memphis, TN dropped $1.44/bu. from +$0.28/bu. to -$1.15/bu. in just two weeks from the end of September to the beginning of October. While it is not unusual for basis bids to drop as harvest begins and grain supplies become ample, this large of a drop is not typical. For perspective, the 5-year average basis level for corn the first week of October in Memphis, TN is -$0.13/bu. and the weakest corn basis observed in Memphis for the first week of October in the past 5 years is -$0.35/bu.
In the first 3 weeks of November, corn basis in Memphis, TN has increased $1.25/bu. from -$0.95/bu. to +$0.30/bu. Current basis levels are not just stronger than notable weakness during October, but are stronger than the strongest basis levels observed for the third week of November in the last 5-years. This strengthening in basis is an indication that the declining barge rates are improving movement of grain down the Mississippi River.
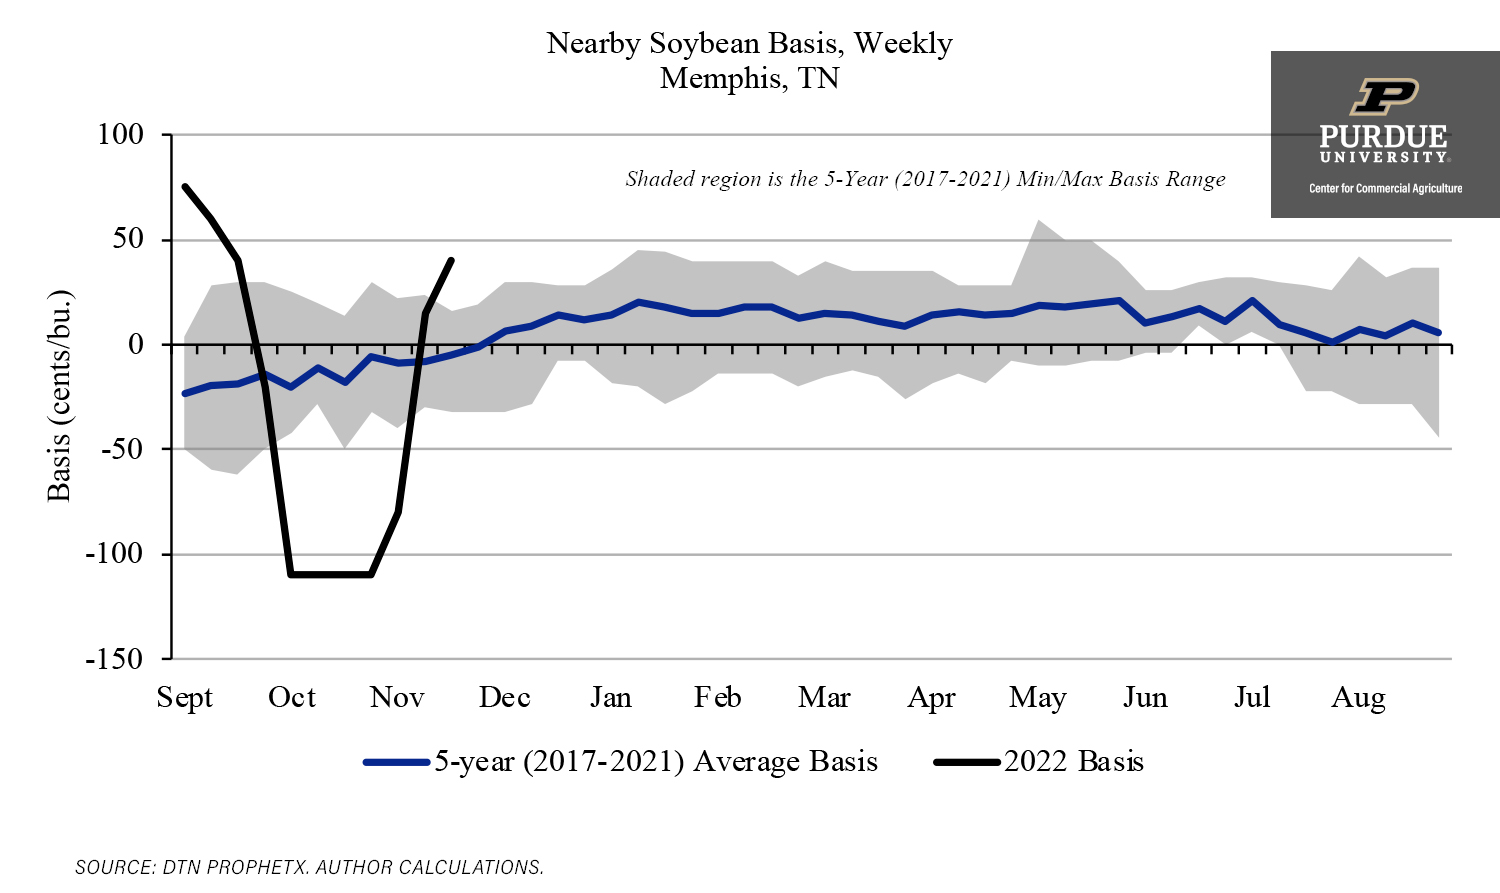
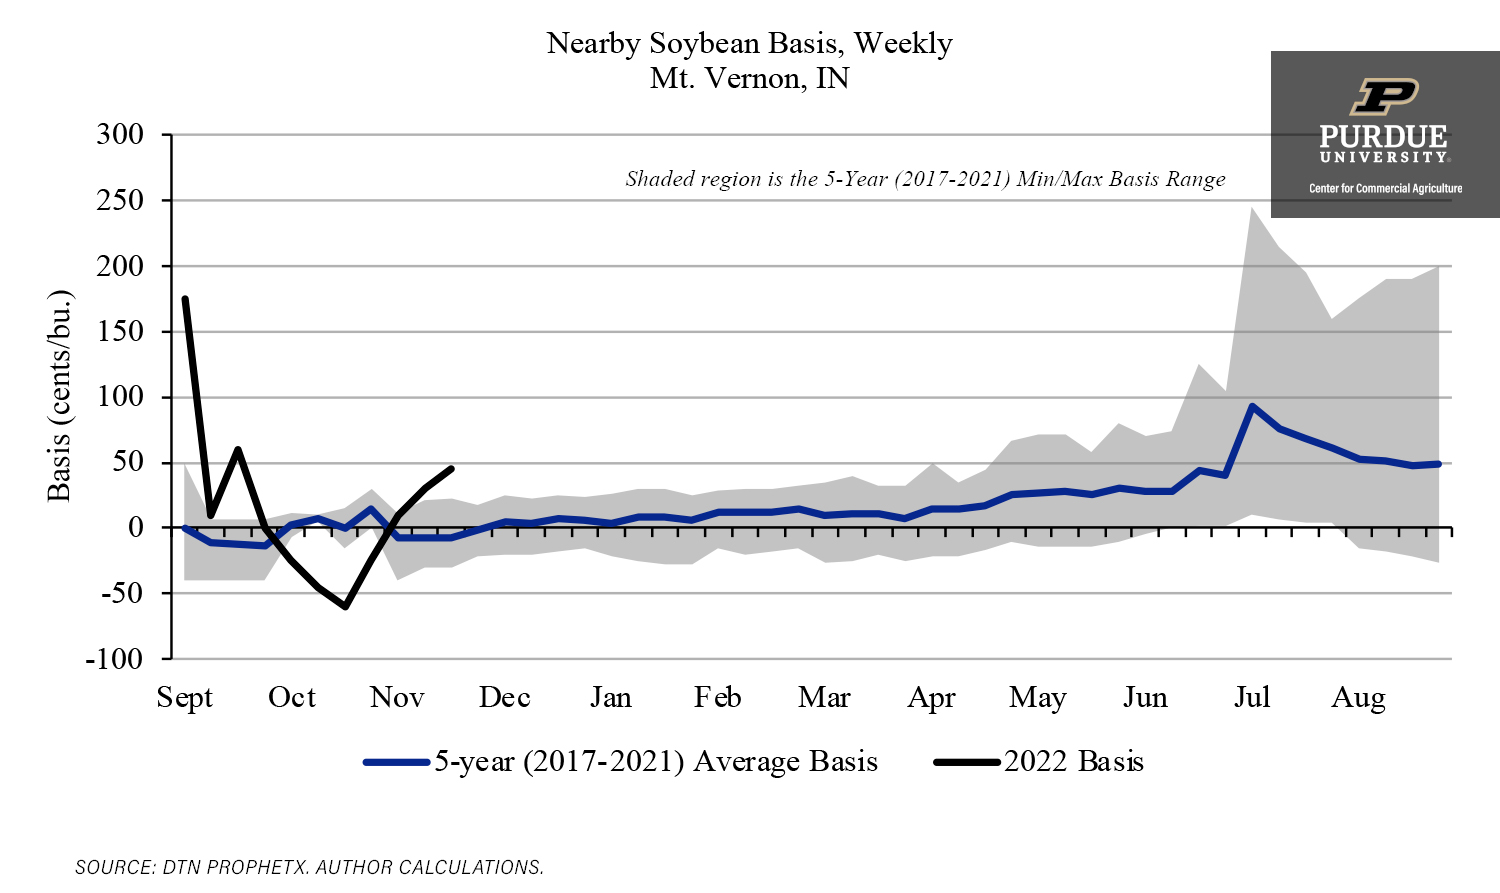
Soybean basis at Memphis, TN has followed a similar pattern to corn, declining sharply in the last few weeks of September and strengthening sharply in the first few weeks of November.
Low river levels and fluctuating barge rates do not just impact farmers who deliver to terminals located on the Mississippi River. Instead, river levels and barge rates impact markets throughout the Eastern Corn Belt that rely on the river as a means for moving grain. As a result, markets along the Ohio River in southern Ohio, Indiana, and Illinois have also been impacted. For example, corn and soybean basis in Mt. Vernon, IN have followed a similar pattern to what has been seen further down river in Memphis, TN.

![]()
![]()
![]()
![]()
![]()
TAGS:
TEAM LINKS:

RELATED RESOURCES
UPCOMING EVENTS
We are taking a short break, but please plan to join us at one of our future programs that is a little farther in the future.